

- Market Size (2026)
- USD 352.5 Mn
- Forecast (2036)
- USD 1085.0 Mn
- CAGR (2026 to 2036)
- 11.9%
How big is Phosphorus Availability Boosters Market in 2026?
Demand for phosphorus availability boosters is projected to expand at 11.9% CAGR between 2026 and 2036. Industry value grows from USD 315.0 million in 2025 to USD 352.5 million in 2026 and is projected to reach USD 1,085.0 million by 2036.
Increasing requirement for improving phosphorus use without adding more fertilizer is supporting demand for phosphorus availability boosters. Microbial solubilizers, mycorrhizal products and root-zone activators helps plants in accessing phosphorus fixed with soil minerals. The market is valued at USD 315.0 million in 2025 and is estimated at USD 352.5 million in 2026. As per FMI, it is expected to attain USD 1,085.0 million by 2036, expanding at 11.9% CAGR from 2026 to 2036. FAO reported agricultural phosphorus use near 44 million tonnes in 2024.[1] This can create growth avenues, however sales depend on viable formulations, placement and crop response under conditions.
Soil testing is creating different adoption routes across South Korea and the USA. South Korea is estimated to grow at 11.6% CAGR between 2026 and 2036, whereas the USA is projected at 11.3% CAGR. Public testing helps South Korean advisers select suitable fields, while dealer-led trials support wider USA testing. The Rural Development Administration reported nearly 550,000 soil tests are conducted every year in South Korea.[2] FMI anticipates prospects where suppliers connect the booster with a diagnosed phosphorus constraint. Prescription fit can influence South Korean sales, while crop results, compatibility and proof of nutrient access will remain important in the USA.
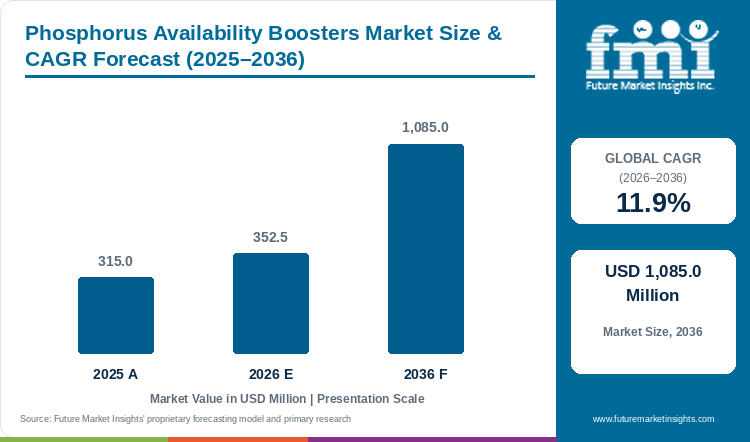
Phosphorus Availability Boosters Market Size & CAGR Forecast (2025-2036)
| Year | Basis | Market value (USD million) |
|---|---|---|
| 2025 | Actual | 315.0 |
| 2026 | Estimate | 352.5 |
| 2036 | Forecast | 1,085.0 |
| CAGR, 2026 to 2036 | 11.9% | |
Source: Future Market Insights proprietary forecasting model and primary research.
Key Takeaways
- Phosphorus-use efficiency supports demand where field evidence links a booster to yield protection, nutrient uptake, or lower avoidable input use.
- Based on product type, single-strain products are projected to account for 47.5% in 2026, owing to simpler formulation control.
- By crop type, cereals and grains are estimated to hold 48.7% in 2026, supported by repeatable broad-acre planting workflows.
- In 2026, soil application is expected to lead application method with 44.4% share because placement occurs near fixed phosphorus.
- South Korea is projected at 11.6% CAGR through 2036, while the USA is forecast at 11.3% through a different channel structure.
- Notable companies include Locus Agricultural Solutions, Sound Agriculture, Rizobacter, Lallemand Plant Care, Indigo Ag, BASF, and Bayer Crop Science.
Analyst Perspective
“I see higher adoption in fields where soil testing shows fixed phosphorus and the product gives consistent crop response. I expect products with stable microbial activity during storage and application will gain better opportunities across different farm conditions.”
- Nikhil Kaitwade, Principal Consultant, Future Market Insights.
How is the phosphorus availability boosters market segmented?
Phosphorus availability boosters market is segmented by five primary commercial axes and region: product type, crop type, application method, farm type, sales channel, and region. In 2026, single-strain products are projected at 47.5%, cereals and grains at 48.7%, soil application at 44.4%, large commercial farms at 43.7%, and agri-input distributors at 48.9%.
By product type: single-strain products, multi-strain consortia, microbe and nutrient combinations, and others.
By crop type: cereals and grains, fruits and vegetables, oilseeds and pulses, turf and ornamentals, and others.
By application method: soil application, foliar application, fertigation or drip, seed application, and others.
By farm type: large commercial farms, mid-size farms, smallholders, greenhouses and nurseries, and others.
By sales channel: agri-input distributors, cooperatives, agri-retail chains, online or direct-to-farm, and others.
By region: North America, Latin America, Western Europe, Eastern Europe, East Asia, South Asia and Pacific, and Middle East and Africa.
Why do single-strain products remain relevant within product type?
Based on product type, single-strain products are projected to account for 47.5% in 2026, supported by controlled strain characterization.
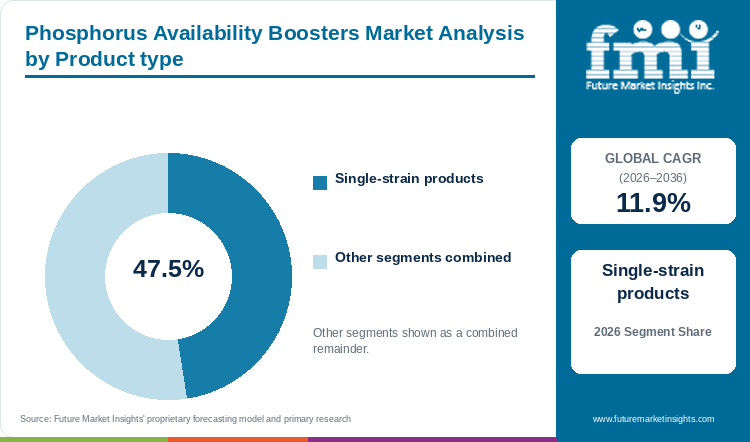
| Product type | Share (2026) |
|---|---|
| Single-strain products | 47.5% |
| Other segments combined | 52.5%* |
| Total | 100.0% |
| Metric | Value |
|---|---|
| Global CAGR (2026-2036) | 11.9% |
| Leading segment | Single-strain products |
FMI research indicates that single-strain products contain one selected microbial strain which makes production, storage and performance monitoring comparatively easier. These products also allow suppliers to provide clear information regarding strain activity and phosphorus solubilization, functioning alongside seedling defense primers in early establishment. Increasing preference for controlled formulation is expected to drive the single-strain products segment, although product response will continue to change with soil condition, moisture and crop timing.
- Single-strain products are projected to hold 47.5% of product type demand in 2026 because formulation control is easier to document.
- Lallemand reports that LALRISE VITA can increase plant-available phosphorus by up to 28% across documented trials.[3]
What supports cereals and grains as the preferred crop category?
By crop type, cereals and grains are estimated to hold 48.7% in 2026, owing to repeatable at-plant treatment.
Cereals and grains are grown over large farm areas and provides a common treatment stage during seed planting or in-furrow application using advanced seed treatment materials. This allows growers to compare treated and untreated areas without making major changes in the existing fertilizer program. Increasing production of cereals and repeated use of planting equipment is expected to support adoption of phosphorus availability boosters in this crop category.
- Cereals and grains are estimated to hold 48.7% of crop type demand in 2026 because planting workflows repeat over large areas.
- USDA ERS reported in March 2025 that fertilizer accounted for 33 to 44 percent of corn operating costs, highlighting input intensity across broad-acre cereal production.[4]
How does soil application meet root-zone phosphorus needs?
In 2026, soil application is expected to lead application method with 44.4% share, driven by direct root-zone placement.
Soil application places the microbial organism or active formulation close to the area where roots absorb available phosphate, functioning alongside seed stress protectors during early crop growth. This contact is important because fixed phosphorus remains attached with soil minerals and is not easily taken up by plants. Increasing requirement for direct root-zone treatment is expected to drive soil application, while seed treatment and fertigation will be used where the formulation and farm equipment supports these methods.
- Soil application is expected to account for 44.4% of 2026 demand because the treatment reaches the phosphorus constraint directly.
- USDA NRCS guidelines updated in 2026 emphasize precision subsurface and banded soil placement to minimize phosphorus losses while improving root-zone bioavailability.[5]
What keeps large commercial farms relevant within farm type?
Large commercial farms are likely to capture 43.7% share in 2026, aided by replicated field measurement over broad acreage.
Large commercial farms can compare treated and untreated strips across different fields and can measure small changes in crop output. The large farm area also makes fertilizer savings or yield improvement visible at the commercial level, especially when integrating boosters with commercial biofertilizers to enhance crop vigor. However, an unsuitable product can result in higher losses across broad acreage, due to which these farms ask for crop-specific data, mixing compatibility and proper application instructions before wider adoption.
- Large commercial farms are projected to hold 43.7% of farm type demand in 2026 because field records support measured trials.
- USDA ERS reported in 2025 that large commercial farms with gross cash farm income over USD 1 million account for the majority of precision soil sampling and variable-rate nutrient applications.[6]
Which conditions keep agri-input distributors relevant in sales channels?
Agri-input distributors are set to lead sales channel with 48.9% share in 2026, underpinned by local agronomy access.
Phosphorus availability boosters require local explanation as product performance changes with soil pH, moisture, storage condition and placement. Agri-input distributors connect these products with existing fertilizer programs, compatible agricultural surfactants, and helps growers in selecting suitable fields for trial. Increasing use of agronomists and fertilizer advisers is expected to support distributor sales, as growers require product guidance before changing a familiar nutrient practice.
- Agri-input distributors are projected to hold 48.9% of 2026 sales because local advisers lower first-use uncertainty.
- Defra reported that 70% of farmers seeking professional help used fertilizer advisers or agronomists, supporting advisory-led distributor channels.[7]
What are the drivers, restraints, and opportunities in the phosphorus availability boosters market?
In the phosphorus availability boosters market, the key driver is nutrient efficiency, the key restraint is field variability, and the key opportunity is diagnostic integration.
- Driver: Growers adopt boosters when measured phosphorus access protects output or reduces avoidable nutrient use.
- Restraint: Response changes with soil chemistry, microbial viability, moisture, placement, and crop timing.
- Opportunity: Soil testing can identify fields where unavailable phosphorus remains a practical crop constraint.
Nutrient Efficiency Changes Purchasing
Increasing phosphorus losses from unsuitable rate, timing and placement is driving the need for better nutrient management products. In March 2026, Northern Ireland consultation papers reported 17.38 thousand tonnes of phosphorus inputs during 2024, with more than half remaining as surplus after production output.[8] The proposed interim balance of 7 kilograms per hectare represents nearly 30% reduction from existing oversupply. This phosphorus surplus does not directly prove the performance of boosters, but it creates a need for products which can improve access to existing nutrients in conjunction with microbial seed primers. Product adoption will rise where field records shows crop response and allows a suitable change in current phosphorus plan.
Field Conditions Change Response
The activity of microbial products changes with soil pH, temperature, moisture, storage and contact with the root zone, similar to variations observed across Trichoderma metabolites. A field study published in December 2025 reported 16.2% average increase in potato yield from one liquid phosphate-solubilizing bacterial formulation under the tested conditions.[9] This result supports the use of the technology, however, the same response cannot be expected in every crop and soil. Lack of consistent field performance is a key factor restraining phosphorus availability boosters market. Clear storage limits, viable-cell information, mixing compatibility and local trials are therefore required before growers reduce conventional phosphorus use.
Diagnostics Create a Product Route
Increasing use of soil testing is creating opportunities for phosphorus availability boosters by identifying fields where plant-available phosphorus remains low. In February 2026, Defra introduced an online nutrient-planning tool which uses soil analysis, crop requirement, expected yield, rainfall and previous crop information for calculating recommendations.[10] Such tools can help advisers in selecting the crop, product rate, application method and field measurement before the first trial. The opportunity is expected to increase where product records can be compared with the earlier fertilizer program and formulations utilize specialized biological seed carriers to demonstrate repeatable improvement in crop response.
Which country CAGRs are profiled in the phosphorus availability boosters market?
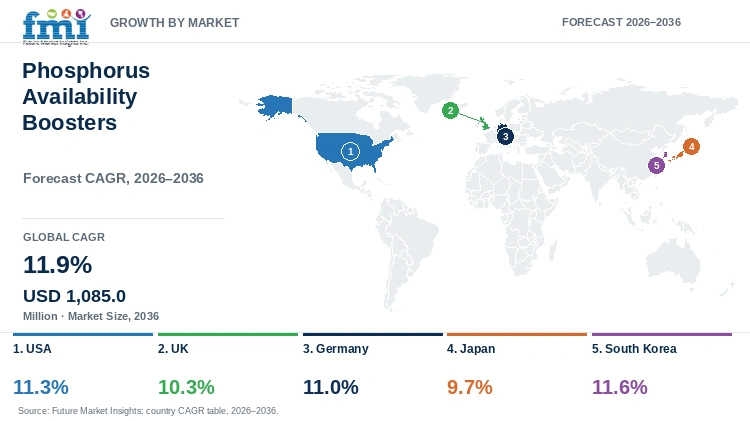
| Country | CAGR |
|---|---|
| USA | 11.3% |
| UK | 10.3% |
| Germany | 11.0% |
| Japan | 9.7% |
| South Korea | 11.6% |
How do country-level CAGRs compare in the phosphorus availability boosters market?
As per the analysis from FMI, phosphorus availability boosters market is expected to witness close to double-digit growth across the selected countries. However, the underlying demand factors are different as South Korea and Japan depends more on soil diagnosis, while the USA uses large field trials and distributor networks. Germany and the UK are expected to gain from stronger nutrient planning and phosphorus management requirements.
- USA demand develops through large-acre dealer networks and nutrient-loss controls.
- The UK links product trials with nutrient plans and regular soil testing.
- Germany combines fertilizer governance with a national phosphorus-recovery timetable.
- Japan requires crop and soil fit before a booster changes the fertilizer plan.
- South Korea connects recommendations with public soil testing and prescription systems.
Full report country CAGRs cover: North America; Latin America; Western Europe; Eastern Europe; East Asia; South Asia and Pacific; Middle East and Africa.
Country-wise Analysis
- The USA phosphorus availability boosters market is projected to grow at 11.3% CAGR, owing to large farm areas and increasing need for limiting nutrient losses. EPA reported that agriculture contributes 90% of phosphorus inputs across the contiguous national landscape, while 60% of assessed flowing-water length was in poor condition for total phosphorus.[11] This condition is increasing the need for measured phosphorus management practices. Large commercial farms can test boosters on selected strips before using the product across wider acreage. Dealers can place suitable products beside seed treatment, fertilizer, or alongside commercial crop-protection tools in integrated management programs. Increasing dealer support and field testing is expected to drive adoption, however, repeated sales will depend on crop response, soil conditions and compatibility with the existing fertilizer plan.
- The UK phosphorus availability boosters market is forecast to rise at 10.3% CAGR, supported by increasing use of nutrient management plans. The Agriculture and Horticulture Development Board (AHDB) maintains the statutory RB209 Nutrient Management Guide, providing an existing route for comparing booster performance with soil indices, crop requirement and phosphate recommendations.[12] Fields having sufficient available phosphorus can also be removed from unnecessary treatment. Defra survey data shows 69% of farmers in England operate formal nutrient plans, driving demand for validated inputs. Increasing use of soil testing and adviser support is expected to drive adoption, while products without an additional benefit over corrected fertilizer timing and placement may witness limited demand.
- Germany's phosphorus availability boosters market is anticipated to advance at 11.0% CAGR, owing to increasing focus on phosphorus recovery and resource efficiency. In September 2026, Ragn-Sells reported progress in construction of the Schkopau Ash2Phos plant, which is scheduled to begin operations in 2027.[13] Germany will also start mandatory phosphorus recovery for covered wastewater facilities from 2029. These developments do not measure the sales of biological boosters, however, they increase attention towards recovery and better use of phosphorus. Suppliers are expected to gain opportunities where soil testing identifies fixed phosphorus and local crop trials shows improved nutrient availability.
- In Japan, phosphorus availability products demand is predicted to advance at 9.7% CAGR through 2036, due to diagnosis-led fertilizer use. MAFF data released in October 2026 showed the fertilizer price index at 149.8 during August, against the 2020 average of 100.[14] FMI data suggests that this structure helps buyers connect a microbial product with its permitted use rather than relying on a broad biological claim. Increasing fertilizer prices are likely to encourage efficient nutrient use, however, higher prices alone does not validate a booster product. Suppliers need to identify crops and soils where phosphorus remains unavailable and provide suitable application instructions. Selective recommendation is expected to limit general use, but it can create stronger opportunities in fields having a properly diagnosed phosphorus constraint.
- South Korea is estimated to post 11.6% CAGR over the forecast period, supported by public soil testing and prescription-based fertilizer use. The Rural Development Administration reported in February 2025 that nearly 550,000 soil tests were conducted every year.[15] This large soil-testing system provides an entry route for boosters where plant-available phosphorus remains low despite phosphorus reserves in soil. It also reduces adoption of unsuitable products which do not match crop and soil conditions. Integration of trial results with Heuktoram fertilizer prescriptions is expected to support market growth and allow advisers to retain suitable products in the following nutrient plan.
Who are the notable companies in the phosphorus availability boosters market?
Locus Agricultural Solutions, Sound Agriculture, Rizobacter (Bioceres), Lallemand Plant Care, Indigo Ag, BASF, and Bayer Crop Science are notable companies profiled in this market.
Phosphorus availability boosters market includes microbial product specialists, biological crop-input companies and integrated agriscience suppliers. In the FMI report, competitive position is connected with root-zone claims and ease of adding the product into planting, irrigation or fertilizer programs. Locus Agricultural Solutions, Sound Agriculture, Rizobacter and Lallemand Plant Care offers products having direct phosphorus-access functions. Indigo Ag provides microbial crop-input products, while BASF and Bayer Crop Science operate through wider agricultural systems supplying commercial bioinsecticides and integrated protection tools. Increasing demand for stable formulation, crop suitability, storage life and local field results is influencing the selection of suppliers. Public information does not establish one company having the largest global share in this defined market.
- Direct phosphorus mobilization platforms: Locus Agricultural Solutions, Sound Agriculture, Rizobacter, and Lallemand Plant Care.
- Microbial crop-input portfolios: Indigo Ag links biological products with established farm and cooperative channels.
- Integrated agriscience platforms: BASF and Bayer Crop Science bring broad development, registration, and commercialization systems.
Competitive Benchmarking: Phosphorus Availability Boosters Market
| Company | P mechanism | Application fit | Current activity | Reach |
|---|---|---|---|---|
| Locus Agricultural Solutions | High | High | High | Medium |
| Sound Agriculture | High | High | High | Medium |
| Rizobacter (Bioceres) | High | Medium | Medium | High |
| Lallemand Plant Care | High | High | Medium | High |
| Indigo Ag | Medium | Medium | High | Medium |
| BASF | Medium | High | High | High |
| Bayer Crop Science | Medium | High | High | High |
High represents wider public evidence for the mentioned criterion, while Medium represents comparatively limited evidence. These ratings only explains the documented capability of companies and does not indicate product quality, company performance or market share ranking.
Key Developments in the Phosphorus Availability Boosters Market
- In March 2026, Bayer published its 2025 annual report describing research commercialization and biological portfolio developments across its Crop Science division.[21]
- In September 2025, Lallemand documented LALFIX START SOYBEAN GR containing multi-strain rhizobia and a phosphorus-solubilizing biofertilizer.[17]
- In August 2025, Lallemand published the USA registration label for LALRISE SHINE DS, a dry seed treatment using Bacillus velezensis to mobilize soil phosphorus.[16]
- In Spring 2025, Indigo Ag released technical documentation for M34 plus N13 biological seed treatment to support soybean nitrogen fixation and phosphorus uptake.[18]
Key Players in the Phosphorus Availability Boosters Market
Direct phosphorus mobilization platforms
- Locus Agricultural Solutions
- Sound Agriculture
- Rizobacter (Bioceres)
- Lallemand Plant Care
Microbial crop-input portfolio
- Indigo Ag
Integrated agriscience platforms
- BASF
- Bayer Crop Science
Phosphorus Availability Boosters Market - Report Scope
| Coverage field | Report scope |
|---|---|
| Market breakdown | Product type; crop type; application method; farm type; sales channel; region |
| Quantitative units | USD million |
| Market definition | Supplier revenue from commercial products sold to improve plant-available phosphorus or phosphorus uptake. Conventional phosphate fertilizers and downstream crop revenue are excluded. |
| Regions covered | North America; Latin America; Western Europe; Eastern Europe; East Asia; South Asia and Pacific; Middle East and Africa |
| Countries covered | USA, UK, Germany, Japan, South Korea, and additional countries in the full report |
| Key companies profiled | Locus Agricultural Solutions, Sound Agriculture, Rizobacter (Bioceres), Lallemand Plant Care, Indigo Ag, BASF, Bayer Crop Science |
| Forecast period | 2026 to 2036 |
| Approach | The Future Market Insights report covers supplier activity, segment structure, application routes, and country adoption within the stated boundary. |
Phosphorus Availability Boosters Market - Research Methodology
| Method | Approach |
|---|---|
| Primary Research | FMI analysts collected information from manufacturers, technology developers, distributors, end users, procurement teams and industry experts. The discussions covered product selection, adoption barriers, approval needs, pricing and technical support. Respondents also provided information regarding the evidence required before a trial or first order is converted into regular purchasing. |
| Desk Research | Desk research included government statistics, regulatory publications, trade information, industry associations, technical literature, standards, company filings and official product information. Every source was checked for publication date, market relevance and geographic coverage. Product performance, approval, capacity and company developments were included only where a reliable public source was available. |
| Market Sizing and Forecasting | Market sizing included the baseline value, historical performance, segment structure, pricing, adoption level, company participation and country demand conditions. The forecast considered economic activity, regulations, technology adoption, purchasing cycles and supply availability. Segment and regional values were checked with the final market total before completing the forecast. |
| Data Validation | Market estimates were checked with public data, company activities, trade patterns, industry developments and primary interviews. Products and company revenues were also checked against the defined market boundary. Adjacent categories, repeated revenue and claims without direct market relevance were removed in order to reduce double counting. |
Phosphorus Availability Boosters Market by Segments
Product type
- Single-strain products
- Multi-strain consortia
- Microbe and nutrient combinations
- Others
Crop type
- Cereals and grains
- Fruits and vegetables
- Oilseeds and pulses
- Turf and ornamentals
- Others
Application method
- Soil application
- Foliar application
- Fertigation or drip
- Seed application
- Others
Farm type
- Large commercial farms
- Mid-size farms
- Smallholders
- Greenhouses and nurseries
- Others
Sales channel
- Agri-input distributors
- Cooperatives
- Agri-retail chains
- Online or direct-to-farm
- Others
Phosphorus Availability Boosters Market by Region
- North America
- United States
- Canada
- Latin America
- Brazil
- Mexico
- Argentina
- Chile
- Western Europe
- Germany
- France
- United Kingdom
- Italy
- Spain
- Benelux
- Nordics
- Eastern Europe
- Poland
- Czech Republic
- Romania
- Hungary
- East Asia
- China
- Japan
- South Korea
- South Asia and Pacific
- India
- ASEAN
- Australia and New Zealand
- Middle East and Africa
- GCC Countries
- South Africa
- Türkiye
- Israel
Research Sources and Bibliography
- [1] Food and Agriculture Organization of the United Nations. (2026, July 30). Inorganic fertilizers, 2015-2024.
- [2] Rural Development Administration, Republic of Korea. (2025, September). Comprehensive soil fertility management and test-based fertilization plan for 2026.
- [3] Lallemand Plant Care. (2025). LALRISE VITA technical trial summary: Root-zone phosphate solubilization and crop response.
- [4] U.S. Department of Agriculture, Economic Research Service. (2025, March 27). Commodity costs and returns: Fertilizer shares of corn and wheat operating costs.
- [5] U.S. Department of Agriculture, Natural Resources Conservation Service. (2026). Conservation practice standard: Nutrient management (Code 590).
- [6] U.S. Department of Agriculture, Economic Research Service. (2025). Adoption of precision agriculture and variable-rate nutrient technologies on commercial farms.
- [7] Department for Environment, Food & Rural Affairs. (2026, June 11). Farm Practices Survey February 2026: Nutrient management and advice on agricultural holdings.
- [8] Department of Agriculture, Environment and Rural Affairs, Northern Ireland. (2026, March 27). Technical subgroup papers: Public consultation on the Nutrients Action Programme 2026-2029 - Paper 2: Phosphorus surplus proposal.
- [9] Bansal, R., Vyas, P., & Sharma, S. (2025, December 3). Formulation and field performance of liquid phosphate-solubilizing bacterial biofertilizer. Frontiers in Microbiology, 16, 1734471.
- [10] Department for Environment, Food & Rural Affairs. (2026, February 4). Farmer productivity boost with new nutrient planning tool on GOV.UK.
- [11] U.S. Environmental Protection Agency. (2026, February 26). Sources and solutions: Agriculture.
- [12] Agriculture and Horticulture Development Board. (2026). Nutrient Management Guide (RB209): Principles of nutrient management and fertilizer use.
- [13] Ragn-Sells Group. (2026, September 15). Building the world's first phosphorus recovery plant: Ash2Phos development in Schkopau.
- [14] Ministry of Agriculture, Forestry and Fisheries, Japan. (2026, January 29). Green cultivation reporting meeting: Soil diagnosis and appropriate fertilization.
- [15] Rural Development Administration, Republic of Korea. (2025, February 28). Plan fertilizer use after soil testing: Nutrient prescription systems.
- [16] Lallemand Plant Care. (2025, August). LALRISE SHINE DS specification label: Bacillus velezensis dry seed treatment.
- [17] Lallemand Plant Care. (2025, September). LALFIX START SOYBEAN GR technical sheet: Multi-strain rhizobia and phosphate solubilizer.
- [18] Indigo Ag. (2025). M34 + N13 biological seed treatment for soybean nutrient-use efficiency.
- [19] Sound Agriculture. (2026). SOURCE + BLUEPRINT 2025 season performance results.
- [20] BASF SE. (2026, February 27). Agricultural Solutions: BASF Report 2025.
- [21] Bayer AG. (2026, March 4). Crop Science: Annual Report 2025.
This bibliography is provided for reader reference. The full report contains the complete reference list and detailed citations.
This Report Answers
- What is Phosphorus Availability Boosters Market worth during 2026?
- What value is Phosphorus Availability Boosters Market projected by 2036?
- Which product type holds notable Phosphorus Availability Boosters Market share?
- Which crop type holds notable Phosphorus Availability Boosters Market share?
- Which countries have notable Phosphorus Availability Boosters Market growth?
- Which companies are notable in Phosphorus Availability Boosters Market today?
Frequently Asked Questions
How large is the Phosphorus Availability Boosters Market expected to be in 2026?
Future Market Insights estimates that the phosphorus availability boosters market will reach USD 352.5 million in 2026. The market is projected to expand further and reach USD 1,085.0 million by 2036.
What CAGR is forecast for the Phosphorus Availability Boosters Market through 2036?
As per FMI, the phosphorus availability boosters market is projected to grow at an 11.9% CAGR from 2026 to 2036. Growth is supported by diagnosis-led efforts to improve access to fixed soil phosphorus.
Which product type holds a notable phosphorus availability boosters demand share in 2026?
Future Market Insights projects single-strain products to hold 47.5% of product type demand in 2026. The segment benefits from controlled strain characterization and simpler viability monitoring.
Which crop type holds a notable phosphorus availability boosters share in 2026?
FMI finds that cereals and grains will hold 48.7% of crop type demand in 2026. Demand is supported by repeatable seed and in-furrow treatment across broad acreage.
Which country has a notable phosphorus availability boosters expansion outlook during the forecast period?
Future Market Insights predicts South Korea to expand at an 11.6% CAGR during the 2026 to 2036 assessment period. Growth is supported by public soil testing and prescription-led fertilizer planning.
Which companies are active in the Phosphorus Availability Boosters Market during 2026?
Notable companies active in the market include Locus Agricultural Solutions, Sound Agriculture, Rizobacter, Lallemand Plant Care, Indigo Ag, BASF, and Bayer Crop Science. These companies are focusing on microbial performance, crop fit, formulation stability, and commercial support.
Preview the report firsthand - request a free sample
Get SampleGet the brochure for pricing and purchase details.
Get PDFTable of Content
- Key Takeaways
- Market Size and CAGR
- Top Growth Driver
- Fastest Growing Segment
- Leading Region
- Key Companies
- Emerging Opportunities
- Executive Summary
- Global Market Outlook
- Demand-side Trends
- Supply-side Trends
- Technology Roadmap Analysis
- Analysis and Recommendations
- Analyst Perspective (What is happening? Why now? What should investors know?)
- Key Questions Answered
- How large is the market?
- What is the CAGR?
- What are key trends?
- Which region dominates?
- Who are the leaders?
- Market Overview
- Market Coverage / Taxonomy
- Market Definition / Scope / Limitations
- Research Methodology
- Chapter Orientation
- Analytical Lens and Working Hypotheses
- Market Structure, Signals, and Trend Drivers
- Benchmarking and Cross-market Comparability
- Market Sizing, Forecasting, and Opportunity Mapping
- Research Design and Evidence Framework
- Desk Research Programme (Secondary Evidence)
- Expert Input and Fieldwork (Primary Evidence)
- Tooling, Models, and Reference Databases
- Data Engineering and Model Build
- Quality Assurance and Audit Trail
- Market Background
- Market Dynamics (Drivers, Restraints, Opportunity, Trends)
- Scenario Forecast (Optimistic, Likely, Conservative)
- Impact Analysis
- AI Impact
- Sustainability Impact
- Regulatory Impact
- Technology Impact
- Consumer / Buyer Analysis
- Purchase Drivers
- Adoption Barriers
- Buyer Journey
- Opportunity Map Analysis
- Product Life Cycle Analysis
- Supply Chain Analysis
- Investment Feasibility Matrix
- Value Chain Analysis
- PESTLE and Porter's Analysis
- Regulatory Landscape
- Regional Parent Market Outlook
- Production and Consumption Statistics
- Import and Export Statistics
- Global Market Analysis and Forecast, 2021 to 2036
- Historical Market Size Value (USD Million) Analysis, 2021 to 2025
- Current and Future Market Size Value (USD Million) Projections, 2026 to 2036
- Y-o-Y Growth Trend Analysis
- Absolute $ Opportunity Analysis
- Global Market Pricing Analysis, 2021 to 2036
- Global Market Analysis and Forecast, By Product type, 2021 to 2036
- Introduction / Key Findings
- Historical Market Size Value (USD Million) Analysis By Product type, 2021 to 2025
- Current and Future Market Size Value (USD Million) Analysis and Forecast By Product type, 2026 to 2036
- Single-strain products
- Multi-strain consortia
- Microbe and nutrient combinations
- Others
- Y-o-Y Growth Trend Analysis By Product type, 2021 to 2025
- Absolute $ Opportunity Analysis By Product type, 2026 to 2036
- Global Market Analysis and Forecast, By Crop type, 2021 to 2036
- Introduction / Key Findings
- Historical Market Size Value (USD Million) Analysis By Crop type, 2021 to 2025
- Current and Future Market Size Value (USD Million) Analysis and Forecast By Crop type, 2026 to 2036
- Cereals and grains
- Fruits and vegetables
- Oilseeds and pulses
- Turf and ornamentals
- Others
- Y-o-Y Growth Trend Analysis By Crop type, 2021 to 2025
- Absolute $ Opportunity Analysis By Crop type, 2026 to 2036
- Global Market Analysis and Forecast, By Application method, 2021 to 2036
- Introduction / Key Findings
- Historical Market Size Value (USD Million) Analysis By Application method, 2021 to 2025
- Current and Future Market Size Value (USD Million) Analysis and Forecast By Application method, 2026 to 2036
- Soil application
- Foliar application
- Fertigation or drip
- Seed application
- Others
- Y-o-Y Growth Trend Analysis By Application method, 2021 to 2025
- Absolute $ Opportunity Analysis By Application method, 2026 to 2036
- Global Market Analysis and Forecast, By Farm type, 2021 to 2036
- Introduction / Key Findings
- Historical Market Size Value (USD Million) Analysis By Farm type, 2021 to 2025
- Current and Future Market Size Value (USD Million) Analysis and Forecast By Farm type, 2026 to 2036
- Large commercial farms
- Mid-size farms
- Smallholders
- Greenhouses and nurseries
- Others
- Y-o-Y Growth Trend Analysis By Farm type, 2021 to 2025
- Absolute $ Opportunity Analysis By Farm type, 2026 to 2036
- Global Market Analysis and Forecast, By Sales channel, 2021 to 2036
- Introduction / Key Findings
- Historical Market Size Value (USD Million) Analysis By Sales channel, 2021 to 2025
- Current and Future Market Size Value (USD Million) Analysis and Forecast By Sales channel, 2026 to 2036
- Agri-input distributors
- Cooperatives
- Agri-retail chains
- Online or direct-to-farm
- Others
- Y-o-Y Growth Trend Analysis By Sales channel, 2021 to 2025
- Absolute $ Opportunity Analysis By Sales channel, 2026 to 2036
- Global Market Analysis and Forecast, By Region, 2021 to 2036
- Introduction
- Historical Market Size Value (USD Million) Analysis By Region, 2021 to 2025
- Current Market Size Value (USD Million) Analysis and Forecast By Region, 2026 to 2036
- North America
- Latin America
- Western Europe
- Eastern Europe
- East Asia
- South Asia and Pacific
- Middle East and Africa
- Market Attractiveness Analysis By Region
- North America Market Analysis and Forecast, By Country, 2021 to 2036
- Historical Market Size Value (USD Million) Trend Analysis By Market Taxonomy, 2021 to 2025
- Market Size Value (USD Million) Forecast By Market Taxonomy, 2026 to 2036
- By Country
- United States
- Canada
- By Product type
- By Crop type
- By Application method
- By Farm type
- By Sales channel
- By Country
- Market Attractiveness Analysis
- By Country
- By Product type
- By Crop type
- By Application method
- By Farm type
- By Sales channel
- Key Takeaways
- Latin America Market Analysis and Forecast, By Country
- Historical Market Size Value (USD Million) Trend Analysis By Market Taxonomy, 2021 to 2025
- Market Size Value (USD Million) Forecast By Market Taxonomy, 2026 to 2036
- By Country
- Brazil
- Mexico
- Argentina
- Chile
- By Product type
- By Crop type
- By Application method
- By Farm type
- By Sales channel
- By Country
- Market Attractiveness Analysis
- By Country
- By Product type
- By Crop type
- By Application method
- By Farm type
- By Sales channel
- Key Takeaways
- Western Europe Market Analysis and Forecast, By Country
- Historical Market Size Value (USD Million) Trend Analysis By Market Taxonomy, 2021 to 2025
- Market Size Value (USD Million) Forecast By Market Taxonomy, 2026 to 2036
- By Country
- Germany
- France
- United Kingdom
- Italy
- Spain
- Benelux
- Nordics
- By Product type
- By Crop type
- By Application method
- By Farm type
- By Sales channel
- By Country
- Market Attractiveness Analysis
- By Country
- By Product type
- By Crop type
- By Application method
- By Farm type
- By Sales channel
- Key Takeaways
- Eastern Europe Market Analysis and Forecast, By Country
- Historical Market Size Value (USD Million) Trend Analysis By Market Taxonomy, 2021 to 2025
- Market Size Value (USD Million) Forecast By Market Taxonomy, 2026 to 2036
- By Country
- Poland
- Czech Republic
- Romania
- Hungary
- By Product type
- By Crop type
- By Application method
- By Farm type
- By Sales channel
- By Country
- Market Attractiveness Analysis
- By Country
- By Product type
- By Crop type
- By Application method
- By Farm type
- By Sales channel
- Key Takeaways
- East Asia Market Analysis and Forecast, By Country
- Historical Market Size Value (USD Million) Trend Analysis By Market Taxonomy, 2021 to 2025
- Market Size Value (USD Million) Forecast By Market Taxonomy, 2026 to 2036
- By Country
- China
- Japan
- South Korea
- By Product type
- By Crop type
- By Application method
- By Farm type
- By Sales channel
- By Country
- Market Attractiveness Analysis
- By Country
- By Product type
- By Crop type
- By Application method
- By Farm type
- By Sales channel
- Key Takeaways
- South Asia and Pacific Market Analysis and Forecast, By Country
- Historical Market Size Value (USD Million) Trend Analysis By Market Taxonomy, 2021 to 2025
- Market Size Value (USD Million) Forecast By Market Taxonomy, 2026 to 2036
- By Country
- India
- ASEAN
- Australia and New Zealand
- By Product type
- By Crop type
- By Application method
- By Farm type
- By Sales channel
- By Country
- Market Attractiveness Analysis
- By Country
- By Product type
- By Crop type
- By Application method
- By Farm type
- By Sales channel
- Key Takeaways
- Middle East and Africa Market Analysis and Forecast, By Country
- Historical Market Size Value (USD Million) Trend Analysis By Market Taxonomy, 2021 to 2025
- Market Size Value (USD Million) Forecast By Market Taxonomy, 2026 to 2036
- By Country
- GCC Countries
- South Africa
- Türkiye
- Israel
- By Product type
- By Crop type
- By Application method
- By Farm type
- By Sales channel
- By Country
- Market Attractiveness Analysis
- By Country
- By Product type
- By Crop type
- By Application method
- By Farm type
- By Sales channel
- Key Takeaways
- Key Countries Market Analysis
- United States
- Pricing Analysis
- Market Share Analysis, 2025
- By Product type
- By Crop type
- By Application method
- By Farm type
- By Sales channel
- Canada
- Pricing Analysis
- Market Share Analysis, 2025
- By Product type
- By Crop type
- By Application method
- By Farm type
- By Sales channel
- Mexico
- Pricing Analysis
- Market Share Analysis, 2025
- By Product type
- By Crop type
- By Application method
- By Farm type
- By Sales channel
- Brazil
- Pricing Analysis
- Market Share Analysis, 2025
- By Product type
- By Crop type
- By Application method
- By Farm type
- By Sales channel
- Chile
- Pricing Analysis
- Market Share Analysis, 2025
- By Product type
- By Crop type
- By Application method
- By Farm type
- By Sales channel
- Germany
- Pricing Analysis
- Market Share Analysis, 2025
- By Product type
- By Crop type
- By Application method
- By Farm type
- By Sales channel
- United Kingdom
- Pricing Analysis
- Market Share Analysis, 2025
- By Product type
- By Crop type
- By Application method
- By Farm type
- By Sales channel
- Italy
- Pricing Analysis
- Market Share Analysis, 2025
- By Product type
- By Crop type
- By Application method
- By Farm type
- By Sales channel
- Spain
- Pricing Analysis
- Market Share Analysis, 2025
- By Product type
- By Crop type
- By Application method
- By Farm type
- By Sales channel
- France
- Pricing Analysis
- Market Share Analysis, 2025
- By Product type
- By Crop type
- By Application method
- By Farm type
- By Sales channel
- India
- Pricing Analysis
- Market Share Analysis, 2025
- By Product type
- By Crop type
- By Application method
- By Farm type
- By Sales channel
- ASEAN
- Pricing Analysis
- Market Share Analysis, 2025
- By Product type
- By Crop type
- By Application method
- By Farm type
- By Sales channel
- Australia and New Zealand
- Pricing Analysis
- Market Share Analysis, 2025
- By Product type
- By Crop type
- By Application method
- By Farm type
- By Sales channel
- China
- Pricing Analysis
- Market Share Analysis, 2025
- By Product type
- By Crop type
- By Application method
- By Farm type
- By Sales channel
- Japan
- Pricing Analysis
- Market Share Analysis, 2025
- By Product type
- By Crop type
- By Application method
- By Farm type
- By Sales channel
- South Korea
- Pricing Analysis
- Market Share Analysis, 2025
- By Product type
- By Crop type
- By Application method
- By Farm type
- By Sales channel
- Poland
- Pricing Analysis
- Market Share Analysis, 2025
- By Product type
- By Crop type
- By Application method
- By Farm type
- By Sales channel
- Hungary
- Pricing Analysis
- Market Share Analysis, 2025
- By Product type
- By Crop type
- By Application method
- By Farm type
- By Sales channel
- Türkiye
- Pricing Analysis
- Market Share Analysis, 2025
- By Product type
- By Crop type
- By Application method
- By Farm type
- By Sales channel
- South Africa
- Pricing Analysis
- Market Share Analysis, 2025
- By Product type
- By Crop type
- By Application method
- By Farm type
- By Sales channel
- United States
- Market Structure Analysis
- Competition Dashboard
- Competition Benchmarking
- Market Share Analysis of Top Players
- By Regional
- By Product type
- By Crop type
- By Application method
- By Farm type
- By Sales channel
- Emerging Startups
- Innovation Benchmarking
- Competition Analysis
- Competition Deep Dive
- Locus Agricultural Solutions
- Overview
- Product Portfolio
- Profitability by Market Segments
- Sales Footprint
- Strategy Overview
- Marketing Strategy
- Product Strategy
- Channel Strategy
- Sound Agriculture
- Rizobacter (Bioceres)
- Lallemand Plant Care
- Indigo Ag
- BASF
- Bayer Crop Science
- Locus Agricultural Solutions
- Case Studies
- Success Stories
- Recent Developments
- Competition Deep Dive
- Assumptions & Acronyms Used


