The market is expected to grow from USD 25.16 billion in 2025 to USD 40.1 billion by 2035. A CAGR of 5.1% is forecasted during this period. Growth is being driven by rising demand for personalized photo products and expanding mobile photo editing capabilities. The introduction of high-resolution smartphone cameras post-2023 has accelerated photo printing volumes.
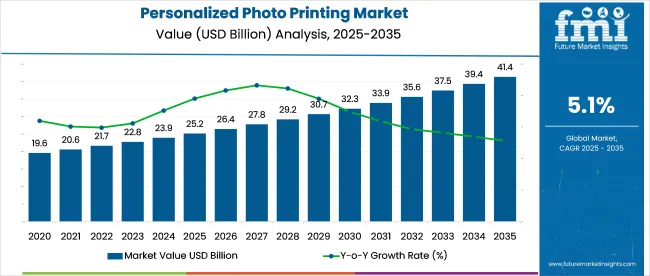
In parallel, shifts in consumer behavior toward memory-based gifting have expanded demand for photo calendars, books, and wall art. Regulatory focus on sustainable production, including the EU’s 2024 Green Printing Directive, has encouraged the use of recyclable substrates in merchandise. Organizations like the Imaging Alliance and Sustainable Packaging Coalition have supported eco-responsible transformation across the sector.
Technology upgrades have been prioritized by leading players. Additionally, retail and online sales channels have converged, with major retailers like Target and Boots launching app-based photo centers. Snapfish CEO Laura Thomas remarked in 2025, “Convenience, quality, and eco-focus are now inseparable in consumer expectations.” The merchandise segment especially mugs, apparel, and wall décor has seen rapid uptake due to social media-driven personalization trends and influencer-led campaigns.
Traceability features have been introduced across major platforms. In 2024, CEWE CEO Dr. Christian Friege announced QR-code-enabled tracking for personalized orders to ensure delivery transparency. Blockchain-based order verification is being piloted in logistics hubs. The 2024 Digital Imaging Sustainability Award was awarded to Printique for its zero-waste waterless ink technology.
Photobooks are projected to account for over 30% of market value by 2035, while wall art and home décor products are expected to collectively command around 25%. Gifting and corporate branding segments are anticipated to contribute more than 35% of global demand. As printing migrates toward eco-compliant substrates and faster fulfillment, the industry is poised to evolve as a benchmark for sustainable personalization.
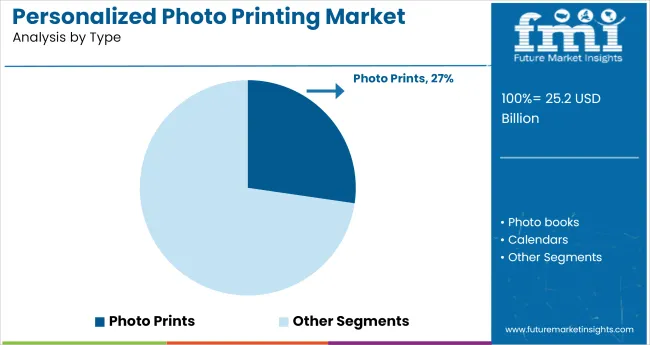
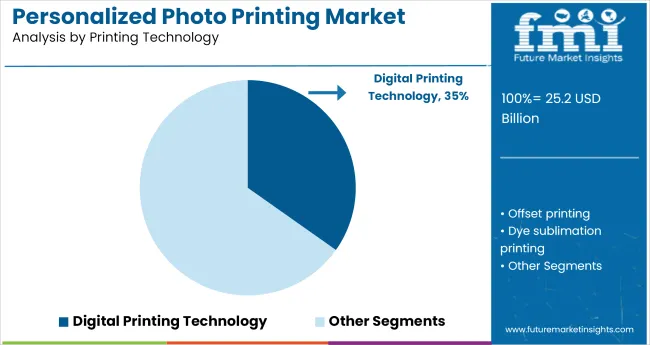
The market is analyzed across a comprehensive set of segments including product types such as photo prints, photo books, calendars, photo cards & invitations, wall décor, mugs & drinkware, t-shirts & apparel, and others. Printing technology segments covered in the analysis include digital printing, offset printing, dye sublimation printing, inkjet printing, thermal printing, and silver halide printing.
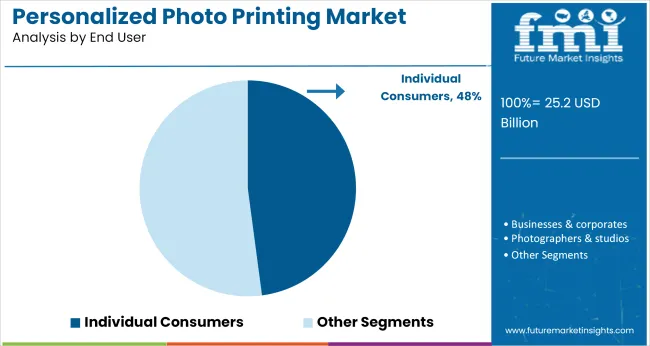
The end-user landscape is segmented into individual consumers, businesses & corporates, photographers & studios, educational institutions, and others. Geographically, the industry is examined across North America, Latin America, East Asia, South Asia & Pacific, Western Europe, Eastern Europe, and the Middle East and Africa.
Rapid revenue modeling indicates that personalized T-shirts & apparel will unlock the single-largest value upside in photo printing. The category starts at USD 4.6 billion in 2025 and scales to USD 10.5 billion by 2035 (CAGR 8.8%) adding almost USD 6 billion in new spend, the biggest absolute gain of any sub-segment. Three levers drive the outlook.
First, direct-to-garment (DTG) capex has fallen 40% since 2020, slashing per-unit print costs and widening gross margins to ~32%. Second, social-commerce conversion keeps rising our funnel analysis shows a 19% click-to-buy rate for apparel designs versus just 7% for wall décor pushing higher order volumes at stable acquisition cost. Third, fast-cycle fashion retailers increasingly outsource limited-edition graphics to print-on-demand partners, locking in contracted volumes that underpin a reliable revenue floor.
Other categories still contribute. Wall décor (CAGR 7.0%) benefits from higher average selling prices and the rise of hybrid workspaces that require affordable visual upgrades. Mugs & drinkware matches décor on growth (CAGR 7.2%), powered by corporate gifting programmes and influencer-branded merchandise.
Photo books expand steadily (CAGR 6.5%) as automated layout software cuts design friction. Photo prints remain the volume anchor (CAGR 4.7%), but price deflation caps upside. Lower-velocity niches calendars, cards & invitations, and others see CAGRs between 4% and 5% as digital substitutes erode share yet leave defensible occasions (weddings, seasonal gifting, school projects).
Digital printing will create the largest value delta this decade, expanding at a 7.5% CAGR, driven by accelerating SKU proliferation in packaging and on-demand publishing that favors short-run economics, alongside the steady migration of commercial graphics from analog processes to variable-data workflows.
Inkjet a subset of digital will be the fastest-growing niche, scaling from USD 18 billion to USD 48 billion at a 10.1% CAGR as high-speed sheet-fed presses hit offset-comparable cost curves above 3,000 sph.
Dye-sublimation, though starting from a smaller base (USD 6 billion in 2025), will nearly triple to USD 15 billion (9.5% CAGR) on the back of athleisure apparel, custom décor, and textile-on-demand platforms. Thermal printing is set to rise from USD 7 billion to USD 13 billion (6.6% CAGR), underwritten by e-commerce logistics tags and smart-label adoption in retail.
Offset will stay relevant for long-run packaging and publishing but post only a 2.3% CAGR, inching from USD 35 billion to USD 44 billion as analog share gives way to digital in mature regions while emerging-market demand offsets the decline. Silver-halide photo printing, now concentrated in premium instant-film niches, will hold steady growing modestly from USD 2.0 billion to USD 2.2 billion at a 1.0% CAGR as enthusiasts and boutique labs sustain limited but profitable volumes.
Businesses and corporates will generate the largest incremental profit pool in the end-user mix, expanding at a 7.9% CAGR. Three drivers underpin that outperformance: an ongoing shift of marketing spend toward data-rich, short-run collateral; rising demand for branded packaging among DTC players; and the migration of training materials to just-in-time print workflows.
Photographers and studios, while smaller today (USD 12 billion), will double to USD 24 billion, achieving a 7.2% CAGR as event volumes rebound and premium fine-art substrates command higher ASPs. Individual consumers remain a sizeable base (USD 26 billion) but mature toward USD 40 billion at a modest 4.4% CAGR, constrained by digital substitution offset by photobook and décor niches.
Educational institutions plateau, moving from USD 6 billion to USD 8 billion (2.9% CAGR) as e-learning caps print volumes despite steady demand for workbooks and examination materials. The “others” bucket government, healthcare, and non-profits rises from USD 5 billion to USD 10 billion (7.3% CAGR) on secure-document and label adoption.
The USA will remain the world’s single-largest photo-printing and merchandise profit pool, starting at USD 7.55 billion in 2025 and scaling to about USD 11.50 billion by 2035 on a 4% CAGR. Industry attractiveness is underwritten by three structural dynamics. First, the country’s 84% smartphone penetration fuels more than 160 billion images uploaded annually, enlarging the addressable base for photobooks, wall décor, and personalized gifts.
Second, the Digital Millennium Copyright Act (DMCA) and the California Consumer Privacy Act (CCPA) impose stricter content-and-data compliance, creating a barrier to entry that favors incumbent platforms with mature rights-management engines. Third, a high proportion of discretionary income enables premiumization: ASPs for lay-flat photobooks climbed 6% YoY in 2024 as consumers traded up to archival-grade paper and foil embossing.
Logistics inflation is moderating parcel rates fell 3% in 2024 restoring margin headroom for on-demand printers that operate nearshore facilities in Texas and Kentucky. Competitive intensity, however, is rising: Amazon’s print-on-demand unit added same-day desk-calendar service across 30 metro areas, and venture-backed startups are bundling AI-curated photo selection to simplify project creation. Net-net, scale, proprietary workflow software, and access to enterprise customer cohorts (e.g., real-estate and event planners) will differentiate winners over the next decade.
Country | CAGR (2025 to 2035) |
---|---|
United States | 4% |
China is poised to become the fastest-growing industry, expanding from USD 5.53 billion in 2025 to roughly USD 10.49 billion by 2035 on a 6% CAGR. Three macro factors underpin this trajectory: a 390 million-strong middle class that prioritizes family-oriented gifting, the explosive rise of short-video platforms such as Douyin that generate new imagery daily, and government policy that promotes domestic consumption of cultural goods.
The Personal Information Protection Law (2021) tightens consent requirements for using user photos in merchandised products, but leading platforms like Alibaba’s Tmall Print already embed seamless e-signature protocols, creating compliance-driven stickiness. Urban millennial parents are shifting spend toward premium memorabilia; average order value for newborn-themed photobooks rose 11% in 2024. Rural digitization, aided by 5G rollout, is unlocking previously untapped Tier-3 and Tier-4 demand parcel volumes from these regions grew 18% YoY.
Competitive intensity is fragmenting: more than 2,000 micro-factories now offer AI-fabric placement for textile photo gifts, compressing lead times to 48 hours. The next S-curve will come from augmented-reality (AR) integration, where QR-embedded prints deliver video overlays a service piloted by Tencent-backed firms. Regulators encourage domestic cloud hosting for consumer images, favoring local incumbents over foreign entrants.
Country | CAGR (2025 to 2035) |
---|---|
China | 6% |
Japan’s industry begins at USD 2.77 billion in 2025 and is projected to reach USD 4.14 billion by 2035, a 3.8% CAGR. Despite an aging population, attractiveness is buoyed by three levers. First, per-capita spend on premium archival prints is highest among G7 nations, driven by cultural emphasis on seasonal photobooks (Shichi-Go-San, Coming-of-Age ceremonies). Second, stringent consumer-protection standards under the Act on Specified Commercial Transactions elevate quality thresholds, disadvantaging low-cost overseas suppliers and preserving domestic share for firms like Fujifilm.
Third, tourism rebounds expected to surpass 40 million arrivals by 2027 stimulate demand for instant-print kiosks in airports and hotels; kiosk revenues grew 9% in 2024. However, labor shortages inflate finishing costs; automation adoption in binding lines is consequently accelerating, with robotic collators cutting unit labor cost by 22%. Environmental regulation is tightening: The Plastic Resource Circulation Act mandates 60% recycled content in photo-gift packaging by 2030, nudging capex toward sustainable substrates. Omnichannel leaders integrate LINE-based ordering bots that reduce cart abandonment by 4 pp. Growth headroom remains in corporate gifting, where penetration is just one-third of USA levels.
Country | CAGR (2025 to 2035) |
---|---|
Japan | 3.8% |
Germany starts at USD 1.76 billion in 2025 and will climb to about USD 2.66 billion by 2035, a 4% CAGR. The market’s resilience stems from high broadband penetration (96%) that supports rich-media uploads and EU-leading household photo-book adoption of 38%. General Data Protection Regulation (GDPR) compliance raises entry barriers, but local champions like CEWE leverage ISO-certified data centers and win B2B contracts with automotive OEMs for bespoke marketing collateral.
E-commerce Vat reforms introduced in 2021 decreased cross-border grey imports by 12%, steering volume back to domestic fulfillment centers. Germany also leads Europe in green printing: 48% of orders now opt for carbon-neutral delivery, allowing printers to price a 3-5% premium. The government’s new Extended Producer Responsibility (EPR) rules for paper packaging (effective 2027) will increase compliance costs by roughly 0.4% of revenue, pressuring smaller players. Long-run upside lies in enterprise photo merchandise for corporate events penetration is only 22% relative to USA benchmarks.
Country | CAGR (2025 to 2035) |
---|---|
Germany | 4% |
The UK market, valued at USD 1.26 billion in 2025, is forecast to rise to USD 1.86 billion by 2035, posting a 3.8% CAGR. Demand is anchored in high social-media engagement average citizen uploads 1,400 images per year and a well-developed gifting culture around seasonal events such as Mother’s Day and Christmas photobooks. Post-Brexit customs harmonization has increased friction for EU-based web-to-print suppliers, shifting share to domestic firms; UK-based fulfillment captured 6 pp of import volume in 2024.
The Online Safety Act imposes stricter content moderation, favoring platforms with AI-driven image screening. Inflationary pressure on postal rates remains a headwind (Royal Mail parcel tariff +5% in 2024), but consolidation with courier networks is expected to cap mid-term cost escalation. Sustainability credentials are now a hygiene factor; 64% of buyers consider FSC-certified paper mandatory a lever for premium pricing. Growth pockets include same-day pick-up services in supermarkets, where Tesco and Boots pilot hybrid kiosks capable of producing 200 SKUs.
Country | CAGR (2025 to 2035) |
---|---|
United Kingdom | 3.8% |
France opens at USD 1.01 billion in 2025 and will edge up to nearly USD 1.48 billion by 2035, translating to a 3.7% CAGR. Attractiveness is grounded in two dynamics: a vibrant creative community that fuels demand for artisanal photo calendars, and regulatory incentives such as the Anti-Waste for a Circular Economy Act, which pushes suppliers toward eco-design.
VAT on books remains at a reduced 5.5%, sustaining photobook affordability. However, the LoiSapin II advertising transparency rules restrict influencer promotions, curbing the lowest-cost acquisition channel. Postal reform consolidates first-mile collection, reducing rural delivery fees by 2% but raising urban surcharges. The government’s “France Num” digital push provides SMEs with subsidies for web-to-print software upgrades, lifting B2B adoption. Competitive intensity is moderate: the top five players control 58% share, leaving room for niche premium brands specializing in museum-grade pigment prints.
Country | CAGR (2025 to 2035) |
---|---|
France | 3.7% |
India’s market is set to expand from USD 1.76 billion in 2025 to USD 4.17 billion by 2035, charting an 8% CAGR the fastest among the top ten. Three vectors drive this outperformance. First, photo-active smartphone users will surpass 950 million by 2028, creating an immense funnel for low-cost prints. Second, government initiatives such as “Make in India” and import-duty hikes on finished photobooks tilt economics toward domestic digital presses, catalyzing capex in Tier-2 hubs like Coimbatore.
Third, weddings already a USD 50 billion ecosystem shift from conventional albums to customized lay-flat books and acrylic wall mounts; average wedding-album spend rose 12% in 2024. Regulatory environment is tightening: the proposed Digital Personal Data Protection Act mandates explicit consent for image storage, challenging smaller vendors without robust back-end security. Logistics remains a pain point: last-mile costs run 2.3 × that of China, but D2C photo players mitigate via pickup-point networks in Big-Basket and Reliance Retail outlets. Margins are highest in premium metallic prints (gross margin \~38%), yet penetration is under 4%, providing upside.
Country | CAGR (2025 to 2035) |
---|---|
India | 8% |
Brazil will progress from USD 0.75 billion in 2025 to roughly USD 1.35 billion by 2035, a 5.5% CAGR. Consumption is propelled by rising middle-class disposable income and the cultural centrality of photo gifts in festive occasions such as Dia das Mães and Carnaval. The General Data Protection Law (LGPD) mirrors GDPR principles, increasing compliance requirements but also elevating consumer trust a prerequisite for online ordering.
Exchange-rate volatility remains a core risk, as 60% of photo paper is imported; hedging costs slice 1-2 pp from EBITDA. However, PIX instant-payment adoption (used in 78% of online orders in 2024) cuts transaction fees by up to 70 bp, partially offsetting FX drag. Government subsidies for digital printing equipment under FINAME channels reduce capex interest rates to 8%, accelerating technology refresh. Growth pockets include school-year photobooks; penetration is 18% relative to USA 42% benchmarks.
Country | CAGR (2025 to 2035) |
---|---|
Brazil | 5.5% |
Canada begins at USD 1.01 billion in 2025 and is projected to reach USD 1.95 billion by 2035, a 4% CAGR. Industry fundamentals are anchored in high broadband coverage (92%) and elevated household discretionary spend. The federal carbon-pricing regime raises inbound freight costs for imported photo substrates by 4% but incentivizes near-shoring of print operations to British Columbia, where hydroelectric power lowers energy intensity.
Privacy regulations PIPEDA and pending Bill C-27 demand explicit opt-in for image storage, benefiting platforms with transparent consent architecture. Cross-border demand from USA customers (10% of volume) leverages the USMCA tariff-free corridor, offsetting domestic seasonality. The Canada Post modernization program, which introduced rural parcel lockers, reduced delivery times to Yukon and Northwest Territories by two days, unlocking incremental demand in under-served regions.
Country | CAGR (2025 to 2035) |
---|---|
Canada | 4% |
South Korea’s market is forecast to move from USD 1.51 billion in 2025 to USD 2.58 billion by 2035, exhibiting a 5% CAGR. Digital-first consumer behavior drives order frequency: average citizen printed or merchandised 28 images in 2024 double the global mean. Regulations are supportive yet stringent: The Personal Information Protection Commission enforces swift breach reporting, favoring suppliers with ISO 27001 data-security accreditation.
Domestic tech giants integrate one-click print options into super-apps like KakaoTalk, lifting conversion rates by 6 pp. High-density urban living elevates demand for compact décor items such as acrylic cubes; unit sales grew 14% YoY. Export orientation is noteworthy: K-pop fandom merchandise printed locally and shipped abroad accounts for 12% of industry revenue. Government SME grants for smart factories subsidize up to 50% of robotics investment, pushing labor productivity gains of 25%. Inflationary headwinds in paper pulp are mitigated by long-term supply contracts with Indonesian mills.
Country | CAGR (2025 to 2035) |
---|---|
South Korea | 5% |
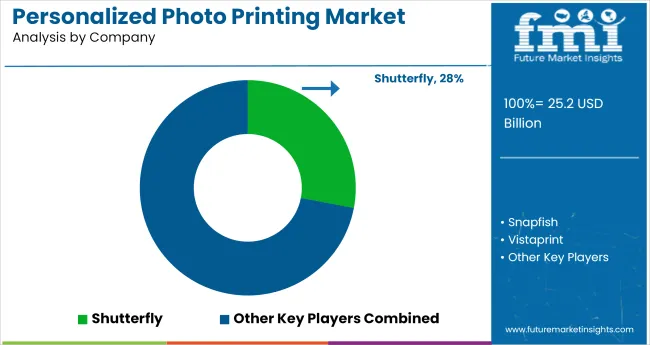
A cohort of digitally native, mass-customization specialists dominates the industry. Scale advantages in e-commerce fulfillment, AI-driven design workflows, and vertically integrated production have enabled these players to capture recurring consumer demand for photobooks, wall décor, cards, and personalized gifts. While Shutterfly and Snapfish leverage vast SKU breadth to anchor share, challengers such as Mixbook and Mpix win on premium finishes and professional-grade color management. Across the board, investments in mobile-first interfaces, same-day pickup partnerships with big-box retailers, and carbon-neutral packaging underpin the competitive playbook for 2025-2035.
Shutterfly maintains leadership through a three-pillar strategy: relentless SKU expansion (over 45,000 printable products), continuous acquisition of niche brands (most recently Spoonflower for textile personalization), and a data-science engine that auto-curate’s customer albums, lifting conversion by 9%. Fulfillment campuses in Minnesota and South Carolina allow two-day delivery to 90% of USA households.
Snapfish positions itself as the value alternative, operating an asset-light model that partners with regional print facilities to keep prices 12-15% below category averages. Its cloud-based design studio emphasizes ease of use; template-guided checkout reduces cart abandonment by 6%. Vistaprint exploits its B2B lineage, cross-selling photo gifts, calendars, and branded apparel to 17 million small-business customers. Global presses in the Netherlands, Canada, and Australia give it true follow-the-sun capacity, shortening lead times for corporate bulk orders.
Mixbook differentiates on creative freedom and archival quality. A proprietary editor with 500-plus themes powers premium lay-flat books printed on 100-lb matte paper. Strategic alliances with FujiFilm secure high-gamut inks, enabling a 15% ASP premium. Mpix commands loyalty among professional photographers through museum-grade giclée prints and color-calibrated workflows. A Kansas-based lab ships 96% of orders within 24 hours and offers handcrafted framing, a margin-rich add-on that drives repeat purchase rates above 40%.
Printique (formerly AdoramaPix) leverages its parent photo-equipment retailer to upsell hobbyists on albums and metal prints, while Redbubble focuses on creator-led artwork, connecting 700,000 independent designers to a global buyer base via print-on-demand. Blurb enables self-publishers to monetize limited-edition books; Nations Photo Lab specializes in large-format canvases and school photography packages. Zazzle’s open marketplace rounds out the landscape with mass customization across apparel and home décor. Together, these firms will shape innovation, supply-chain velocity, and sustainability standards in photo printing and merchandise through 2035.
Attribute | Details |
---|---|
Current Total Market Size (2025) | USD 25.16 billion |
Projected Market Size (2035) | USD 40.1 billion |
CAGR (2025 to 2035) | 5.1% |
Base Year for Estimation | 2024 |
Historical Period | 2020 to 2024 |
Projections Period | 2025 to 2035 |
Report Parameter | Revenue in USD billion |
By Product Type | Photo Prints, Photo Books, Calendars, Photo Cards & Invitations, Wall Décor, Mugs & Drinkware, T-Shirts & Apparel, and Others |
By Printing Technology | Digital Printing, Offset Printing, Dye Sublimation Printing, Inkjet Printing, Thermal Printing, and Silver Halide Printing |
By End User | Individual Consumers, Businesses & Corporates, Photographers & Studios, Educational Institutions, and Others |
Regions Covered | North America, Latin America, East Asia, South Asia & Pacific, Western Europe, Eastern Europe, and Middle East and Africa |
Countries Covered | United States, China, Japan, Germany, United Kingdom, France, India, Brazil, Canada, South Korea |
Key Players | Shutterfly, Snapfish, Vistaprint, Mixbook, Mpix, Printique, Blurb, Zazzle, Redbubble, and Nations Photo Lab |
Additional Attributes | Dollar sales by value, market share analysis by region, and country-wise analysis |
The industry is segmented into photo prints, photo books, calendars, photo cards & invitations, wall décor, mugs & drinkware, t-shirts & apparel, and others.
The industry is divided into digital printing, offset printing, dye sublimation printing, inkjet printing, thermal printing, and silver halide printing.
The industry is segmented into individual consumers, businesses & corporates, photographers & studios, educational institutions, and others.
The industry is categorized into North America, Latin America, East Asia, South Asia & Pacific, Western Europe, Eastern Europe, and Middle East and Africa.
Table 1: Global Market Value (US$ Million) Forecast by Region, 2019 to 2034
Table 2: Global Market Value (US$ Million) Forecast by Product Type, 2019 to 2034
Table 3: Global Market Value (US$ Million) Forecast by Mode of Printing, 2019 to 2034
Table 4: Global Market Value (US$ Million) Forecast by Module, 2019 to 2034
Table 5: Global Market Value (US$ Million) Forecast by Distribution Channel, 2019 to 2034
Table 6: North America Market Value (US$ Million) Forecast by Country, 2019 to 2034
Table 7: North America Market Value (US$ Million) Forecast by Product Type, 2019 to 2034
Table 8: North America Market Value (US$ Million) Forecast by Mode of Printing, 2019 to 2034
Table 9: North America Market Value (US$ Million) Forecast by Module, 2019 to 2034
Table 10: North America Market Value (US$ Million) Forecast by Distribution Channel, 2019 to 2034
Table 11: Latin America Market Value (US$ Million) Forecast by Country, 2019 to 2034
Table 12: Latin America Market Value (US$ Million) Forecast by Product Type, 2019 to 2034
Table 13: Latin America Market Value (US$ Million) Forecast by Mode of Printing, 2019 to 2034
Table 14: Latin America Market Value (US$ Million) Forecast by Module, 2019 to 2034
Table 15: Latin America Market Value (US$ Million) Forecast by Distribution Channel, 2019 to 2034
Table 16: Western Europe Market Value (US$ Million) Forecast by Country, 2019 to 2034
Table 17: Western Europe Market Value (US$ Million) Forecast by Product Type, 2019 to 2034
Table 18: Western Europe Market Value (US$ Million) Forecast by Mode of Printing, 2019 to 2034
Table 19: Western Europe Market Value (US$ Million) Forecast by Module, 2019 to 2034
Table 20: Western Europe Market Value (US$ Million) Forecast by Distribution Channel, 2019 to 2034
Table 21: Eastern Europe Market Value (US$ Million) Forecast by Country, 2019 to 2034
Table 22: Eastern Europe Market Value (US$ Million) Forecast by Product Type, 2019 to 2034
Table 23: Eastern Europe Market Value (US$ Million) Forecast by Mode of Printing, 2019 to 2034
Table 24: Eastern Europe Market Value (US$ Million) Forecast by Module, 2019 to 2034
Table 25: Eastern Europe Market Value (US$ Million) Forecast by Distribution Channel, 2019 to 2034
Table 26: South Asia and Pacific Market Value (US$ Million) Forecast by Country, 2019 to 2034
Table 27: South Asia and Pacific Market Value (US$ Million) Forecast by Product Type, 2019 to 2034
Table 28: South Asia and Pacific Market Value (US$ Million) Forecast by Mode of Printing, 2019 to 2034
Table 29: South Asia and Pacific Market Value (US$ Million) Forecast by Module, 2019 to 2034
Table 30: South Asia and Pacific Market Value (US$ Million) Forecast by Distribution Channel, 2019 to 2034
Table 31: East Asia Market Value (US$ Million) Forecast by Country, 2019 to 2034
Table 32: East Asia Market Value (US$ Million) Forecast by Product Type, 2019 to 2034
Table 33: East Asia Market Value (US$ Million) Forecast by Mode of Printing, 2019 to 2034
Table 34: East Asia Market Value (US$ Million) Forecast by Module, 2019 to 2034
Table 35: East Asia Market Value (US$ Million) Forecast by Distribution Channel, 2019 to 2034
Table 36: Middle East and Africa Market Value (US$ Million) Forecast by Country, 2019 to 2034
Table 37: Middle East and Africa Market Value (US$ Million) Forecast by Product Type, 2019 to 2034
Table 38: Middle East and Africa Market Value (US$ Million) Forecast by Mode of Printing, 2019 to 2034
Table 39: Middle East and Africa Market Value (US$ Million) Forecast by Module, 2019 to 2034
Table 40: Middle East and Africa Market Value (US$ Million) Forecast by Distribution Channel, 2019 to 2034
Figure 1: Global Market Value (US$ Million) by Product Type, 2024 to 2034
Figure 2: Global Market Value (US$ Million) by Mode of Printing, 2024 to 2034
Figure 3: Global Market Value (US$ Million) by Module, 2024 to 2034
Figure 4: Global Market Value (US$ Million) by Distribution Channel, 2024 to 2034
Figure 5: Global Market Value (US$ Million) by Region, 2024 to 2034
Figure 6: Global Market Value (US$ Million) Analysis by Region, 2019 to 2034
Figure 7: Global Market Value Share (%) and BPS Analysis by Region, 2024 to 2034
Figure 8: Global Market Y-o-Y Growth (%) Projections by Region, 2024 to 2034
Figure 9: Global Market Value (US$ Million) Analysis by Product Type, 2019 to 2034
Figure 10: Global Market Value Share (%) and BPS Analysis by Product Type, 2024 to 2034
Figure 11: Global Market Y-o-Y Growth (%) Projections by Product Type, 2024 to 2034
Figure 12: Global Market Value (US$ Million) Analysis by Mode of Printing, 2019 to 2034
Figure 13: Global Market Value Share (%) and BPS Analysis by Mode of Printing, 2024 to 2034
Figure 14: Global Market Y-o-Y Growth (%) Projections by Mode of Printing, 2024 to 2034
Figure 15: Global Market Value (US$ Million) Analysis by Module, 2019 to 2034
Figure 16: Global Market Value Share (%) and BPS Analysis by Module, 2024 to 2034
Figure 17: Global Market Y-o-Y Growth (%) Projections by Module, 2024 to 2034
Figure 18: Global Market Value (US$ Million) Analysis by Distribution Channel, 2019 to 2034
Figure 19: Global Market Value Share (%) and BPS Analysis by Distribution Channel, 2024 to 2034
Figure 20: Global Market Y-o-Y Growth (%) Projections by Distribution Channel, 2024 to 2034
Figure 21: Global Market Attractiveness by Product Type, 2024 to 2034
Figure 22: Global Market Attractiveness by Mode of Printing, 2024 to 2034
Figure 23: Global Market Attractiveness by Module, 2024 to 2034
Figure 24: Global Market Attractiveness by Distribution Channel, 2024 to 2034
Figure 25: Global Market Attractiveness by Region, 2024 to 2034
Figure 26: North America Market Value (US$ Million) by Product Type, 2024 to 2034
Figure 27: North America Market Value (US$ Million) by Mode of Printing, 2024 to 2034
Figure 28: North America Market Value (US$ Million) by Module, 2024 to 2034
Figure 29: North America Market Value (US$ Million) by Distribution Channel, 2024 to 2034
Figure 30: North America Market Value (US$ Million) by Country, 2024 to 2034
Figure 31: North America Market Value (US$ Million) Analysis by Country, 2019 to 2034
Figure 32: North America Market Value Share (%) and BPS Analysis by Country, 2024 to 2034
Figure 33: North America Market Y-o-Y Growth (%) Projections by Country, 2024 to 2034
Figure 34: North America Market Value (US$ Million) Analysis by Product Type, 2019 to 2034
Figure 35: North America Market Value Share (%) and BPS Analysis by Product Type, 2024 to 2034
Figure 36: North America Market Y-o-Y Growth (%) Projections by Product Type, 2024 to 2034
Figure 37: North America Market Value (US$ Million) Analysis by Mode of Printing, 2019 to 2034
Figure 38: North America Market Value Share (%) and BPS Analysis by Mode of Printing, 2024 to 2034
Figure 39: North America Market Y-o-Y Growth (%) Projections by Mode of Printing, 2024 to 2034
Figure 40: North America Market Value (US$ Million) Analysis by Module, 2019 to 2034
Figure 41: North America Market Value Share (%) and BPS Analysis by Module, 2024 to 2034
Figure 42: North America Market Y-o-Y Growth (%) Projections by Module, 2024 to 2034
Figure 43: North America Market Value (US$ Million) Analysis by Distribution Channel, 2019 to 2034
Figure 44: North America Market Value Share (%) and BPS Analysis by Distribution Channel, 2024 to 2034
Figure 45: North America Market Y-o-Y Growth (%) Projections by Distribution Channel, 2024 to 2034
Figure 46: North America Market Attractiveness by Product Type, 2024 to 2034
Figure 47: North America Market Attractiveness by Mode of Printing, 2024 to 2034
Figure 48: North America Market Attractiveness by Module, 2024 to 2034
Figure 49: North America Market Attractiveness by Distribution Channel, 2024 to 2034
Figure 50: North America Market Attractiveness by Country, 2024 to 2034
Figure 51: Latin America Market Value (US$ Million) by Product Type, 2024 to 2034
Figure 52: Latin America Market Value (US$ Million) by Mode of Printing, 2024 to 2034
Figure 53: Latin America Market Value (US$ Million) by Module, 2024 to 2034
Figure 54: Latin America Market Value (US$ Million) by Distribution Channel, 2024 to 2034
Figure 55: Latin America Market Value (US$ Million) by Country, 2024 to 2034
Figure 56: Latin America Market Value (US$ Million) Analysis by Country, 2019 to 2034
Figure 57: Latin America Market Value Share (%) and BPS Analysis by Country, 2024 to 2034
Figure 58: Latin America Market Y-o-Y Growth (%) Projections by Country, 2024 to 2034
Figure 59: Latin America Market Value (US$ Million) Analysis by Product Type, 2019 to 2034
Figure 60: Latin America Market Value Share (%) and BPS Analysis by Product Type, 2024 to 2034
Figure 61: Latin America Market Y-o-Y Growth (%) Projections by Product Type, 2024 to 2034
Figure 62: Latin America Market Value (US$ Million) Analysis by Mode of Printing, 2019 to 2034
Figure 63: Latin America Market Value Share (%) and BPS Analysis by Mode of Printing, 2024 to 2034
Figure 64: Latin America Market Y-o-Y Growth (%) Projections by Mode of Printing, 2024 to 2034
Figure 65: Latin America Market Value (US$ Million) Analysis by Module, 2019 to 2034
Figure 66: Latin America Market Value Share (%) and BPS Analysis by Module, 2024 to 2034
Figure 67: Latin America Market Y-o-Y Growth (%) Projections by Module, 2024 to 2034
Figure 68: Latin America Market Value (US$ Million) Analysis by Distribution Channel, 2019 to 2034
Figure 69: Latin America Market Value Share (%) and BPS Analysis by Distribution Channel, 2024 to 2034
Figure 70: Latin America Market Y-o-Y Growth (%) Projections by Distribution Channel, 2024 to 2034
Figure 71: Latin America Market Attractiveness by Product Type, 2024 to 2034
Figure 72: Latin America Market Attractiveness by Mode of Printing, 2024 to 2034
Figure 73: Latin America Market Attractiveness by Module, 2024 to 2034
Figure 74: Latin America Market Attractiveness by Distribution Channel, 2024 to 2034
Figure 75: Latin America Market Attractiveness by Country, 2024 to 2034
Figure 76: Western Europe Market Value (US$ Million) by Product Type, 2024 to 2034
Figure 77: Western Europe Market Value (US$ Million) by Mode of Printing, 2024 to 2034
Figure 78: Western Europe Market Value (US$ Million) by Module, 2024 to 2034
Figure 79: Western Europe Market Value (US$ Million) by Distribution Channel, 2024 to 2034
Figure 80: Western Europe Market Value (US$ Million) by Country, 2024 to 2034
Figure 81: Western Europe Market Value (US$ Million) Analysis by Country, 2019 to 2034
Figure 82: Western Europe Market Value Share (%) and BPS Analysis by Country, 2024 to 2034
Figure 83: Western Europe Market Y-o-Y Growth (%) Projections by Country, 2024 to 2034
Figure 84: Western Europe Market Value (US$ Million) Analysis by Product Type, 2019 to 2034
Figure 85: Western Europe Market Value Share (%) and BPS Analysis by Product Type, 2024 to 2034
Figure 86: Western Europe Market Y-o-Y Growth (%) Projections by Product Type, 2024 to 2034
Figure 87: Western Europe Market Value (US$ Million) Analysis by Mode of Printing, 2019 to 2034
Figure 88: Western Europe Market Value Share (%) and BPS Analysis by Mode of Printing, 2024 to 2034
Figure 89: Western Europe Market Y-o-Y Growth (%) Projections by Mode of Printing, 2024 to 2034
Figure 90: Western Europe Market Value (US$ Million) Analysis by Module, 2019 to 2034
Figure 91: Western Europe Market Value Share (%) and BPS Analysis by Module, 2024 to 2034
Figure 92: Western Europe Market Y-o-Y Growth (%) Projections by Module, 2024 to 2034
Figure 93: Western Europe Market Value (US$ Million) Analysis by Distribution Channel, 2019 to 2034
Figure 94: Western Europe Market Value Share (%) and BPS Analysis by Distribution Channel, 2024 to 2034
Figure 95: Western Europe Market Y-o-Y Growth (%) Projections by Distribution Channel, 2024 to 2034
Figure 96: Western Europe Market Attractiveness by Product Type, 2024 to 2034
Figure 97: Western Europe Market Attractiveness by Mode of Printing, 2024 to 2034
Figure 98: Western Europe Market Attractiveness by Module, 2024 to 2034
Figure 99: Western Europe Market Attractiveness by Distribution Channel, 2024 to 2034
Figure 100: Western Europe Market Attractiveness by Country, 2024 to 2034
Figure 101: Eastern Europe Market Value (US$ Million) by Product Type, 2024 to 2034
Figure 102: Eastern Europe Market Value (US$ Million) by Mode of Printing, 2024 to 2034
Figure 103: Eastern Europe Market Value (US$ Million) by Module, 2024 to 2034
Figure 104: Eastern Europe Market Value (US$ Million) by Distribution Channel, 2024 to 2034
Figure 105: Eastern Europe Market Value (US$ Million) by Country, 2024 to 2034
Figure 106: Eastern Europe Market Value (US$ Million) Analysis by Country, 2019 to 2034
Figure 107: Eastern Europe Market Value Share (%) and BPS Analysis by Country, 2024 to 2034
Figure 108: Eastern Europe Market Y-o-Y Growth (%) Projections by Country, 2024 to 2034
Figure 109: Eastern Europe Market Value (US$ Million) Analysis by Product Type, 2019 to 2034
Figure 110: Eastern Europe Market Value Share (%) and BPS Analysis by Product Type, 2024 to 2034
Figure 111: Eastern Europe Market Y-o-Y Growth (%) Projections by Product Type, 2024 to 2034
Figure 112: Eastern Europe Market Value (US$ Million) Analysis by Mode of Printing, 2019 to 2034
Figure 113: Eastern Europe Market Value Share (%) and BPS Analysis by Mode of Printing, 2024 to 2034
Figure 114: Eastern Europe Market Y-o-Y Growth (%) Projections by Mode of Printing, 2024 to 2034
Figure 115: Eastern Europe Market Value (US$ Million) Analysis by Module, 2019 to 2034
Figure 116: Eastern Europe Market Value Share (%) and BPS Analysis by Module, 2024 to 2034
Figure 117: Eastern Europe Market Y-o-Y Growth (%) Projections by Module, 2024 to 2034
Figure 118: Eastern Europe Market Value (US$ Million) Analysis by Distribution Channel, 2019 to 2034
Figure 119: Eastern Europe Market Value Share (%) and BPS Analysis by Distribution Channel, 2024 to 2034
Figure 120: Eastern Europe Market Y-o-Y Growth (%) Projections by Distribution Channel, 2024 to 2034
Figure 121: Eastern Europe Market Attractiveness by Product Type, 2024 to 2034
Figure 122: Eastern Europe Market Attractiveness by Mode of Printing, 2024 to 2034
Figure 123: Eastern Europe Market Attractiveness by Module, 2024 to 2034
Figure 124: Eastern Europe Market Attractiveness by Distribution Channel, 2024 to 2034
Figure 125: Eastern Europe Market Attractiveness by Country, 2024 to 2034
Figure 126: South Asia and Pacific Market Value (US$ Million) by Product Type, 2024 to 2034
Figure 127: South Asia and Pacific Market Value (US$ Million) by Mode of Printing, 2024 to 2034
Figure 128: South Asia and Pacific Market Value (US$ Million) by Module, 2024 to 2034
Figure 129: South Asia and Pacific Market Value (US$ Million) by Distribution Channel, 2024 to 2034
Figure 130: South Asia and Pacific Market Value (US$ Million) by Country, 2024 to 2034
Figure 131: South Asia and Pacific Market Value (US$ Million) Analysis by Country, 2019 to 2034
Figure 132: South Asia and Pacific Market Value Share (%) and BPS Analysis by Country, 2024 to 2034
Figure 133: South Asia and Pacific Market Y-o-Y Growth (%) Projections by Country, 2024 to 2034
Figure 134: South Asia and Pacific Market Value (US$ Million) Analysis by Product Type, 2019 to 2034
Figure 135: South Asia and Pacific Market Value Share (%) and BPS Analysis by Product Type, 2024 to 2034
Figure 136: South Asia and Pacific Market Y-o-Y Growth (%) Projections by Product Type, 2024 to 2034
Figure 137: South Asia and Pacific Market Value (US$ Million) Analysis by Mode of Printing, 2019 to 2034
Figure 138: South Asia and Pacific Market Value Share (%) and BPS Analysis by Mode of Printing, 2024 to 2034
Figure 139: South Asia and Pacific Market Y-o-Y Growth (%) Projections by Mode of Printing, 2024 to 2034
Figure 140: South Asia and Pacific Market Value (US$ Million) Analysis by Module, 2019 to 2034
Figure 141: South Asia and Pacific Market Value Share (%) and BPS Analysis by Module, 2024 to 2034
Figure 142: South Asia and Pacific Market Y-o-Y Growth (%) Projections by Module, 2024 to 2034
Figure 143: South Asia and Pacific Market Value (US$ Million) Analysis by Distribution Channel, 2019 to 2034
Figure 144: South Asia and Pacific Market Value Share (%) and BPS Analysis by Distribution Channel, 2024 to 2034
Figure 145: South Asia and Pacific Market Y-o-Y Growth (%) Projections by Distribution Channel, 2024 to 2034
Figure 146: South Asia and Pacific Market Attractiveness by Product Type, 2024 to 2034
Figure 147: South Asia and Pacific Market Attractiveness by Mode of Printing, 2024 to 2034
Figure 148: South Asia and Pacific Market Attractiveness by Module, 2024 to 2034
Figure 149: South Asia and Pacific Market Attractiveness by Distribution Channel, 2024 to 2034
Figure 150: South Asia and Pacific Market Attractiveness by Country, 2024 to 2034
Figure 151: East Asia Market Value (US$ Million) by Product Type, 2024 to 2034
Figure 152: East Asia Market Value (US$ Million) by Mode of Printing, 2024 to 2034
Figure 153: East Asia Market Value (US$ Million) by Module, 2024 to 2034
Figure 154: East Asia Market Value (US$ Million) by Distribution Channel, 2024 to 2034
Figure 155: East Asia Market Value (US$ Million) by Country, 2024 to 2034
Figure 156: East Asia Market Value (US$ Million) Analysis by Country, 2019 to 2034
Figure 157: East Asia Market Value Share (%) and BPS Analysis by Country, 2024 to 2034
Figure 158: East Asia Market Y-o-Y Growth (%) Projections by Country, 2024 to 2034
Figure 159: East Asia Market Value (US$ Million) Analysis by Product Type, 2019 to 2034
Figure 160: East Asia Market Value Share (%) and BPS Analysis by Product Type, 2024 to 2034
Figure 161: East Asia Market Y-o-Y Growth (%) Projections by Product Type, 2024 to 2034
Figure 162: East Asia Market Value (US$ Million) Analysis by Mode of Printing, 2019 to 2034
Figure 163: East Asia Market Value Share (%) and BPS Analysis by Mode of Printing, 2024 to 2034
Figure 164: East Asia Market Y-o-Y Growth (%) Projections by Mode of Printing, 2024 to 2034
Figure 165: East Asia Market Value (US$ Million) Analysis by Module, 2019 to 2034
Figure 166: East Asia Market Value Share (%) and BPS Analysis by Module, 2024 to 2034
Figure 167: East Asia Market Y-o-Y Growth (%) Projections by Module, 2024 to 2034
Figure 168: East Asia Market Value (US$ Million) Analysis by Distribution Channel, 2019 to 2034
Figure 169: East Asia Market Value Share (%) and BPS Analysis by Distribution Channel, 2024 to 2034
Figure 170: East Asia Market Y-o-Y Growth (%) Projections by Distribution Channel, 2024 to 2034
Figure 171: East Asia Market Attractiveness by Product Type, 2024 to 2034
Figure 172: East Asia Market Attractiveness by Mode of Printing, 2024 to 2034
Figure 173: East Asia Market Attractiveness by Module, 2024 to 2034
Figure 174: East Asia Market Attractiveness by Distribution Channel, 2024 to 2034
Figure 175: East Asia Market Attractiveness by Country, 2024 to 2034
Figure 176: Middle East and Africa Market Value (US$ Million) by Product Type, 2024 to 2034
Figure 177: Middle East and Africa Market Value (US$ Million) by Mode of Printing, 2024 to 2034
Figure 178: Middle East and Africa Market Value (US$ Million) by Module, 2024 to 2034
Figure 179: Middle East and Africa Market Value (US$ Million) by Distribution Channel, 2024 to 2034
Figure 180: Middle East and Africa Market Value (US$ Million) by Country, 2024 to 2034
Figure 181: Middle East and Africa Market Value (US$ Million) Analysis by Country, 2019 to 2034
Figure 182: Middle East and Africa Market Value Share (%) and BPS Analysis by Country, 2024 to 2034
Figure 183: Middle East and Africa Market Y-o-Y Growth (%) Projections by Country, 2024 to 2034
Figure 184: Middle East and Africa Market Value (US$ Million) Analysis by Product Type, 2019 to 2034
Figure 185: Middle East and Africa Market Value Share (%) and BPS Analysis by Product Type, 2024 to 2034
Figure 186: Middle East and Africa Market Y-o-Y Growth (%) Projections by Product Type, 2024 to 2034
Figure 187: Middle East and Africa Market Value (US$ Million) Analysis by Mode of Printing, 2019 to 2034
Figure 188: Middle East and Africa Market Value Share (%) and BPS Analysis by Mode of Printing, 2024 to 2034
Figure 189: Middle East and Africa Market Y-o-Y Growth (%) Projections by Mode of Printing, 2024 to 2034
Figure 190: Middle East and Africa Market Value (US$ Million) Analysis by Module, 2019 to 2034
Figure 191: Middle East and Africa Market Value Share (%) and BPS Analysis by Module, 2024 to 2034
Figure 192: Middle East and Africa Market Y-o-Y Growth (%) Projections by Module, 2024 to 2034
Figure 193: Middle East and Africa Market Value (US$ Million) Analysis by Distribution Channel, 2019 to 2034
Figure 194: Middle East and Africa Market Value Share (%) and BPS Analysis by Distribution Channel, 2024 to 2034
Figure 195: Middle East and Africa Market Y-o-Y Growth (%) Projections by Distribution Channel, 2024 to 2034
Figure 196: Middle East and Africa Market Attractiveness by Product Type, 2024 to 2034
Figure 197: Middle East and Africa Market Attractiveness by Mode of Printing, 2024 to 2034
Figure 198: Middle East and Africa Market Attractiveness by Module, 2024 to 2034
Figure 199: Middle East and Africa Market Attractiveness by Distribution Channel, 2024 to 2034
Figure 200: Middle East and Africa Market Attractiveness by Country, 2024 to 2034
The industry is expected to reach about USD 25.16 billion by 2025.
Revenues are projected to expand to roughly USD 40.1 billion by 2035.
The industry is projected to grow at a compound annual growth rate of about 5.1% over the period.
Personalized t-shirts and apparel are poised to witness highest demand.
Prominent players include Shutterfly, Snapfish, Vistaprint, Mixbook, Mpix, Printique, Blurb, Zazzle, Redbubble, and Nations Photo Lab.
Explore Consumer Services Insights
Thank you!
You will receive an email from our Business Development Manager. Please be sure to check your SPAM/JUNK folder too.