

- Market Size (2026)
- USD 14.2 Mn
- Forecast (2036)
- USD 45.7 Mn
- CAGR (2026 to 2036)
- 12.4%
How big is the pluggable optical modules market in 2026?
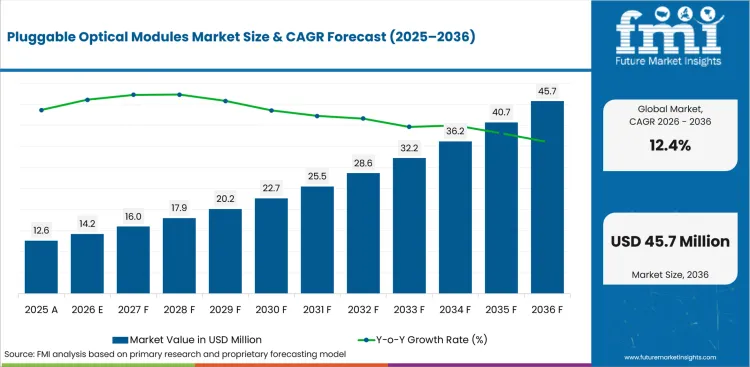
USD 14.2 million in 2026 and USD 45.7 million by 2036 at a 12.4% CAGR.
The pluggable optical modules market is projected to grow from USD 12.6 million in 2025 to USD 45.7 million by 2036 at 12.4% CAGR due to cloud data center port upgrades and staged telecom network migration. QSFP / QSFP-DD is forecast to represent 46.0% share in 2026 due to switch cage compatibility across 100G, 400G, and 800G refresh cycles. The 200G / 400G speed category is expected to secure 38.0% share in 2026, reflecting buyer preference for staged upgrades before wider 800G and 1.6T deployment.
Power and bandwidth planning now shape module selection in the same purchasing cycle. USA Department of Energy reported in December 2024 that data centers used 176 TWh in 2023 and could reach 325 TWh to 580 TWh by 2028. This is important because higher port density makes watts per bit a commercial buying criterion. Cisco Acacia introduced 800G ZR+ and 800ZR coherent pluggables in March 2024, which widens router-hosted interconnect options for metro and regional buyers. Broadcom stated in March 2025 that its Sian3 DSP delivers more than 20% power reduction for 1.6T optical modules. Suppliers therefore compete on optical reach and validated component supply beyond basic optical transceivers alone.
| Metric | Value |
|---|---|
| 2026 Market Size | USD 14.2 million |
| 2036 Market Size | USD 45.7 million |
| Forecast CAGR (2026-2036) | 12.4% |
| Leading Form Factor | QSFP / QSFP-DD |
| QSFP / QSFP-DD Share (2026) | 46.0% |
| Leading Speed | 200G / 400G |
| 200G / 400G Share (2026) | 38.0% |
| Fastest-growing Country | China |
| China CAGR by 2036 | 14.2% |
Summary of the Pluggable Optical Modules Market
| Market Signal | Commercial Impact |
|---|---|
| Demand and Growth Drivers | Demand for pluggable optical modules is increasing as AI infrastructure, hyperscale cloud expansion, and telecom network upgrades require higher-speed, lower-power optical connectivity across data center and metro networks.
|
| Product and Segment View | QSFP/QSFP-DD modules, 200G/400G speeds, short-reach optical modules, cloud data centers, and direct OEM procurement remain the leading market segments.
|
| Geography and Growth Outlook | North America and Asia continue to drive market expansion through hyperscale AI deployments, telecom infrastructure investments, and large-scale optical module manufacturing capabilities.
|
| Competitive Landscape | Competition increasingly centers on high-speed optical technology, coherent networking expertise, manufacturing scale, and qualification for hyperscale deployments.
|
| Analyst Perspective | Pluggable optical modules are evolving from standard networking components into strategic infrastructure assets where speed, thermal performance, firmware reliability, and long-term platform compatibility drive purchasing decisions.
- Sudip Saha, Principal Consultant at Future Market Insights |
Which factors support expansion in the pluggable optical modules market?
Power-aware AI links and coherent metro upgrades support module value across cloud and telecom networks.
- Market value is expected to be supported by AI cluster upgrades that compress the migration path from 400G to 800G optical links.
- Supplier pricing reflects validated electrical-to-optical conversion quality before buyers commit to larger switch-port rollouts.
- Telecom value gains relevance from coherent pluggables that reduce separate transport hardware in selected metro links.
- Margin defense is shaped by 1.6T sampling depth, silicon photonics readiness and DSP power efficiency.
Why is the pluggable optical modules market growing?
AI clusters and telecom metro upgrades are increasing demand for tested high-speed optical links.
Growth is becoming more structured as cloud operators connect optical buying with rack power and switch-port planning. The USA Department of Energy December 2024 update noted that data center electricity demand could account for 6.7% to 12% of total USA electricity by 2028. This pressure makes low-power 800G and 1.6T optics important for operating budgets. Coherent also reported in March 2024 that its 800G QSFP-DD module could deliver up to 1000 km at 800 Gbps in well-designed networks. That evidence supports wider use of router-hosted optics inside optical communication and networking upgrades.
How is the pluggable optical modules market segmented?
The pluggable optical modules industry is segmented by form factor, speed, reach, end use, and sales channel.
- QSFP / QSFP‑DD form factors are projected to account for a 46.0% share in 2026, supported by broad switch compatibility across multiple hardware refresh cycles.
- 200G / 400G modules are anticipated to hold a 38.0% share in 2026, as many network operators delay full migration to 800G architectures.
- Short‑reach optical modules are forecast to secure a 52.0% share in 2026, reflecting repeated deployment across rack‑to‑rack and row‑level interconnects.
- Cloud data centers are projected to represent a 48.0% share in 2026, with hyperscaler qualification standards strongly influencing supplier selection.
- Direct OEM channels are expected to account for a 54.0% share in 2026, as large‑scale deployments require controlled supply chains and documented technical support.
Which form factor category holds a notable share in the pluggable optical modules market?
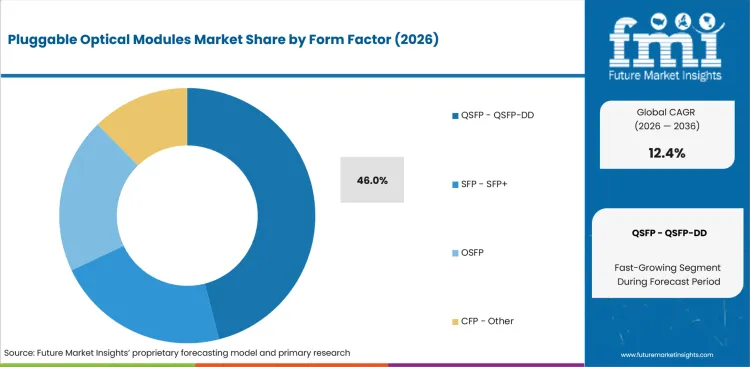
- QSFP / QSFP-DD is projected to hold 46.0% share in 2026 due to installed switch support and reuse across staged upgrades.
- OSFP gains relevance in AI fabrics because higher thermal headroom supports dense 800G and 1.6T port planning.
How does the speed segment perform in the pluggable optical modules market?
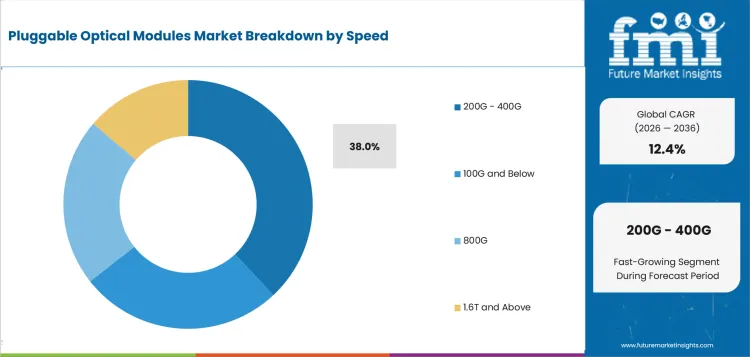
- 200G / 400G is expected to secure 38.0% share in 2026 as buyers balance bandwidth needs against switch refresh budgets.
- 800G demand is concentrated in cloud and AI accounts that require lower power per bit across dense fabric links.
What drives demand across reach categories in the pluggable optical modules market?
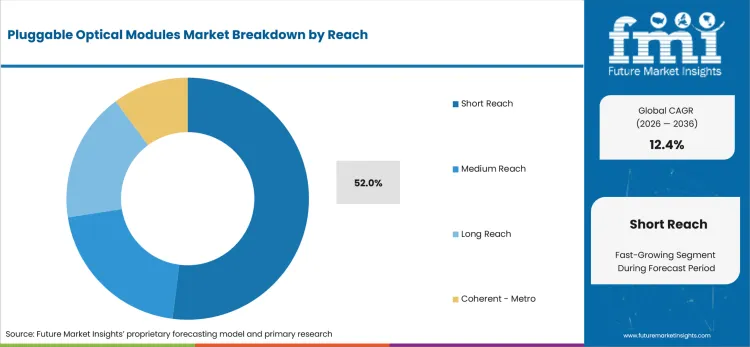
- Short reach is anticipated to account for 52.0% share in 2026 driven by high repeat volumes inside racks and rows.
- Coherent / metro modules carry higher value because service providers need compact optics for regional data center interconnect.
Which end-use segment shows a prominent position in the pluggable optical modules market?
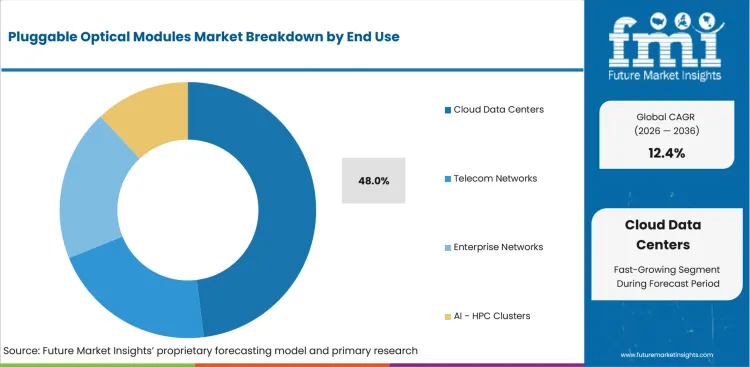
- Cloud data centers are projected to hold 48.0% share in 2026 as hyperscale operators set most high-speed qualification rules.
- Enterprise networks sustain replacement demand for 100G and 400G modules across mixed switch estates and cabling refresh cycles.
How are buyers selecting across sales channel options in the pluggable optical modules market?
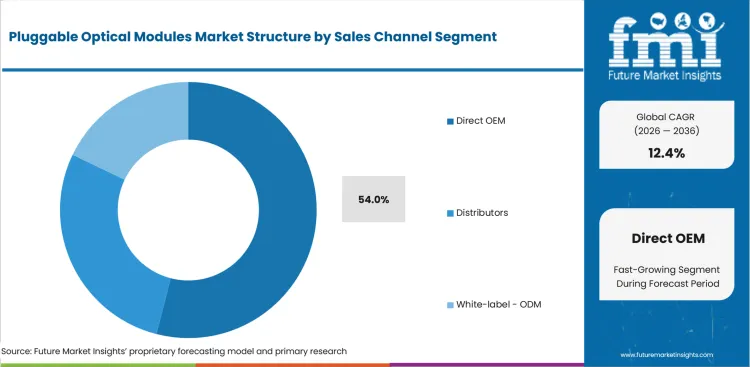
- Direct OEM is expected to represent 54.0% share in 2026 supported by allocation control and platform-linked validation needs.
- Distributors remain important for replacement orders because operators need fast access to multi-speed optics across installed networks.
What are the drivers, restraints, and opportunities in the pluggable optical modules market?
AI fabric port migration supports growth while thermal validation and mature-module price pressure restrain margins.
- Driver: AI fabric port speed is expected to raise demand for 800G modules that reduce fiber count per unit of cluster bandwidth.
- Restraint: Thermal validation can slow adoption because higher lane rates increase rack cooling and qualification costs.
- Opportunity: Coherent metro pluggables can widen deployment by allowing selected routers to handle regional optical transport more directly.
AI Fabric Port Migration
AI fabrics are pulling optical modules into earlier data center design decisions. For instance, Accelink released 1.6T silicon-based optical modules at OFC 2024 and demonstrated 800G LPO modules on a 51.2T switch. This supports qualification beside switch silicon before procurement closes. Suppliers that prove signal integrity and power behavior should gain stronger AI cluster access.
Coherent Metro Compression
Metro networks are using pluggables to reduce the boundary between routing and optical transport. Cisco Acacia introduced 800G ZR+ and 800ZR pluggables in March 2024 for QSFP-DD and OSFP form factors. That development supports router-hosted upgrades for data center interconnect routes.
Thermal Validation Bottleneck
Thermal validation now restrains adoption as 800G and 1.6T modules raise power density inside switch cages. Broadcom stated in March 2025 that Sian3 provides more than 20% power reduction for 1.6T optical modules. This shows why component power efficiency now affects purchasing approval. Better DSPs and silicon photonics testing reduce rejection risk during qualification.
Which countries are growing fastest in the pluggable optical modules market?
China 14.2% CAGR, South Korea 13.1% CAGR, United States 12.9% CAGR, India 12.7% CAGR, Japan 11.3% CAGR, United Kingdom 10.9% CAGR, Germany 10.3% CAGR, and France 10.1% CAGR through 2036.
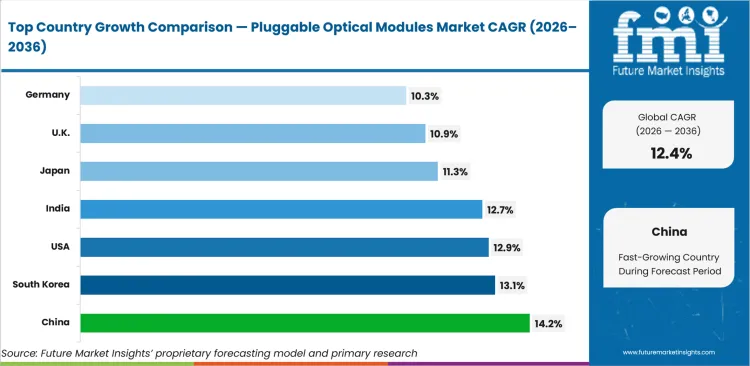
| Country | CAGR |
|---|---|
| China | 14.2% |
| South Korea | 13.1% |
| United States | 12.9% |
| India | 12.7% |
| Japan | 11.3% |
| United Kingdom | 10.9% |
| Germany | 10.3% |
| France | 10.1% |
Source: Future Market Insights, 2026.
How do country-level CAGRs compare in the pluggable optical modules market?
- China is expected to lead with a 14.2% CAGR by 2036, supported by large‑scale telecom deployments and strong domestic optical module manufacturing depth.
- South Korea is projected to register a 13.1% CAGR through 2036, as national AI computing initiatives accelerate demand for high‑speed interconnects.
- The United States is forecast to expand at a 12.9% CAGR from 2026 to 2036, driven by sustained investment in hyperscale AI clusters.
- India is anticipated to grow at a 12.7% CAGR by 2036, with telecom rollout and data center expansion broadening the addressable market.
- Japan is expected to advance at an 11.3% CAGR over the forecast period, supported by continued cloud investment and depth in photonics research.
- The United Kingdom is projected to record a 10.9% CAGR through 2036, as colocation density and supportive data infrastructure policies sustain demand.
- Germany is forecast to post a 10.3% CAGR by 2036, with Frankfurt’s interconnection ecosystem driving measured optical refresh cycles.
- France is expected to grow at a 10.1% CAGR through 2036, where dense fiber networks enable cautious but ongoing cloud and telecom upgrades.
How fast is the pluggable optical modules market growing in the United States?
A 12.9% CAGR through 2036 reflects hyperscale AI cluster expansion and direct qualification by cloud buyers.
Country Market Snapshot Table
| Parameter | Value |
|---|---|
| Market Size in 2025 (Value) | USD 4.1 million |
| Market Size in 2026 (Value) | USD 4.6 million |
| Market Forecast in 2036 (Value) | USD 15.5 million |
| CAGR (2026 to 2036) | 12.9% |
| Years Considered | 2021 to 2036 |
| Base Year | 2025 |
| Forecast Period | 2026 to 2036 |
| Units Considered | Value (USD million) |
| Leading Sub-Region | Northern Virginia and western cloud corridors |
United States Pluggable Optical Modules Market Outlook
United States demand is shaped by hyperscale AI clusters that set early qualification rules for 800G and 1.6T optics. Buyers focus on thermal behavior and firmware support before large switch-port commitments.
Channel behavior is more direct than in most countries because cloud operators qualify modules beside switch platforms. Distributor demand remains relevant for enterprise replacement cycles and mixed-speed network estates.
Key Growth Drivers
- AI cluster growth gives short-reach 800G optics a clear demand base. DOE reported in December 2024 that USA data centers consumed about 4.4% of total electricity in 2023.
- Long-term component supply supports buyer confidence in domestic qualification programs. Lumentum announced a 240,000-square-foot Greensboro facility in March 2026 for InP-based optical devices used in AI data centers.
- Federal broadband funding supports network modernization that can widen fiber equipment replacement needs. NTIA maintains a USD 42.45 billion BEAD program for high-speed internet infrastructure.
- Metro interconnect demand benefits suppliers that combine coherent optics with switch and routing platform qualification across carrier accounts.
Key Restraints
- Power pressure can slow data center commissioning and module pull-through. DOE projected data centers could use 6.7% to 12% of USA electricity by 2028.
- Export controls and supply scrutiny can complicate sourcing for high-speed optical components used in sensitive AI infrastructure.
- Qualification requirements can lengthen sales cycles because hyperscale buyers need heat, firmware, and switch compatibility proof.
What makes United States unique
The United States is unique because hyperscale cloud buyers influence module roadmaps before broader volume shipments begin.
Key Companies
- Coherent
- Lumentum
- Cisco Acacia
- Broadcom
- Source Photonics
Sales & Marketing Channels
- Direct hyperscale enterprise sales
- Switch OEM qualification programs
- Telecom carrier procurement teams
- Distributor replacement channels
- Cloud infrastructure integrators
Country Segment Breakdown Table
| Segment | Sub-Segments |
|---|---|
| By Form Factor | SFP / SFP+ · QSFP / QSFP-DD · OSFP · CFP / Other |
| By Speed | 100G and Below · 200G / 400G · 800G · 1.6T and Above |
| By Reach | Short Reach · Medium Reach · Long Reach · Coherent / Metro |
| By End Use | Cloud Data Centers · Telecom Networks · Enterprise Networks · AI / HPC Clusters |
| By Sales Channel | Direct OEM · Distributors · White-label / ODM |
| Key Sub-Regions Covered, Data Center and Telecom Corridors | Northern Virginia and western cloud corridors |
Frequently Asked Questions
How fast is United States pluggable optical modules market growing?
The market in United States is expected to expand at 12.9% from 2026 to 2036, guided by country-specific cloud and telecom demand.
Who leads United States pluggable optical modules market?
Coherent, Lumentum, Cisco Acacia, Broadcom compete through local customer access, optical infrastructure portfolios, or verified regional channel presence.
What is driving adoption in United States pluggable optical modules market?
AI cluster scale and data center power planning are moving buyers toward validated 800G and early 1.6T modules.
What is the pluggable optical modules market outlook in the United Kingdom?
A 10.9% CAGR through 2036 reflects dense colocation demand and stronger policy attention to data infrastructure.
Country Market Snapshot Table
| Parameter | Value |
|---|---|
| Market Size in 2025 (Value) | USD 0.6 million |
| Market Size in 2026 (Value) | USD 0.7 million |
| Market Forecast in 2036 (Value) | USD 2.0 million |
| CAGR (2026 to 2036) | 10.9% |
| Years Considered | 2021 to 2036 |
| Base Year | 2025 |
| Forecast Period | 2026 to 2036 |
| Units Considered | Value (USD million) |
| Leading Sub-Region | London and M4 colocation corridor |
United Kingdom Pluggable Optical Modules Market Outlook
United Kingdom demand is concentrated around London, the M4 corridor, and colocation facilities that host cloud and enterprise traffic. Data infrastructure status gives operators stronger policy visibility during resilience planning.
Procurement often moves through colocation operators, telecom frameworks, and specialist distributors. This creates practical demand for QSFP-DD replacement stock alongside higher-speed modules for AI-ready sites.
Key Growth Drivers
- Colocation density gives replacement optics a broad facility base. The Department for Business and Trade states that the UK hosts over 520 data centres.
- Full-fibre availability strengthens the wider network environment for optical refresh. Ofcom reported in May 2026 that full fibre reached 24.9 million UK residential premises.
- Critical infrastructure status improves policy attention for resilient digital assets. Parliament recorded the data infrastructure designation on September 12, 2024.
- Specialist distributors can support mixed switch estates because enterprise buyers often need compatible modules on short lead times.
Key Restraints
- Grid and planning pressure can delay large campuses. Ofcom reported full-fibre take-up reached 12.4 million connections by January 2026, which keeps traffic growth ahead of some infrastructure planning.
- Import dependence raises lead-time risk for specialized 800G and 1.6T optics used in cloud and carrier upgrades.
- Colocation procurement can fragment demand because operators and tenants often standardize on different switch platforms.
What makes United Kingdom unique
The United Kingdom is unique because colocation and distributor routes carry more weight than in hyperscale-direct markets.
Key Companies
- ProLabs
- Cisco UK
- Coherent
- Smartoptics
- TXO
Sales & Marketing Channels
- Colocation operator procurement
- Telecom carrier framework buying
- Specialist optical distributors
- Cloud migration integrators
- OEM platform sales
Country Segment Breakdown Table
| Segment | Sub-Segments |
|---|---|
| By Form Factor | SFP / SFP+ · QSFP / QSFP-DD · OSFP · CFP / Other |
| By Speed | 100G and Below · 200G / 400G · 800G · 1.6T and Above |
| By Reach | Short Reach · Medium Reach · Long Reach · Coherent / Metro |
| By End Use | Cloud Data Centers · Telecom Networks · Enterprise Networks · AI / HPC Clusters |
| By Sales Channel | Direct OEM · Distributors · White-label / ODM |
| Key Sub-Regions Covered, Data Center and Telecom Corridors | London and M4 colocation corridor |
Frequently Asked Questions
How fast is United Kingdom pluggable optical modules market growing?
The market in United Kingdom is expected to expand at 10.9% from 2026 to 2036, guided by country-specific cloud and telecom demand.
Who leads United Kingdom pluggable optical modules market?
ProLabs, Cisco UK, Coherent, Smartoptics compete through local customer access, optical infrastructure portfolios, or verified regional channel presence.
What is driving adoption in United Kingdom pluggable optical modules market?
Colocation density and critical infrastructure policy are supporting controlled optical module refresh programs.
How is Germany performing in the pluggable optical modules market?
A 10.3% CAGR through 2036 reflects Frankfurt interconnection demand and cautious enterprise network refresh cycles.
Country Market Snapshot Table
| Parameter | Value |
|---|---|
| Market Size in 2025 (Value) | USD 0.6 million |
| Market Size in 2026 (Value) | USD 0.7 million |
| Market Forecast in 2036 (Value) | USD 1.7 million |
| CAGR (2026 to 2036) | 10.3% |
| Years Considered | 2021 to 2036 |
| Base Year | 2025 |
| Forecast Period | 2026 to 2036 |
| Units Considered | Value (USD million) |
| Leading Sub-Region | Frankfurt and Rhine-Ruhr interconnection hubs |
Germany Pluggable Optical Modules Market Outlook
Germany demand is shaped by Frankfurt interconnection density and buyer preference for validated equipment lists. Enterprise and telecom users usually move in controlled upgrade cycles before wider high-speed migration.
Sales channels depend heavily on integrators and OEM-approved distributor routes. Suppliers need compatibility evidence, warranty discipline, and reliable delivery before German buyers expand module standards.
Key Growth Drivers
- Fiber expansion supports more data-rich fixed networks and enterprise upgrades. Bundesnetzagentur reported in June 2026 that active FTTH and FTTB connections rose from 5.3 million to 6.4 million in 2025.
- European digital targets reinforce fiber infrastructure planning. The European Commission states that Germany plans 50% fibre availability for households and companies by the end of 2025.
- Frankfurt interconnection density gives suppliers a concentrated route into cloud and carrier accounts that require tested optical modules.
- OEM-approved distribution supports German buyers that prioritize compatibility and warranty records before switching suppliers.
Key Restraints
- Rural fiber gaps can limit uniform optical demand outside dense hubs. Bundesnetzagentur reported fibre held only 16.5% of total active fixed broadband connections by end-2025.
- Conservative enterprise buying can delay migration from stable 100G and 400G modules into higher-cost 800G formats.
- Compatibility requirements can slow supplier switching because German buyers often rely on OEM-approved module lists.
What makes Germany unique
Germany is unique because buyer decisions combine Frankfurt interconnection demand with conservative validation habits.
Key Companies
- Flexoptix
- Adtran Networks
- VIAVI Solutions Deutschland
- Smartoptics
- Cisco Germany
Sales & Marketing Channels
- System integrator procurement
- Telecom framework contracts
- Specialist optical distributors
- Enterprise network resellers
- OEM-qualified replacement routes
Country Segment Breakdown Table
| Segment | Sub-Segments |
|---|---|
| By Form Factor | SFP / SFP+ · QSFP / QSFP-DD · OSFP · CFP / Other |
| By Speed | 100G and Below · 200G / 400G · 800G · 1.6T and Above |
| By Reach | Short Reach · Medium Reach · Long Reach · Coherent / Metro |
| By End Use | Cloud Data Centers · Telecom Networks · Enterprise Networks · AI / HPC Clusters |
| By Sales Channel | Direct OEM · Distributors · White-label / ODM |
| Key Sub-Regions Covered, Data Center and Telecom Corridors | Frankfurt and Rhine-Ruhr interconnection hubs |
Frequently Asked Questions
How fast is Germany pluggable optical modules market growing?
The market in Germany is expected to expand at 10.3% from 2026 to 2036, guided by country-specific cloud and telecom demand.
Who leads Germany pluggable optical modules market?
Flexoptix, Adtran Networks, VIAVI Solutions Deutschland, Smartoptics compete through local customer access, optical infrastructure portfolios, or verified regional channel presence.
What is driving adoption in Germany pluggable optical modules market?
Frankfurt interconnection demand and fiber deployment are supporting measured upgrades in cloud and carrier networks.
What supports pluggable optical modules market growth in France?
A 10.1% CAGR through 2036 reflects strong fiber coverage and measured cloud interconnect expansion.
Country Market Snapshot Table
| Parameter | Value |
|---|---|
| Market Size in 2025 (Value) | USD 0.5 million |
| Market Size in 2026 (Value) | USD 0.6 million |
| Market Forecast in 2036 (Value) | USD 1.4 million |
| CAGR (2026 to 2036) | 10.1% |
| Years Considered | 2021 to 2036 |
| Base Year | 2025 |
| Forecast Period | 2026 to 2036 |
| Units Considered | Value (USD million) |
| Leading Sub-Region | Paris and Marseille network exchange corridors |
France Pluggable Optical Modules Market Outlook
France demand is supported by fiber availability and active telecom competition around Paris and Marseille. Cloud and carrier buyers use optical modules to improve interconnection between regional facilities.
Procurement is shaped by telecom operator tenders and data center integrators. Suppliers that combine coherent optics knowledge with practical replacement access can build stronger channel positions.
Key Growth Drivers
- Fibre rollout creates a strong base for optical equipment upgrades. ARCEP reported in March 2026 that 42.4 million French households were passed for fibre at the end of 2025.
- Traffic concentration supports metro interconnect demand. ARCEP estimated inbound traffic to major French ISPs at 50.8 Tb/s at the end of 2024.
- Marseille submarine cable concentration supports coherent module demand for carrier interconnection and regional data transfer routes.
- Telecom operator tendering helps suppliers with validated modules reach large accounts through controlled procurement cycles.
Key Restraints
- Remaining fibre gaps can slow nationwide upgrade reach. ARCEP reported in March 2026 that close to 2.6 million premises still remained to be passed for fibre.
- Operator tender cycles can delay supplier entry when qualification documentation or warranty coverage is incomplete.
- Price pressure remains visible in mature module categories because distributors compare compatible 100G and 400G stock closely.
What makes France unique
France is unique because fibre coverage and operator tendering create a structured route for optical module adoption.
Key Companies
- Ekinops
- Orange Business
- Ciena France
- Cisco France
- EXFO France
Sales & Marketing Channels
- Telecom operator tenders
- Data center integrator buying
- Network equipment OEM partners
- Specialist optical distributors
- Enterprise IT resellers
Country Segment Breakdown Table
| Segment | Sub-Segments |
|---|---|
| By Form Factor | SFP / SFP+ · QSFP / QSFP-DD · OSFP · CFP / Other |
| By Speed | 100G and Below · 200G / 400G · 800G · 1.6T and Above |
| By Reach | Short Reach · Medium Reach · Long Reach · Coherent / Metro |
| By End Use | Cloud Data Centers · Telecom Networks · Enterprise Networks · AI / HPC Clusters |
| By Sales Channel | Direct OEM · Distributors · White-label / ODM |
| Key Sub-Regions Covered, Data Center and Telecom Corridors | Paris and Marseille network exchange corridors |
Frequently Asked Questions
How fast is France pluggable optical modules market growing?
The market in France is expected to expand at 10.1% from 2026 to 2036, guided by country-specific cloud and telecom demand.
Who leads France pluggable optical modules market?
Ekinops, Orange Business, Ciena France, Cisco France compete through local customer access, optical infrastructure portfolios, or verified regional channel presence.
What is driving adoption in France pluggable optical modules market?
Fibre coverage and telecom operator tendering are supporting cautious demand for short-reach and coherent modules.
What is shaping pluggable optical modules demand in Japan?
An 11.3% CAGR through 2036 reflects cloud investment, telecom modernization, and domestic optical technology depth.
Country Market Snapshot Table
| Parameter | Value |
|---|---|
| Market Size in 2025 (Value) | USD 1.3 million |
| Market Size in 2026 (Value) | USD 1.5 million |
| Market Forecast in 2036 (Value) | USD 4.4 million |
| CAGR (2026 to 2036) | 11.3% |
| Years Considered | 2021 to 2036 |
| Base Year | 2025 |
| Forecast Period | 2026 to 2036 |
| Units Considered | Value (USD million) |
| Leading Sub-Region | Tokyo and Osaka cloud corridors |
Japan Pluggable Optical Modules Market Outlook
Japan demand reflects cloud investment around Tokyo and Osaka alongside strong domestic photonics capability. Buyers value reliability and long service life because network upgrades often run beside critical infrastructure planning.
Channel conditions are shaped by telecom carriers, electronics distributors, and domestic equipment makers. Local photonics research also reinforces buyer interest in higher-capacity optical systems.
- bAI compute investment supports higher-speed optical links. METI approved subsidies of up to 72.5 billion yen in April 2024 for five cloud program projects.
- Domestic research depth strengthens confidence in high-capacity optics. NICT reported 450 Tb/s transmission over a metropolitan link in June 2026.
- Tokyo and Osaka cloud corridors provide concentrated demand for tested modules used in data center and carrier interconnect.
- Domestic electronics suppliers support qualification discipline because buyers value long product life and stable technical support.
Key Restraints
- Power and land concentration can slow new data center capacity around established metros. JETRO notes regional data center projects need at least 10 hectares for selected subsidy eligibility.
- Long qualification cycles can delay supplier entry because telecom carriers require reliability evidence before network-wide deployment.
- High service expectations can limit white-label adoption when support depth or long-term availability is uncertain.
What makes Japan unique
Japan is unique because domestic photonics expertise supports careful qualification of higher-capacity optical systems.
Key Companies
- Fujitsu Optical Components
- NTT Electronics
- Sumitomo Electric
- Furukawa Electric
- NEC
Sales & Marketing Channels
- Telecom carrier procurement
- Cloud platform qualification
- Electronics distributor networks
- OEM equipment programs
- Data center integrator buying
Country Segment Breakdown Table
| Segment | Sub-Segments |
|---|---|
| By Form Factor | SFP / SFP+ · QSFP / QSFP-DD · OSFP · CFP / Other |
| By Speed | 100G and Below · 200G / 400G · 800G · 1.6T and Above |
| By Reach | Short Reach · Medium Reach · Long Reach · Coherent / Metro |
| By End Use | Cloud Data Centers · Telecom Networks · Enterprise Networks · AI / HPC Clusters |
| By Sales Channel | Direct OEM · Distributors · White-label / ODM |
| Key Sub-Regions Covered, Data Center and Telecom Corridors | Tokyo and Osaka cloud corridors |
Frequently Asked Questions
How fast is Japan pluggable optical modules market growing?
The market in Japan is expected to expand at 11.3% from 2026 to 2036, guided by country-specific cloud and telecom demand.
Who leads Japan pluggable optical modules market?
Fujitsu Optical Components, NTT Electronics, Sumitomo Electric, Furukawa Electric compete through local customer access, optical infrastructure portfolios, or verified regional channel presence.
What is driving adoption in Japan pluggable optical modules market?
Cloud investment and domestic photonics research are shaping buyer interest in reliable high-capacity optical systems.
How does China compare in the pluggable optical modules market?
A 14.2% CAGR through 2036 reflects telecom scale, AI infrastructure spending, and domestic module manufacturing depth.
Country Market Snapshot Table
| Parameter | Value |
|---|---|
| Market Size in 2025 (Value) | USD 3.2 million |
| Market Size in 2026 (Value) | USD 3.6 million |
| Market Forecast in 2036 (Value) | USD 13.6 million |
| CAGR (2026 to 2036) | 14.2% |
| Years Considered | 2021 to 2036 |
| Base Year | 2025 |
| Forecast Period | 2026 to 2036 |
| Units Considered | Value (USD million) |
| Leading Sub-Region | Yangtze River Delta and Greater Bay Area |
China Pluggable Optical Modules Market Outlook
China demand is led by domestic telecom scale and AI infrastructure buildout. Local module makers have strong volume capabilities that support faster portfolio movement across 800G and 1.6T formats.
Sales channels include hyperscale direct supply, telecom tenders, network OEM partnerships, and white-label export routes. Domestic supplier depth makes China more manufacturing-led than most country markets.
Key Growth Drivers
- Telecom infrastructure scale supports module volume. The State Council reported in January 2026 that China had 4.838 million 5G base stations by the end of 2025.
- Higher telecom business volume supports optical transport demand. The same January 2026 update showed telecom business volume increased 9.1% year on year.
- Domestic module makers can shorten portfolio cycles because local hyperscale buyers and telecom operators create large qualification pools.
- White-label export routes add volume stability for suppliers serving both domestic and overseas replacement demand.
Key Restraints
- Utilization discipline may affect inefficient compute expansion. China reported 34.4 5G base stations per 10,000 people by end-2025, which raises scrutiny on infrastructure productivity.
- Price competition can pressure margins because domestic suppliers compete aggressively across mature 100G and 400G modules.
- Export market access can be affected by trade controls and customer qualification concerns around restricted optical components.
What makes China unique
China is unique because domestic scale module suppliers sit close to telecom and cloud procurement centers.
Key Companies
- InnoLight
- Accelink
- Eoptolink
- Hisense Broadband
- Source Photonics
Sales & Marketing Channels
- Direct hyperscale supply
- Telecom operator tenders
- Network OEM partnerships
- White-label export channels
- Domestic distributor networks
Country Segment Breakdown Table
| Segment | Sub-Segments |
|---|---|
| By Form Factor | SFP / SFP+ · QSFP / QSFP-DD · OSFP · CFP / Other |
| By Speed | 100G and Below · 200G / 400G · 800G · 1.6T and Above |
| By Reach | Short Reach · Medium Reach · Long Reach · Coherent / Metro |
| By End Use | Cloud Data Centers · Telecom Networks · Enterprise Networks · AI / HPC Clusters |
| By Sales Channel | Direct OEM · Distributors · White-label / ODM |
| Key Sub-Regions Covered, Data Center and Telecom Corridors | Yangtze River Delta and Greater Bay Area |
Frequently Asked Questions
How fast is China pluggable optical modules market growing?
The market in China is expected to expand at 14.2% from 2026 to 2036, guided by country-specific cloud and telecom demand.
Who leads China pluggable optical modules market?
InnoLight, Accelink, Eoptolink, Hisense Broadband compete through local customer access, optical infrastructure portfolios, or verified regional channel presence.
What is driving adoption in China pluggable optical modules market?
Telecom infrastructure scale and domestic module manufacturing depth are supporting faster high-speed optics adoption.
How is the pluggable optical modules forecast developing in South Korea?
A 13.1% CAGR through 2036 reflects AI computing policy and dense telecom infrastructure programs.
Country Market Snapshot Table
| Parameter | Value |
|---|---|
| Market Size in 2025 (Value) | USD 0.7 million |
| Market Size in 2026 (Value) | USD 0.8 million |
| Market Forecast in 2036 (Value) | USD 2.7 million |
| CAGR (2026 to 2036) | 13.1% |
| Years Considered | 2021 to 2036 |
| Base Year | 2025 |
| Forecast Period | 2026 to 2036 |
| Units Considered | Value (USD million) |
| Leading Sub-Region | Seoul Capital Area and Pangyo cloud corridor |
South Korea Pluggable Optical Modules Market Outlook
South Korea demand is influenced by AI semiconductor policy, telecom operator strength, and cloud infrastructure programs. Buyers view optical links as part of a wider compute stack instead of a separate network accessory.
Procurement is concentrated among telecom carriers, cloud operators, and government-supported R&D consortia. Module sourcing still depends on global suppliers and local electronics channels for many high-speed formats.
Key Growth Drivers
- AI infrastructure funding supports cluster interconnect demand. MSIT launched a six-year K-Cloud project with KRW 403.1 billion total budget in May 2025.
- Government funding lowers early infrastructure risk. MSIT stated the K-Cloud project includes KRW 342.6 billion in government funding.
- Telecom carrier participation creates early routes for high-speed network trials and cloud infrastructure qualification.
- Domestic electronics and semiconductor depth supports buyer attention to low-power optical links across AI computing programs.
Key Restraints
- Domestic module supplier visibility remains limited compared with semiconductor and cloud policy visibility across public sources.
- Funding execution risk can affect timing because the K-Cloud project runs over six years from 2025 to 2030.
- High-speed module sourcing can depend on global supplier allocations when domestic optical module capacity is not sufficient.
What makes South Korea unique
South Korea is unique because AI semiconductor policy and cloud infrastructure programs shape optical module demand together.
Key Companies
- OE Solutions
- Wooriro
- SK Telecom
- NAVER Cloud
- NHN Cloud
Sales & Marketing Channels
- Telecom carrier procurement
- Cloud operator buying teams
- Government-supported R&D consortia
- OEM-qualified sourcing routes
- Specialist electronics distributors
Country Segment Breakdown Table
| Segment | Sub-Segments |
|---|---|
| By Form Factor | SFP / SFP+ · QSFP / QSFP-DD · OSFP · CFP / Other |
| By Speed | 100G and Below · 200G / 400G · 800G · 1.6T and Above |
| By Reach | Short Reach · Medium Reach · Long Reach · Coherent / Metro |
| By End Use | Cloud Data Centers · Telecom Networks · Enterprise Networks · AI / HPC Clusters |
| By Sales Channel | Direct OEM · Distributors · White-label / ODM |
| Key Sub-Regions Covered, Data Center and Telecom Corridors | Seoul Capital Area and Pangyo cloud corridor |
Frequently Asked Questions
How fast is South Korea pluggable optical modules market growing?
The market in South Korea is expected to expand at 13.1% from 2026 to 2036, guided by country-specific cloud and telecom demand.
Who leads South Korea pluggable optical modules market?
OE Solutions, Wooriro, SK Telecom, NAVER Cloud compete through local customer access, optical infrastructure portfolios, or verified regional channel presence.
What is driving adoption in South Korea pluggable optical modules market?
AI computing policy and cloud operator participation are creating demand for efficient cluster interconnects.
What supports pluggable optical modules growth in India?
A 12.7% CAGR through 2036 reflects broadband scale, 5G backhaul demand, and metro data center growth.
Country Market Snapshot Table
| Parameter | Value |
|---|---|
| Market Size in 2025 (Value) | USD 0.4 million |
| Market Size in 2026 (Value) | USD 0.5 million |
| Market Forecast in 2036 (Value) | USD 1.5 million |
| CAGR (2026 to 2036) | 12.7% |
| Years Considered | 2021 to 2036 |
| Base Year | 2025 |
| Forecast Period | 2026 to 2036 |
| Units Considered | Value (USD million) |
| Leading Sub-Region | Mumbai, Chennai, Hyderabad, and NCR cloud corridors |
India Pluggable Optical Modules Market Outlook
India demand is supported by broadband expansion, telecom backhaul, and metro data center investment. Buyers remain price aware but need higher performance modules for 5G and cloud connectivity.
Sales routes are more channel-led than hyperscale-direct markets. Telecom operators and system integrators influence how high-speed optics move into production networks.
Key Growth Drivers
- Broadband scale supports continued fiber and network equipment investment. TRAI reported 1,028.61 million internet subscribers at the end of December 2025.
- Fiber infrastructure gives telecom operators a foundation for optical backhaul refresh. The Department of Telecommunications reported 41.91 lakh route km of optical fiber cable under National Broadband Mission 2.0.
- 5G backhaul demand creates new aggregation requirements across metros and high-traffic districts.
- Metro data center growth increases demand for QSFP-DD and coherent links around Mumbai, Chennai, Hyderabad, and NCR.
Key Restraints
- Price sensitivity slows faster migration to premium modules. TRAI reported wired internet subscribers were only 45.32 million out of 1,028.61 million internet subscribers in December 2025.
- Import dependence creates lead-time and currency risk for high-speed optics used in AI and cloud data center projects.
- Fragmented procurement can slow qualification because telecom operators, OEMs, and integrators use different approved supplier lists.
What makes India unique
India is unique because telecom scale and price discipline make cost-per-port central to supplier success.
Key Companies
- Tejas Networks
- HFCL
- Sterlite Technologies
- Cisco India
- Ciena India
Sales & Marketing Channels
- Telecom operator procurement
- Data center integrators
- Network equipment OEM partners
- Specialist component distributors
- Large enterprise IT resellers
Country Segment Breakdown Table
| Segment | Sub-Segments |
|---|---|
| By Form Factor | SFP / SFP+ · QSFP / QSFP-DD · OSFP · CFP / Other |
| By Speed | 100G and Below · 200G / 400G · 800G · 1.6T and Above |
| By Reach | Short Reach · Medium Reach · Long Reach · Coherent / Metro |
| By End Use | Cloud Data Centers · Telecom Networks · Enterprise Networks · AI / HPC Clusters |
| By Sales Channel | Direct OEM · Distributors · White-label / ODM |
| Key Sub-Regions Covered, Data Center and Telecom Corridors | Mumbai, Chennai, Hyderabad, and NCR cloud corridors |
Frequently Asked Questions
How fast is India pluggable optical modules market growing?
The market in India is expected to expand at 12.7% from 2026 to 2036, guided by country-specific cloud and telecom demand.
Who leads India pluggable optical modules market?
Tejas Networks, HFCL, Sterlite Technologies, Cisco India compete through local customer access, optical infrastructure portfolios, or verified regional channel presence.
What is driving adoption in India pluggable optical modules market?
Broadband scale, 5G backhaul, and metro data centers are supporting wider optical module procurement.
Who are the leading companies in the pluggable optical modules market?
Coherent, Lumentum, Cisco Acacia, Broadcom, InnoLight, Accelink, Eoptolink, Source Photonics, Hisense Broadband, and Fujitsu Optical Components.
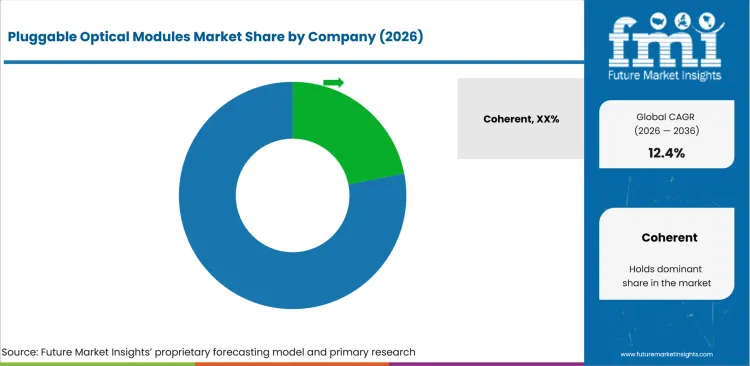
- Integrated photonics suppliers hold an advantage due to laser access, coherent technology, and field qualification experience.
- Scale module manufacturers compete by volume availability, short portfolio cycles, and broader QSFP-DD and OSFP coverage.
- DSP and component suppliers influence module acceptance because power control and signal integrity affect large deployments.
- Distributors and white-label suppliers remain relevant for mature modules that need fast replacement access and warranty support.
Players involved with data centers in this market compete for suppliers that can prove power efficiency, thermal reliability, and enough high-speed allocation before AI cluster rollouts. Coherent, Cisco Acacia and Broadcom are focusing on coherent DSPs and lower-power electrical-to-optical conversion.
Manufacturing breadth has become a second competitive line because hyperscale buyers need module availability across several form factors. Suppliers with stronger 800G production evidence and credible 1.6T roadmaps are better positioned for strategic sockets. Smaller suppliers can still win mature 100G and 400G demand by offering compatibility, warranties, and fast delivery. This keeps replacement demand active across fiber optics networks and enterprise switch estates.
High-density optical links also affect power and cooling decisions inside facilities using data center liquid cooling systems for higher rack loads. Colocation operators evaluate module availability beside tenant growth in data centre colocation facilities that host cloud and enterprise interconnects.
How do top pluggable optical modules companies compare?
Coherent and Cisco Acacia score strongest on coherent capability while InnoLight and Accelink show notable module manufacturing breadth.
| Company | 800G Portfolio Depth | 1.6T Roadmap Readiness | Account Access | Footprint / Service Reach |
|---|---|---|---|---|
| Coherent | High | High | Cloud and telecom | Global |
| Lumentum | High | High | AI infrastructure suppliers | Global |
| Cisco Acacia | High | Strong | Router and carrier accounts | Global |
| Broadcom | Medium | High | DSP and PHY ecosystem | Global |
| InnoLight | High | Strong | Cloud and hyperscale | China and global |
| Accelink | High | Strong | Telecom and cloud OEMs | China and global |
| Eoptolink | High | Strong | Cloud and data center buyers | China and global |
| Source Photonics | Medium | Strong | Telecom and data center buyers | Asia and North America |
| Hisense Broadband | Medium | Medium | Telecom and broadband accounts | China and global |
| Fujitsu Optical Components | Medium | Medium | Japan and equipment makers | Japan and global |
Source: Future Market Insights competitive analysis, 2026.
Who are the key players in the pluggable optical modules market?
Coherent, Lumentum, Cisco Acacia, Broadcom, InnoLight, Accelink, Eoptolink, Source Photonics, Hisense Broadband, and Fujitsu Optical Components are listed among relevant suppliers.
Key global companies leading the pluggable optical modules market include:
- Coherent
- Lumentum
- Cisco Acacia
- Broadcom
- InnoLight
- Accelink
- Eoptolink
- Source Photonics
- Hisense Broadband
- Fujitsu Optical Components
Key Developments in Pluggable Optical Modules Market
- In March 2025, Broadcom expanded its 200G-per-lane DSP PHY portfolio with Sian3 and Sian2M for 800G and 1.6T optical transceiver designs.
- In March 2026, Lumentum demonstrated a 1.6T DR4 OSFP pluggable transceiver prototype using 400G differential EML technology for AI infrastructure.
- In March 2026, Eoptolink demonstrated a next-generation IMDD 400G per-lambda 1.6T DR4 OSFP transceiver at OFC 2026. The company positioned the product for AI cluster interconnects moving from 800G toward 1.6T and 3.2T.
Key Players in the Pluggable Optical Modules Market
Integrated Photonics Leaders
- Coherent
- Lumentum
- Cisco Acacia
- Fujitsu Optical Components
Scale Module Manufacturers
- InnoLight
- Accelink
- Eoptolink
- Source Photonics
- Hisense Broadband
Component and DSP Enablers
- Broadcom
- Marvell Technology
- MaxLinear
- Semtech
Regional and Channel Specialists
- Flexoptix
- ProLabs
- OE Solutions
- Tejas Networks
- Ekinops
Pluggable Optical Modules Market - Report Scope
| Parameter | Details |
|---|---|
| Forecast period | 2026 to 2036 |
| Historical period | 2021 to 2025 |
| Quantitative unit | Revenue in USD million |
| By form factor | SFP / SFP+, QSFP / QSFP-DD, OSFP, CFP / Other |
| By speed | 100G and Below, 200G / 400G, 800G, 1.6T and Above |
| By reach | Short Reach, Medium Reach, Long Reach, Coherent / Metro |
| By end use | Cloud Data Centers, Telecom Networks, Enterprise Networks, AI / HPC Clusters |
| By sales channel | Direct OEM, Distributors, White-label / ODM |
| Regions covered | North America, Latin America, Europe, East Asia, South Asia and Pacific, Middle East and Africa |
| Countries covered | United States, United Kingdom, Germany, France, Japan, China, South Korea, India |
| Key companies profiled | Coherent, Lumentum, Cisco Acacia, Broadcom, InnoLight, Accelink, Eoptolink, Source Photonics |
| Approach | Bottom-up module demand model using speed migration, form factor mix, end-use adoption, and country-level infrastructure readiness |
Source: Future Market Insights, 2026.
Pluggable Optical Modules Market - Scope & Definition
| Attribute | Detail |
|---|---|
| Market Definition | Removable optical transceivers that convert electrical signals into optical signals for fiber-based data movement across data centers, telecom networks, enterprise networks, and AI / HPC clusters |
| Functions Covered | Electrical-to-optical conversion, optical-to-electrical conversion, short-reach interconnect, coherent metro transport, switch-port connectivity, and network equipment compatibility |
| Applications Covered | Data center interconnect, AI cluster links, telecom transport, enterprise network refresh, metro DCI, and high-speed switch connectivity |
| End-Use Industries | Cloud services, telecommunications, enterprise IT, high-performance computing, internet exchanges, and data center colocation |
| Grades Covered | SFP / SFP+, QSFP / QSFP-DD, OSFP, CFP / Other, 100G and below, 200G / 400G, 800G, 1.6T and above |
| Inclusions | Commercially traded pluggable optical transceivers across form factor, speed, reach, end use, sales channel, and country demand contexts |
| Exclusions | Fiber optic cable, direct attach copper cable, active optical cable sold as a cable assembly, optical line systems, embedded optics, co-packaged optics, routers, switches, and general photonic components |
Pluggable Optical Modules Market - Research Methodology
| Method | Description |
|---|---|
| Primary Research | FMI analyst interviews with hyperscale infrastructure planners, telecom network buyers, optical module distributors, and component suppliers across key markets |
| Desk Research | Review of government digital infrastructure data, regulator reports, standards activity, company product disclosures, and official press releases related to optical connectivity |
| Market Sizing & Forecasting | Bottom-up demand model using module volumes, average selling prices, form factor mix, speed migration, end-use adoption, and country readiness |
| Data Validation | Cross-verification using data center expansion, telecom fiber indicators, company launch timing, port-speed roadmaps, and adjacent infrastructure demand |
Pluggable Optical Modules Market Breakdown by Form Factor, Speed, Reach, End Use, Sales Channel, and Region
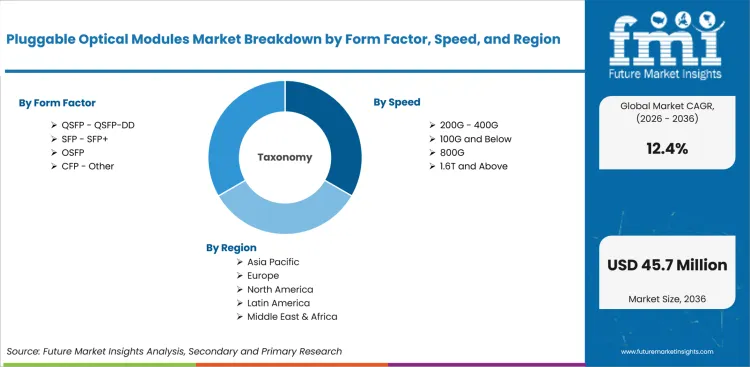
Pluggable Optical Modules Market Segmented by Form Factor
- SFP / SFP+
- QSFP / QSFP-DD
- OSFP
- CFP / Other
Pluggable Optical Modules Market Segmented by Speed
- 100G and Below
- 200G / 400G
- 800G
- 1.6T and Above
Pluggable Optical Modules Market Segmented by Reach
- Short Reach
- Medium Reach
- Long Reach
- Coherent / Metro
Pluggable Optical Modules Market Segmented by End Use
- Cloud Data Centers
- Telecom Networks
- Enterprise Networks
- AI / HPC Clusters
Pluggable Optical Modules Market Segmented by Sales Channel
- Direct OEM
- Distributors
- White-label / ODM
Pluggable Optical Modules Market by Region
- North America
- Latin America
- Europe
- East Asia
- South Asia and Pacific
- Middle East and Africa
Research Sources and Bibliography
- ARCEP. (2025, July 4). Key figures on the state of the internet in France. Autorite de regulation des communications electroniques.
- ARCEP. (2026, March 12). Fixed broadband and superfast broadband market. Autorite de regulation des communications electroniques.
- Broadcom Inc. (2025, March 25). Broadcom extends 200G/lane DSP PHY leadership for next-generation AI infrastructure.
- Bundesnetzagentur. (2026, June 5). Telecoms annual report 2025. Federal Network Agency.
- Cisco Acacia. (2024, March 21). Acacia introduces 800G ZR+ and 800ZR with interoperable PCS in OSFP and QSFP-DD.
- Coherent Corp. (2024, March 21). 800Gbps QSFP form factor transceiver module.
- Department for Business and Trade. (2026). AI and data centres. Government of the United Kingdom.
- Department of Telecommunications. (2025, January 8). National Broadband Mission 2.0 2025-30. Government of India.
- European Commission. (2025). Digital connectivity in Germany. Shaping Europe's Digital Future.
- Lumentum Holdings Inc. (2026, March 17). Lumentum demonstrates technologies and products for AI infrastructure at OFC 2026.
- Lumentum Holdings Inc. (2026, March 26). Lumentum announces new USA manufacturing facility to produce advanced lasers for AI data centers.
- Ministry of Economy, Trade and Industry. (2024, April 19). Approval of plans for ensuring a stable supply of cloud programs under the Economic Security Promotion Act.
- Ministry of Science and ICT. (2025, May 19). MSIT launches KRW 400 billion K-Cloud R&D project based on domestic AI semiconductors.
- National Institute of Information and Communications Technology. (2026, June 1). World record: 450 Tb/s transmission over a metropolitan link using legacy optical fiber.
- NTIA. (2025). Broadband Equity, Access, and Deployment Program. National Telecommunications and Information Administration.
- Ofcom. (2025, November 19). Connected Nations UK report 2025. Office of Communications.
- Ofcom. (2026, May 13). Connected Nations update: Spring 2026. Office of Communications.
- Press Information Bureau. (2026, March 3). Indian telecom services performance indicator report for October to December 2025. Government of India.
- State Council of the People's Republic of China. (2026, January 28). China's 5G base stations top 4.83 million by end of 2025.
- Telecom Regulatory Authority of India. (2026, March 3). The Indian telecom services performance indicators for quarter ending December 2025.
- USA Census Bureau. (2026, June 1). Monthly construction spending, April 2026.
- USA Department of Energy. (2024, December 20). DOE releases new report evaluating increase in electricity demand from data centers.
- Eoptolink Technology Inc., Ltd. March 12, 2026. Eoptolink Demos IMDD 400G per Lambda Based 1.6T DR4 Optical Transceiver Solution at OFC 2026. Eoptolink.
- USA Department of Energy and Lawrence Berkeley National Laboratory. (2024, December). 2024 United States data center energy usage report.
This bibliography is provided for reader reference and includes primary government, regulatory, and official company publications used in this analysis.
This Report Answers
- The report explains how the pluggable optical modules market is expected to grow between 2026 and 2036 across major infrastructure segments.
- The report identifies which form factor, speed, reach, end-use, and sales channel categories are projected to lead demand in 2026.
- The report evaluates why AI clusters and cloud data centers are changing buyer expectations for 800G and 1.6T modules.
- The report compares country growth profiles across China, South Korea, United States, India, Japan, United Kingdom, Germany, and France.
- The report reviews supplier positioning across integrated photonics, module manufacturing, DSP enablement, and regional channel access.
- The report clarifies what products are included and excluded from the pluggable optical modules market definition.
Frequently Asked Questions
Which form factor is projected to lead the market in 2026?
QSFP / QSFP-DD is projected to account for 46.0% share in 2026 due to wide switch compatibility.
Which end-use segment is expected to lead in 2026?
Cloud Data Centers are projected to account for 48.0% share in 2026 as hyperscale buyers shape qualification rules.
Which country is expected to grow fastest in this market?
China is forecast to record 14.2% CAGR through 2036 due to telecom scale and domestic supplier depth.
What does the Pluggable Optical Modules Market include?
The market includes removable optical transceivers used for fiber-based data movement in cloud, telecom, enterprise, and AI networks.
How does Future Market Insights forecast this market?
FMI combines module volumes, pricing, form factor mix, country readiness, and end-use adoption to forecast demand.
Which pluggable optical module is best for AI data centers?
OSFP and QSFP-DD 800G modules are commonly evaluated, with selection shaped by switch compatibility and rack thermal headroom.
What is the difference between QSFP-DD and OSFP optical modules?
QSFP-DD supports broad installed compatibility, while OSFP offers stronger thermal headroom for dense 800G and 1.6T AI fabrics.
How do pluggable optical modules work?
A module converts electrical switch signals into optical signals for fiber transmission, then converts received light back into electrical signals.
What are the disadvantages of high-speed pluggable optical modules?
High-speed modules can raise heat, power use, and qualification cost, requiring careful validation before large network rollouts.
Preview the report firsthand - request a free sample
Get SampleGet the brochure for pricing and purchase details.
Get PDFTable of Content
- Key Takeaways
- Market Size and CAGR
- Top Growth Driver
- Fastest Growing Segment
- Leading Region
- Key Companies
- Emerging Opportunities
- Executive Summary
- Global Market Outlook
- Demand-side Trends
- Supply-side Trends
- Technology Roadmap Analysis
- Analysis and Recommendations
- Analyst Perspective (What is happening? Why now? What should investors know?)
- Key Questions Answered
- How large is the market?
- What is the CAGR?
- What are key trends?
- Which region dominates?
- Who are the leaders?
- Market Overview
- Market Coverage / Taxonomy
- Market Definition / Scope / Limitations
- Research Methodology
- Chapter Orientation
- Analytical Lens and Working Hypotheses
- Market Structure, Signals, and Trend Drivers
- Benchmarking and Cross-market Comparability
- Market Sizing, Forecasting, and Opportunity Mapping
- Research Design and Evidence Framework
- Desk Research Programme (Secondary Evidence)
- Expert Input and Fieldwork (Primary Evidence)
- Tooling, Models, and Reference Databases
- Data Engineering and Model Build
- Quality Assurance and Audit Trail
- Market Background
- Market Dynamics (Drivers, Restraints, Opportunity, Trends)
- Scenario Forecast (Optimistic, Likely, Conservative)
- Impact Analysis
- AI Impact
- Sustainability Impact
- Regulatory Impact
- Technology Impact
- Consumer / Buyer Analysis
- Purchase Drivers
- Adoption Barriers
- Buyer Journey
- Opportunity Map Analysis
- Product Life Cycle Analysis
- Supply Chain Analysis
- Investment Feasibility Matrix
- Value Chain Analysis
- PESTLE and Porter's Analysis
- Regulatory Landscape
- Regional Parent Market Outlook
- Production and Consumption Statistics
- Import and Export Statistics
- Global Market Analysis and Forecast, 2021 to 2036
- Historical Market Size Value (USD Million) & Volume (Unit) Analysis, 2021 to 2025
- Current and Future Market Size Value (USD Million) & Volume (Unit) Projections, 2026 to 2036
- Y-o-Y Growth Trend Analysis
- Absolute $ Opportunity Analysis
- Global Market Pricing Analysis, 2021 to 2036
- Global Market Analysis and Forecast, By Form Factor, 2021 to 2036
- Introduction / Key Findings
- Historical Market Size Value (USD Million) & Volume (Unit) Analysis By Form Factor, 2021 to 2025
- Current and Future Market Size Value (USD Million) & Volume (Unit) Analysis and Forecast By Form Factor, 2026 to 2036
- QSFP - QSFP-DD
- SFP - SFP+
- OSFP
- CFP - Other
- QSFP - QSFP-DD
- Y-o-Y Growth Trend Analysis By Form Factor, 2021 to 2025
- Absolute $ Opportunity Analysis By Form Factor, 2026 to 2036
- Global Market Analysis and Forecast, By Speed, 2021 to 2036
- Introduction / Key Findings
- Historical Market Size Value (USD Million) & Volume (Unit) Analysis By Speed, 2021 to 2025
- Current and Future Market Size Value (USD Million) & Volume (Unit) Analysis and Forecast By Speed, 2026 to 2036
- 200G - 400G
- 100G and Below
- 800G
- 1.6T and Above
- 200G - 400G
- Y-o-Y Growth Trend Analysis By Speed, 2021 to 2025
- Absolute $ Opportunity Analysis By Speed, 2026 to 2036
- Global Market Analysis and Forecast, By Reach, 2021 to 2036
- Introduction / Key Findings
- Historical Market Size Value (USD Million) & Volume (Unit) Analysis By Reach, 2021 to 2025
- Current and Future Market Size Value (USD Million) & Volume (Unit) Analysis and Forecast By Reach, 2026 to 2036
- Short Reach
- Medium Reach
- Long Reach
- Coherent - Metro
- Short Reach
- Y-o-Y Growth Trend Analysis By Reach, 2021 to 2025
- Absolute $ Opportunity Analysis By Reach, 2026 to 2036
- Global Market Analysis and Forecast, By End Use, 2021 to 2036
- Introduction / Key Findings
- Historical Market Size Value (USD Million) & Volume (Unit) Analysis By End Use, 2021 to 2025
- Current and Future Market Size Value (USD Million) & Volume (Unit) Analysis and Forecast By End Use, 2026 to 2036
- Cloud Data Centers
- Telecom Networks
- Enterprise Networks
- AI - HPC Clusters
- Cloud Data Centers
- Y-o-Y Growth Trend Analysis By End Use, 2021 to 2025
- Absolute $ Opportunity Analysis By End Use, 2026 to 2036
- Global Market Analysis and Forecast, By Sales Channel, 2021 to 2036
- Introduction / Key Findings
- Historical Market Size Value (USD Million) & Volume (Unit) Analysis By Sales Channel, 2021 to 2025
- Current and Future Market Size Value (USD Million) & Volume (Unit) Analysis and Forecast By Sales Channel, 2026 to 2036
- Direct OEM
- Distributors
- White-label - ODM
- Direct OEM
- Y-o-Y Growth Trend Analysis By Sales Channel, 2021 to 2025
- Absolute $ Opportunity Analysis By Sales Channel, 2026 to 2036
- Global Market Analysis and Forecast, By Region, 2021 to 2036
- Introduction
- Historical Market Size Value (USD Million) & Volume (Unit) Analysis By Region, 2021 to 2025
- Current Market Size Value (USD Million) & Volume (Unit) Analysis and Forecast By Region, 2026 to 2036
- North America
- Latin America
- Western Europe
- Eastern Europe
- East Asia
- South Asia and Pacific
- Middle East & Africa
- Market Attractiveness Analysis By Region
- North America Market Analysis and Forecast, By Country, 2021 to 2036
- Historical Market Size Value (USD Million) & Volume (Unit) Trend Analysis By Market Taxonomy, 2021 to 2025
- Market Size Value (USD Million) & Volume (Unit) Forecast By Market Taxonomy, 2026 to 2036
- By Country
- USA
- Canada
- Mexico
- By Form Factor
- By Speed
- By Reach
- By End Use
- By Sales Channel
- By Country
- Market Attractiveness Analysis
- By Country
- By Form Factor
- By Speed
- By Reach
- By End Use
- By Sales Channel
- Key Takeaways
- Latin America Market Analysis and Forecast, By Country
- Historical Market Size Value (USD Million) & Volume (Unit) Trend Analysis By Market Taxonomy, 2021 to 2025
- Market Size Value (USD Million) & Volume (Unit) Forecast By Market Taxonomy, 2026 to 2036
- By Country
- Brazil
- Chile
- Rest of Latin America
- By Form Factor
- By Speed
- By Reach
- By End Use
- By Sales Channel
- By Country
- Market Attractiveness Analysis
- By Country
- By Form Factor
- By Speed
- By Reach
- By End Use
- By Sales Channel
- Key Takeaways
- Western Europe Market Analysis and Forecast, By Country
- Historical Market Size Value (USD Million) & Volume (Unit) Trend Analysis By Market Taxonomy, 2021 to 2025
- Market Size Value (USD Million) & Volume (Unit) Forecast By Market Taxonomy, 2026 to 2036
- By Country
- Germany
- UK
- Italy
- Spain
- France
- Nordic
- BENELUX
- Rest of Western Europe
- By Form Factor
- By Speed
- By Reach
- By End Use
- By Sales Channel
- By Country
- Market Attractiveness Analysis
- By Country
- By Form Factor
- By Speed
- By Reach
- By End Use
- By Sales Channel
- Key Takeaways
- Eastern Europe Market Analysis and Forecast, By Country
- Historical Market Size Value (USD Million) & Volume (Unit) Trend Analysis By Market Taxonomy, 2021 to 2025
- Market Size Value (USD Million) & Volume (Unit) Forecast By Market Taxonomy, 2026 to 2036
- By Country
- Russia
- Poland
- Hungary
- Balkan & Baltic
- Rest of Eastern Europe
- By Form Factor
- By Speed
- By Reach
- By End Use
- By Sales Channel
- By Country
- Market Attractiveness Analysis
- By Country
- By Form Factor
- By Speed
- By Reach
- By End Use
- By Sales Channel
- Key Takeaways
- East Asia Market Analysis and Forecast, By Country
- Historical Market Size Value (USD Million) & Volume (Unit) Trend Analysis By Market Taxonomy, 2021 to 2025
- Market Size Value (USD Million) & Volume (Unit) Forecast By Market Taxonomy, 2026 to 2036
- By Country
- China
- Japan
- South Korea
- By Form Factor
- By Speed
- By Reach
- By End Use
- By Sales Channel
- By Country
- Market Attractiveness Analysis
- By Country
- By Form Factor
- By Speed
- By Reach
- By End Use
- By Sales Channel
- Key Takeaways
- South Asia and Pacific Market Analysis and Forecast, By Country
- Historical Market Size Value (USD Million) & Volume (Unit) Trend Analysis By Market Taxonomy, 2021 to 2025
- Market Size Value (USD Million) & Volume (Unit) Forecast By Market Taxonomy, 2026 to 2036
- By Country
- India
- ASEAN
- Australia & New Zealand
- Rest of South Asia and Pacific
- By Form Factor
- By Speed
- By Reach
- By End Use
- By Sales Channel
- By Country
- Market Attractiveness Analysis
- By Country
- By Form Factor
- By Speed
- By Reach
- By End Use
- By Sales Channel
- Key Takeaways
- Middle East & Africa Market Analysis and Forecast, By Country
- Historical Market Size Value (USD Million) & Volume (Unit) Trend Analysis By Market Taxonomy, 2021 to 2025
- Market Size Value (USD Million) & Volume (Unit) Forecast By Market Taxonomy, 2026 to 2036
- By Country
- Kingdom of Saudi Arabia
- Other GCC Countries
- Türkiye
- South Africa
- Other African Union
- Rest of Middle East & Africa
- By Form Factor
- By Speed
- By Reach
- By End Use
- By Sales Channel
- By Country
- Market Attractiveness Analysis
- By Country
- By Form Factor
- By Speed
- By Reach
- By End Use
- By Sales Channel
- Key Takeaways
- Key Countries Market Analysis
- USA
- Pricing Analysis
- Market Share Analysis, 2025
- By Form Factor
- By Speed
- By Reach
- By End Use
- By Sales Channel
- Canada
- Pricing Analysis
- Market Share Analysis, 2025
- By Form Factor
- By Speed
- By Reach
- By End Use
- By Sales Channel
- Mexico
- Pricing Analysis
- Market Share Analysis, 2025
- By Form Factor
- By Speed
- By Reach
- By End Use
- By Sales Channel
- Brazil
- Pricing Analysis
- Market Share Analysis, 2025
- By Form Factor
- By Speed
- By Reach
- By End Use
- By Sales Channel
- Chile
- Pricing Analysis
- Market Share Analysis, 2025
- By Form Factor
- By Speed
- By Reach
- By End Use
- By Sales Channel
- Germany
- Pricing Analysis
- Market Share Analysis, 2025
- By Form Factor
- By Speed
- By Reach
- By End Use
- By Sales Channel
- UK
- Pricing Analysis
- Market Share Analysis, 2025
- By Form Factor
- By Speed
- By Reach
- By End Use
- By Sales Channel
- Italy
- Pricing Analysis
- Market Share Analysis, 2025
- By Form Factor
- By Speed
- By Reach
- By End Use
- By Sales Channel
- Spain
- Pricing Analysis
- Market Share Analysis, 2025
- By Form Factor
- By Speed
- By Reach
- By End Use
- By Sales Channel
- France
- Pricing Analysis
- Market Share Analysis, 2025
- By Form Factor
- By Speed
- By Reach
- By End Use
- By Sales Channel
- India
- Pricing Analysis
- Market Share Analysis, 2025
- By Form Factor
- By Speed
- By Reach
- By End Use
- By Sales Channel
- ASEAN
- Pricing Analysis
- Market Share Analysis, 2025
- By Form Factor
- By Speed
- By Reach
- By End Use
- By Sales Channel
- Australia & New Zealand
- Pricing Analysis
- Market Share Analysis, 2025
- By Form Factor
- By Speed
- By Reach
- By End Use
- By Sales Channel
- China
- Pricing Analysis
- Market Share Analysis, 2025
- By Form Factor
- By Speed
- By Reach
- By End Use
- By Sales Channel
- Japan
- Pricing Analysis
- Market Share Analysis, 2025
- By Form Factor
- By Speed
- By Reach
- By End Use
- By Sales Channel
- South Korea
- Pricing Analysis
- Market Share Analysis, 2025
- By Form Factor
- By Speed
- By Reach
- By End Use
- By Sales Channel
- Russia
- Pricing Analysis
- Market Share Analysis, 2025
- By Form Factor
- By Speed
- By Reach
- By End Use
- By Sales Channel
- Poland
- Pricing Analysis
- Market Share Analysis, 2025
- By Form Factor
- By Speed
- By Reach
- By End Use
- By Sales Channel
- Hungary
- Pricing Analysis
- Market Share Analysis, 2025
- By Form Factor
- By Speed
- By Reach
- By End Use
- By Sales Channel
- Kingdom of Saudi Arabia
- Pricing Analysis
- Market Share Analysis, 2025
- By Form Factor
- By Speed
- By Reach
- By End Use
- By Sales Channel
- Türkiye
- Pricing Analysis
- Market Share Analysis, 2025
- By Form Factor
- By Speed
- By Reach
- By End Use
- By Sales Channel
- South Africa
- Pricing Analysis
- Market Share Analysis, 2025
- By Form Factor
- By Speed
- By Reach
- By End Use
- By Sales Channel
- USA
- Market Structure Analysis
- Competition Dashboard
- Competition Benchmarking
- Market Share Analysis of Top Players
- By Regional
- By Form Factor
- By Speed
- By Reach
- By End Use
- By Sales Channel
- Emerging Startups
- Innovation Benchmarking
- Competition Analysis
- Competition Deep Dive
- Coherent
- Overview
- Product Portfolio
- Profitability by Market Segments (Product/Region/Sales Channel)
- Sales Footprint
- Strategy Overview
- Marketing Strategy
- Product Strategy
- Channel Strategy
- Lumentum
- Cisco Acacia
- Broadcom
- InnoLight
- Accelink
- Eoptolink
- Source Photonics
- Coherent
- Case Studies
- Success Stories
- Recent Developments
- Competition Deep Dive
- Assumptions & Acronyms Used


