Polymer Mixing Unit Market Forecast and Outlook (2025-2035)
The global polymer mixing unit market is projected to grow from USD 525.2 million in 2025 to approximately USD 659.3 million by 2035, recording an absolute increase of USD 134.1 million over the forecast period. Key drivers for the polymer mixing unit market are closely linked to the expanding global emphasis on efficient water and wastewater treatment operations. Increasing municipal infrastructure development and rehabilitation projects are elevating the need for precise polymer preparation systems that enhance flocculation, sludge dewatering, and contaminant separation efficiency within treatment plants.
Stricter regulatory mandates on effluent discharge quality are encouraging utilities and industrial operators to adopt advanced polymer dosing and mixing technologies that provide repeatable performance and reduce chemical waste. In industrial settings, growth in sectors such as power generation, food processing, petrochemicals, and pulp and paper continues to support the integration of polymer mixing units to improve process water management and reduce overall sludge handling costs. Another key driver is the shift toward automation and digital monitoring within chemical feed systems, enabling real-time dosage adjustment and lowering operator intervention. Automated polymer mixing units support lower downtime, reduced polymer overdosing, and better overall lifecycle cost control. Additionally, the growing emphasis on energy efficiency and sustainability within treatment operations is reinforcing the preference for systems designed to optimize polymer hydration and minimize operating expenses.
Quick Stats for Polymer Mixing Unit Market
- Polymer Mixing Unit Market Value (2025): USD 525.2 million
- Polymer Mixing Unit Market Forecast Value (2035): USD 659.3 million
- Polymer Mixing Unit Market CAGR: 2.3%
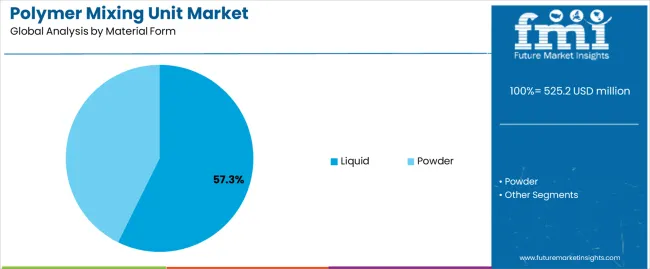
- Leading Segment by Material Form (2025): Liquid (57.3%)
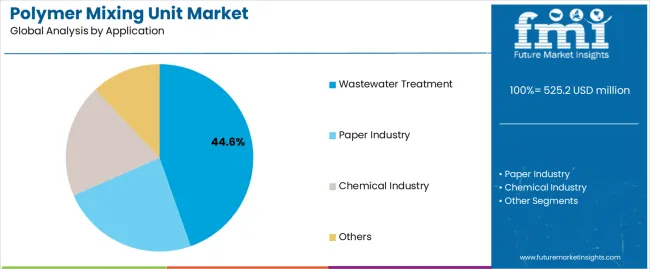
- Leading Segment by Application (2025): Wastewater Treatment (44.6%)
- Key Growth Regions: Asia Pacific, North America, and Europe
- Top Companies by Market Share: ProMinent (Tomal), Polymore AB, MSE Hiller
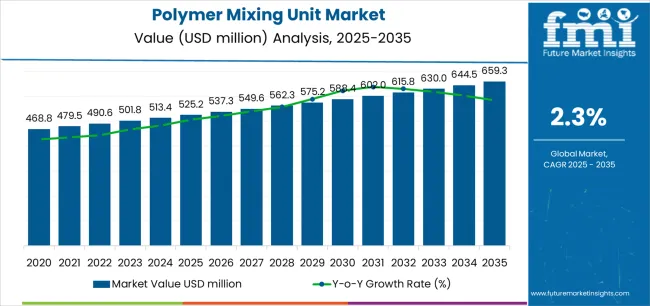
The expansion is further reinforced by aging water treatment infrastructure in developed economies requiring equipment replacement and modernization, rapid urbanization in emerging markets driving new treatment plant construction, and growing emphasis on water reuse and resource recovery necessitating sophisticated chemical conditioning systems. Water utilities, industrial process operators, and environmental service providers are increasingly recognizing polymer mixing units as essential components of treatment systems, enabling accurate preparation and delivery of polyelectrolyte solutions for flocculation, coagulation, and dewatering applications across municipal wastewater treatment, industrial effluent management, and potable water production facilities.
The polymer mixing unit market benefits from continuous technological advances including automated dilution control systems, real-time monitoring capabilities, and energy-efficient mixing mechanisms that optimize polymer utilization while minimizing waste and reducing chemical consumption costs. Rising awareness of water scarcity issues, increasing regulatory pressure on discharge quality parameters, and growing industrial emphasis on sustainable water management practices are compelling operators to invest in precision polymer preparation equipment that delivers consistent chemical performance while supporting operational efficiency objectives and environmental compliance requirements across diverse treatment applications and facility scales.
Polymer Mixing Unit Market Key Takeaways
| Metric |
Value |
| Market Value (2025) |
USD 525.2 million |
| Market Forecast Value (2035) |
USD 659.3 million |
| Forecast CAGR (2025-2035) |
2.3% |
Why is the Polymer Mixing Unit Market Growing?
| INFRASTRUCTURE & REGULATORY DRIVERS |
OPERATIONAL EFFICIENCY DEMANDS |
TECHNOLOGY & SUSTAINABILITY TRENDS |
- Water Infrastructure Investment:Substantial global investments in water and wastewater treatment infrastructure driven by urbanization, population growth, and aging facility replacement requirements creating sustained demand for polymer preparation equipment across municipal and industrial installations.
- Regulatory Compliance Pressure:Increasingly stringent discharge regulations and drinking water quality standards mandating advanced treatment processes requiring precise polymer dosing systems ensuring consistent compliance with environmental and health protection requirements.
- Emerging Market Urbanization:Rapid urban population growth in developing regions necessitating new wastewater treatment capacity with polymer mixing units essential for effective solids separation and treatment optimization in resource-constrained environments.
|
- Chemical Cost Optimization:Growing operational emphasis on reducing chemical consumption costs through precise polymer preparation and dosing systems maximizing treatment effectiveness while minimizing waste from over-application or improper mixing.
- Process Automation Adoption:Increasing implementation of automated treatment systems requiring integrated polymer preparation units with real-time monitoring and control capabilities reducing manual labor requirements and improving process consistency.
- Treatment Efficiency Enhancement:Continuous pressure to improve treatment performance and capacity utilization driving adoption of optimized polymer mixing systems ensuring maximum chemical effectiveness and consistent process results.
|
- Advanced Control Integration:Development of smart polymer mixing units with automated dilution control, flow-paced dosing, and remote monitoring capabilities enabling precision chemical management and data-driven optimization strategies.
- Energy Efficiency Focus:Growing emphasis on reducing energy consumption in treatment operations driving adoption of efficient mixing technologies and optimized preparation systems minimizing power requirements while maintaining performance.
- Sustainable Water Management:Increasing industrial focus on water reuse, zero liquid discharge, and circular economy principles requiring sophisticated chemical conditioning systems supporting advanced treatment and resource recovery applications.
- Equipment Modernization:Replacement cycles for aging polymer preparation equipment in established facilities creating opportunities for upgraded systems with enhanced capabilities, improved reliability, and reduced maintenance requirements.
|
Which key segments define the structure of the polymer mixing unit market and how are they performing?
| Category |
Segments Covered |
| By Material Form |
Liquid, Powder |
| By Application |
Wastewater Treatment, Paper Industry, Chemical Industry, Others |
| By Region |
North America, Europe, Asia Pacific, Latin America, Middle East & Africa |
Polymer Mixing Unit Market Analysis by Material Form
| Segment |
2025 to 2035 Outlook |
| Liquid |
- Leader in 2025 with 57.3% market share, maintaining dominance through 2035. Liquid polymer systems offering operational simplicity with ready-to-use emulsion polymers requiring minimal preparation beyond dilution, reducing equipment complexity and operator training requirements. Liquid formulations providing consistent performance characteristics and eliminating dust generation concerns associated with powder handling, particularly valuable in facilities with limited ventilation or safety constraints.
- Momentum: steady growth driven by expanding adoption in smaller treatment facilities and industrial applications where operational simplicity and safety considerations outweigh chemical cost differentials. Liquid polymer systems benefiting from reduced capital investment requirements with simpler mixing equipment and smaller footprints compared to powder preparation systems. Growing availability of specialized liquid polymer formulations optimized for specific applications supporting performance advantages in certain treatment scenarios.
- Watchouts: higher unit chemical costs compared to powder formulations affecting operating expenses particularly in large-scale applications, limited shelf life requiring careful inventory management and potential waste from expired material, transportation cost disadvantages due to water content reducing shipping efficiency, competitive pressure from powder systems in cost-sensitive markets.
|
| Powder |
- Significant presence with 42.7% share in 2025, showing steady adoption through 2035. Powder polymer formulations offering substantial cost advantages in large-scale applications with active ingredient concentrations typically 2-3 times higher than liquid emulsions, reducing chemical procurement costs and storage space requirements. Powder systems requiring more sophisticated mixing equipment but delivering economic benefits in high-volume treatment facilities where chemical costs represent significant operational expenses.
- Momentum: moderate growth driven by adoption in large municipal wastewater treatment plants and industrial facilities with substantial polymer consumption where economic advantages justify equipment investments. Powder polymer systems gaining traction in regions with transportation cost challenges where shipping water content in liquid formulations becomes economically disadvantageous. Technological advances in powder handling and wetting systems reducing operational complexity and improving preparation consistency.
- Watchouts: higher capital investment requirements for mixing equipment including wetting systems and aging tanks, operator training needs for proper preparation procedures affecting labor costs, dust generation during handling requiring ventilation and safety controls, mixing time requirements affecting response flexibility in variable treatment conditions.
|
Polymer Mixing Unit Market Analysis by Application
| Segment |
2025 to 2035 Outlook |
| Wastewater Treatment |
- Dominant segment with 44.6% market share in 2025, expected to maintain leadership through 2035. Encompasses municipal wastewater treatment plants, industrial effluent treatment facilities, and decentralized treatment systems using polymer mixing units for primary clarification, activated sludge settling enhancement, and biosolids dewatering applications. Largest volume contributor driven by global wastewater treatment capacity expansion and facility modernization programs addressing aging infrastructure and growing treatment demands.
- Momentum: steady growth supported by urbanization driving municipal treatment capacity expansion, increasingly stringent discharge regulations requiring enhanced treatment performance, and growing industrial water recycling initiatives necessitating advanced effluent conditioning. Biosolids dewatering applications particularly driving polymer mixing unit demand as facilities seek to optimize sludge management costs through improved water removal efficiency. Emerging decentralized treatment systems and package plants requiring integrated polymer preparation capabilities.
- Watchouts: municipal budget constraints affecting capital equipment investments particularly in smaller communities, long procurement cycles for public sector projects creating revenue timing uncertainties, competitive bidding environments creating pricing pressure, maintenance budget limitations potentially affecting replacement cycles and upgrade adoption.
|
| Paper Industry |
- Significant segment holding 23.8% share in 2025 with variable growth trajectory through 2035. Covers pulp and paper manufacturing facilities using polymer mixing units for process water clarification, white water treatment, and fiber recovery applications where polyelectrolytes enhance solid-liquid separation efficiency. Paper industry applications demanding reliable polymer preparation systems supporting continuous production operations and minimizing treatment system downtime affecting mill productivity.
- Momentum: moderate growth in emerging markets with paper production capacity expansion while mature markets experience gradual decline due to digitalization reducing paper consumption. Growing emphasis on water recycling and zero liquid discharge in paper mills driving investment in advanced treatment systems requiring precise polymer dosing. Specialty paper and packaging segment growth supporting sustained demand for process optimization equipment.
- Watchouts: paper industry consolidation and mill closures in developed markets reducing total addressable market, intense cost competition in commodity paper grades limiting capital investment budgets, alternative separation technologies potentially reducing polymer dependence in some applications, production volatility affecting equipment purchasing patterns.
|
| Chemical Industry |
- Growing segment with 18.4% share in 2025 showing steady expansion through 2035. Includes chemical manufacturing facilities, pharmaceutical production operations, and specialty chemical plants using polymer mixing units for wastewater treatment, process water purification, and product recovery applications. Chemical industry applications often requiring specialized polymer preparation equipment handling aggressive chemicals and operating in hazardous area classifications.
- Momentum: solid growth driven by expanding chemical production capacity in Asia particularly China and India, increasing environmental compliance requirements for industrial effluent treatment, and growing water recycling adoption reducing freshwater consumption. Specialty chemical and pharmaceutical manufacturing growth supporting demand for sophisticated treatment systems with precise polymer dosing capabilities. Process intensification initiatives driving adoption of automated chemical feed systems.
- Watchouts: cyclical nature of chemical industry affecting capital investment timing, variable regulatory enforcement across regions creating market uncertainty, alternative treatment technologies competing in specific applications, safety and materials compatibility requirements increasing equipment costs and complexity.
|
| Others |
- Diverse segment holding 13.2% share in 2025 encompassing potable water treatment, mining and mineral processing, oil and gas production water treatment, food and beverage processing, and various industrial applications. Category includes specialized applications where polymer mixing units support unique treatment requirements and process optimization objectives across diverse industry sectors.
- Momentum: selective growth in niche applications including mining water management with tailings treatment expansion, oil and gas produced water treatment supporting environmental compliance, and food processing wastewater management addressing discharge regulations. Potable water treatment applications growing in regions implementing advanced treatment processes for challenging source water conditions. Emerging applications in resource recovery and circular economy initiatives.
- Watchouts: fragmented market characteristics limiting focused commercial efforts, diverse technical requirements increasing product development costs, small volume applications potentially receiving limited supplier attention, economic sensitivity in commodity industries affecting equipment investment priorities.
|
Polymer Mixing Unit Market Analysis by Region
| Region |
Status & Outlook 2025-2035 |
| Asia Pacific |
- Dominant region commanding approximately 38.7% market share in 2025, driven by massive water infrastructure investments across China, India, Southeast Asia, and other developing economies with rapid urbanization and industrialization creating substantial wastewater treatment capacity expansion. Region experiencing fastest growth in treatment plant construction with governments prioritizing environmental protection and public health infrastructure development.
- Momentum: robust growth trajectory supported by continued urbanization with hundreds of millions of people transitioning to urban areas requiring new treatment infrastructure, industrial production expansion particularly in water-intensive manufacturing sectors, and increasingly stringent environmental regulations driving treatment system upgrades. China leading regional growth with comprehensive wastewater treatment infrastructure development under environmental protection initiatives. India and Southeast Asian nations implementing ambitious water infrastructure programs creating sustained equipment demand.
- Watchouts: intense price competition from local equipment manufacturers creating margin pressure, varying quality standards and regulatory enforcement across countries, project financing challenges in some markets affecting procurement timelines, preference for lower-cost solutions potentially limiting adoption of advanced systems.
|
| North America |
- Established market holding approximately 27.4% share in 2025, characterized by mature water treatment infrastructure, stringent regulatory compliance requirements, and emphasis on operational optimization and equipment modernization. United States representing majority of regional market with comprehensive municipal and industrial treatment infrastructure requiring ongoing maintenance and periodic replacement investments.
- Momentum: moderate growth driven by aging infrastructure replacement needs with many treatment facilities installed decades ago reaching end of service life, regulatory updates requiring enhanced treatment capabilities, and growing industrial water recycling adoption. Infrastructure investment initiatives supporting municipal treatment plant upgrades and capacity expansion projects. Increasing adoption of automated systems and smart water technologies creating opportunities for advanced polymer mixing units with monitoring and control capabilities.
- Watchouts: mature market characteristics limiting overall growth rates, municipal budget constraints affecting capital investment timing particularly in smaller communities, long equipment lifecycles reducing replacement frequency, competitive intensity among established suppliers creating pricing pressure.
|
| Europe |
- Critical market with approximately 24.6% share in 2025, featuring advanced water treatment infrastructure, comprehensive environmental regulations, and emphasis on sustainability and resource efficiency. Region characterized by sophisticated treatment technologies, high environmental standards, and growing focus on circular economy principles including water reuse and nutrient recovery.
- Momentum: steady growth supported by regulatory compliance requirements under EU directives, facility modernization programs incorporating energy efficiency and automation improvements, and expanding industrial water recycling initiatives. Eastern European infrastructure development and Western European facility upgrades creating balanced demand patterns. Growing emphasis on biosolids quality and phosphorus recovery driving polymer optimization efforts.
- Watchouts: mature infrastructure in Western Europe limiting greenfield opportunities, economic uncertainties affecting public sector investment budgets, stringent technical specifications potentially limiting supplier participation, competitive landscape dominated by established local manufacturers.
|
What are the Primary Demand Drivers, Emerging Restraints, and Major Trends Shaping the Polymer Mixing Unit Market Outlook?
| DRIVERS |
RESTRAINTS |
KEY TRENDS |
- Infrastructure Investment Growth:Substantial global investments in water and wastewater treatment infrastructure driven by urbanization, regulatory requirements, and aging facility replacement creating sustained demand for polymer preparation equipment across municipal and industrial sectors.
- Environmental Compliance Pressure:Increasingly stringent discharge regulations and drinking water quality standards mandating advanced treatment processes requiring precise polymer dosing systems ensuring consistent regulatory compliance and environmental protection.
- Operational Cost Optimization:Growing emphasis on reducing chemical consumption and labor costs through automated polymer mixing systems maximizing treatment efficiency while minimizing waste and operational expenses in resource-constrained environments.
|
- Budget Constraints:Municipal and industrial capital budget limitations affecting equipment procurement particularly in smaller facilities and economically challenged regions where cost considerations outweigh operational optimization benefits.
- Long Equipment Lifecycles:Extended service life of properly maintained polymer mixing units reducing replacement frequency and limiting market growth potential in mature infrastructure markets with established equipment bases.
- Alternative Technologies:Competition from alternative separation and treatment technologies potentially reducing polymer dependence in certain applications affecting chemical dosing equipment demand in specific market segments.
|
- Automation Integration:Growing adoption of automated polymer mixing systems with real-time monitoring, flow-paced dosing, and remote control capabilities enabling precision chemical management and reducing manual operator intervention requirements.
- Smart Water Technologies:Integration of polymer mixing units with advanced process control systems, SCADA platforms, and data analytics tools supporting optimization strategies and predictive maintenance programs improving reliability.
- Energy Efficiency Focus:Development of energy-efficient mixing technologies and optimized preparation systems minimizing power consumption while maintaining performance supporting sustainability objectives and operational cost reduction.
- Modular System Design:Increasing availability of containerized and skid-mounted polymer mixing systems enabling rapid deployment, simplified installation, and flexible capacity scaling for diverse facility requirements and emergency applications.
|
How is the Polymer Mixing Unit Market Evolving Across Major Industrial Economies?
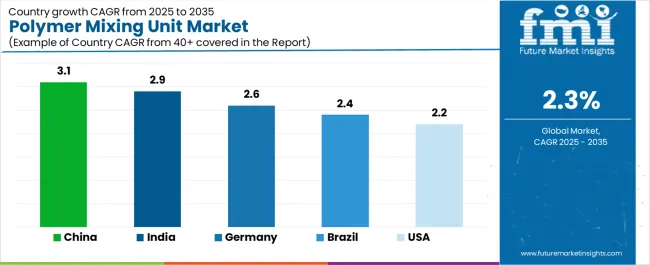
| Country |
CAGR (2025-2035) |
| China |
3.1% |
| India |
2.9% |
| Germany |
2.6% |
| Brazil |
2.4% |
| USA |
2.2% |
How is China Driving Widespread Adoption Of Polymer Mixing Units Through Large-Scale Manufacturing Demand?
Revenue from polymer mixing units in China is projected to exhibit strong growth with a market value of USD 83.5 million by 2035, driven by unprecedented water infrastructure investments with government committing hundreds of billions annually to wastewater treatment capacity expansion and comprehensive environmental protection initiatives targeting water quality improvement across urban and rural areas. The country's rapid urbanization with over 60% of population in cities and continuing industrial expansion creating massive treatment infrastructure requirements. Major municipal utilities and industrial facilities implementing advanced treatment systems requiring sophisticated polymer preparation equipment supporting environmental compliance objectives.
- Wastewater treatment infrastructure expansion programs with thousands of new treatment plants constructed and existing facilities upgraded to meet increasingly stringent discharge standards creating sustained demand for polymer mixing equipment across diverse facility scales
- Industrial water treatment requirements driven by environmental compliance enforcement and water scarcity concerns compelling manufacturers to invest in effluent treatment and water recycling systems incorporating polymer preparation capabilities
- Government environmental protection priorities and pollution control action plans driving comprehensive water infrastructure development with substantial public investment supporting equipment procurement across municipal and industrial sectors
India Demonstrates Strong Growth Potential with Infrastructure Development
Revenue from polymer mixing units in India is expanding to reach USD 72.8 million by 2035, supported by ambitious water infrastructure development programs including national missions for urban water supply and sanitation with substantial government funding supporting treatment plant construction across growing urban centers. The country's rapid urbanization with expanding middle class and increasing environmental awareness driving political pressure for improved water and wastewater infrastructure. Major cities implementing comprehensive sewage treatment programs addressing historic infrastructure deficits.
- Urban infrastructure expansion with government programs including Smart Cities Mission and Atal Mission for Rejuvenation and Urban Transformation supporting wastewater treatment plant construction creating substantial equipment opportunities across tier-one through tier-three cities
- Industrial sector growth and regulatory enforcement improvements compelling manufacturing facilities to implement proper effluent treatment systems with polymer mixing units essential for effective treatment and discharge compliance
- Public-private partnership models and international development financing supporting water infrastructure projects creating diverse procurement pathways and expanding market access for equipment suppliers offering competitive solutions
How is Germany Contributing to Polymer Mixing Unit Progress Through Engineering Excellence And Process Optimization?
Demand for polymer mixing units in Germany is projected to reach USD 63.5 million by 2035, supported by the country's leadership in water treatment technology with sophisticated municipal utilities and industrial facilities maintaining advanced treatment systems incorporating precision chemical dosing equipment. German market characterized by emphasis on quality, efficiency, and long-term operational performance over initial cost considerations. Comprehensive regulatory framework ensuring high treatment standards and environmental protection.
- Advanced treatment infrastructure and operational excellence culture supporting adoption of sophisticated polymer mixing systems with automation, monitoring, and optimization capabilities maximizing treatment efficiency and chemical utilization
- Industrial water management sophistication with German manufacturers leading water recycling and zero liquid discharge implementation creating demand for advanced treatment systems requiring precise polymer preparation
- Equipment replacement cycles and facility modernization programs upgrading aging infrastructure with energy-efficient systems and enhanced automation supporting continued equipment procurement despite mature market characteristics
Brazil Expands Market with Regional Infrastructure Investment
Revenue from polymer mixing units in Brazil is growing to reach USD 55.4 million by 2035, driven by the country's position as Latin America's largest economy with substantial water infrastructure investment needs addressing historic sanitation coverage gaps and growing urban population requirements. Brazilian municipalities implementing comprehensive sewerage and treatment programs supported by national sanitation framework legislation mandating universal service coverage targets. Market characterized by diverse facility scales from major metropolitan systems to smaller municipal plants.
- National sanitation legislation establishing universal service goals driving comprehensive wastewater treatment infrastructure expansion across municipalities with federal funding and regulatory pressure supporting capital investment programs
- Industrial sector water management improvements with manufacturing facilities implementing proper effluent treatment addressing environmental compliance requirements and water scarcity concerns in water-stressed regions
- Regional market position attracting equipment suppliers serving broader Latin American markets with Brazil representing substantial domestic opportunity and strategic base for regional operations supporting neighboring country exports
How is the United States Enabling Polymer Mixing Unit Demand Through Automation-Centric Production Facilities?
Demand for polymer mixing units in the U.S. is projected to reach USD 48.3 million by 2035, driven by aging water infrastructure requiring substantial reinvestment with many treatment facilities installed decades ago reaching end of design life and requiring equipment replacement. American market characterized by sophisticated treatment operations, stringent regulatory compliance requirements, and growing emphasis on operational efficiency and automation. Infrastructure investment legislation providing funding support for municipal facility upgrades.
- Infrastructure replacement needs with aging polymer mixing equipment requiring modernization creating steady equipment demand despite mature market characteristics with emphasis on upgraded systems offering improved reliability and automation capabilities
- Regulatory compliance drivers including nutrient removal requirements and biosolids quality standards necessitating optimized polymer application supporting investment in precision mixing and dosing systems improving treatment performance
- Operational efficiency emphasis with utilities seeking to reduce chemical consumption costs and labor requirements through automated polymer preparation systems with monitoring and control capabilities supporting cost optimization objectives
How is the United Kingdom Maintaining Consistent Market Activity Through Process Reliability and Upgrades?
Demand for polymer mixing units in the U.K. is projected to reach USD 42.1 million by 2035, supported by sophisticated water utility sector with privatized companies maintaining comprehensive treatment infrastructure and emphasizing operational optimization and regulatory compliance. British water industry characterized by performance-based regulation incentivizing efficiency improvements and capital maintenance programs. Market featuring established equipment base requiring ongoing replacement and selective upgrades.
- Asset management programs and regulatory incentives driving water company investments in equipment replacement and facility upgrades with polymer mixing systems included in capital maintenance programs ensuring continued operational reliability
- Operational efficiency focus with water companies seeking to optimize chemical consumption and treatment costs through precision polymer preparation systems supporting performance improvement targets established by economic regulator
- Environmental compliance requirements including discharge standards and biosolids quality parameters necessitating effective polymer application supporting investment in reliable mixing equipment maintaining consistent treatment performance
How is Japan Influencing Polymer Mixing Unit Adoption Through Precision-Focused Engineering and Operational Efficiency?
Demand for polymer mixing units in Japan is projected to reach USD 36.8 million by 2035, driven by the country's comprehensive water infrastructure with sophisticated treatment facilities maintaining high operational standards and emphasizing long-term reliability and performance consistency. Japanese market characterized by mature infrastructure requiring equipment replacement and selective upgrades incorporating advanced technologies. Cultural emphasis on quality and durability supporting adoption of premium equipment solutions.
- Equipment replacement cycles in aging facilities with polymer mixing units installed decades ago reaching end of service life creating steady demand for modernized systems incorporating current technologies and improved reliability features
- Operational excellence culture and stringent quality standards supporting adoption of sophisticated polymer mixing systems with monitoring capabilities and consistent performance characteristics meeting Japanese expectations for reliability and precision
- Disaster resilience emphasis following natural disaster experiences driving investments in robust treatment infrastructure including backup systems and reliable chemical preparation equipment supporting continued operation during emergency conditions
Europe Market Split by Country
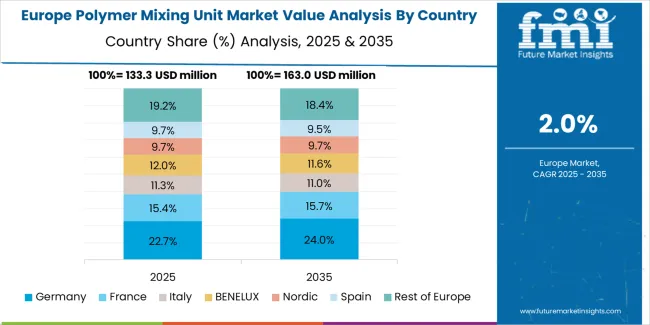
The polymer mixing unit market in Europe is projected to grow from USD 129.1 million in 2025 to USD 162.2 million by 2035, registering a CAGR of 2.3% over the forecast period. Germany is expected to maintain its leadership position with a 26.8% market share in 2025, reaching 27.3% by 2035, supported by its sophisticated water treatment infrastructure, leading equipment manufacturing capabilities, and comprehensive regulatory framework driving high treatment standards across municipal and industrial sectors.
France follows with a 17.9% share in 2025, projected to reach 18.2% by 2035, driven by comprehensive wastewater treatment infrastructure, major water utility operations, and ongoing facility modernization programs incorporating advanced treatment technologies. The United Kingdom holds a 16.4% share in 2025, expected to stabilize at 16.7% by 2035, supported by privatized water industry with performance-based regulation driving operational optimization and asset replacement programs. Italy commands a 13.7% share, while Spain accounts for 11.8% in 2025, both benefiting from EU environmental directives driving treatment infrastructure improvements and facility upgrades. The Rest of Europe region is anticipated to gain momentum, expanding its collective share from 13.4% to 13.9% by 2035, attributed to infrastructure development in Eastern European countries including Poland, Czech Republic, and Hungary where EU accession requirements and environmental compliance obligations are driving wastewater treatment capacity expansion and equipment modernization programs.
Premium Quality Standards Define Japanese Market Dynamics
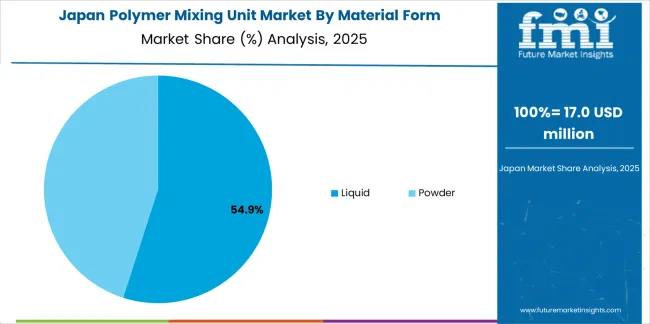
Japanese polymer mixing unit operations reflect the country's exacting quality standards and sophisticated water treatment infrastructure. Major municipal utilities and industrial facilities maintain rigorous equipment procurement processes emphasizing long-term reliability, comprehensive documentation, and proven performance track records that can require extensive reference validation and pilot testing extending procurement timelines to 18-24 months. This creates substantial barriers for new equipment suppliers but ensures consistent quality supporting Japan's reputation for infrastructure reliability and operational excellence.
The Japanese market demonstrates unique technical requirements, with significant emphasis on earthquake resistance incorporating seismic design standards, comprehensive corrosion protection reflecting humid climate conditions, and detailed maintenance documentation supporting preventive maintenance programs. Facilities require specific equipment specifications including compact footprints accommodating space constraints, low noise operation reflecting urban installation contexts, and integration capabilities with existing control systems that differ from Western applications, driving demand for customized engineering and localized technical support.
Regulatory oversight through Ministry of Land, Infrastructure, Transport and Tourism for municipal facilities and Ministry of Economy, Trade and Industry for industrial applications emphasizes comprehensive safety standards and environmental protection requirements. Equipment procurement processes require extensive technical documentation, quality certifications including JIS standards compliance, and demonstrated track records in Japanese operating conditions creating advantages for established suppliers with local presence and proven installation bases.
Supply chain management in Japanese water sector focuses on long-term partnership relationships rather than purely transactional procurement approaches. Municipal utilities and industrial facilities typically maintain decade-long supplier relationships, with annual performance reviews emphasizing equipment reliability, responsive technical support, and continuous improvement through collaborative problem-solving. This stability supports investment in localized inventory, dedicated service capabilities, and customized equipment variants optimized for Japanese requirements, while creating challenges for new market entrants seeking to establish customer relationships in this quality-focused market demanding demonstrated long-term commitment and local support infrastructure.
Market Dynamics Drive Innovation in South Korea
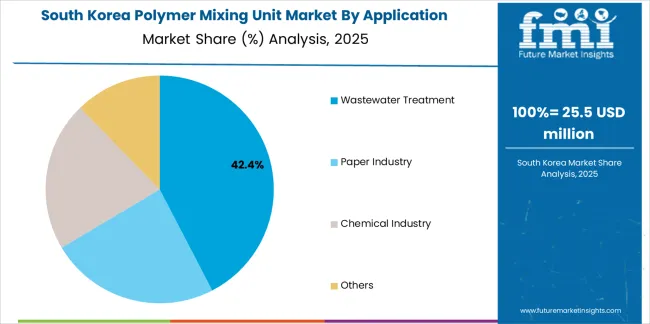
South Korean polymer mixing unit operations reflect the country's advanced water infrastructure and emphasis on technological sophistication. Major municipal utilities including Seoul Metropolitan Government Water Works and regional environmental facilities alongside industrial companies including major manufacturers drive equipment procurement strategies emphasizing automation, monitoring capabilities, and operational efficiency. Korean water sector benefiting from government infrastructure investments and comprehensive environmental regulations supporting treatment system modernization.
The Korean market demonstrates particular strength in rapid technology adoption and digital integration capabilities, with water utilities implementing smart water management systems and industrial facilities pursuing operational optimization through advanced process control. This creates opportunities for equipment suppliers offering polymer mixing units with integrated monitoring, remote access capabilities, and data connectivity supporting optimization initiatives. Korean operators increasingly focused on energy efficiency and chemical consumption optimization reflecting operational cost pressures.
Regulatory frameworks through Ministry of Environment maintain comprehensive water quality standards and treatment requirements following international best practices while incorporating specific Korean conditions. Equipment procurement processes emphasize technical performance verification, energy efficiency certifications, and comprehensive warranty provisions. Korean regulatory environment particularly favors suppliers demonstrating proven technology with installation references and technical support capabilities including local service presence.
Supply chain efficiency remains important given Korea's concentrated population and industrial production requiring reliable water infrastructure. Water utilities and industrial facilities increasingly pursuing equipment standardization and strategic supplier relationships supporting operational efficiency and maintenance optimization. Domestic equipment manufacturing capabilities growing with Korean companies developing polymer mixing unit production supporting competitive pricing while international suppliers maintain presence serving premium market segments and specialized applications requiring advanced capabilities and proven international technology platforms.
What Does Company Positioning Look Like in the Polymer Mixing Unit Market?
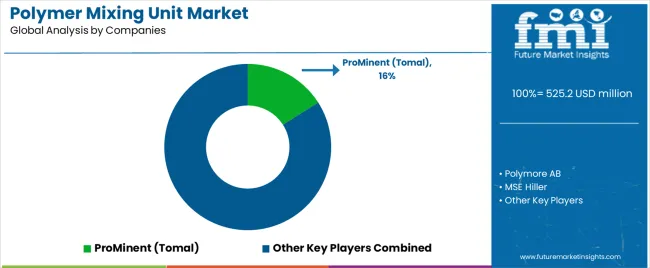
The polymer mixing unit market exhibits moderately fragmented characteristics with established regional equipment manufacturers maintaining strong positions in local markets alongside global water treatment equipment suppliers offering comprehensive product portfolios. Market dynamics favor suppliers with proven reliability track records, established distribution and service networks, and technical expertise supporting diverse application requirements across municipal and industrial sectors. Several distinct competitive archetypes define market structure: specialized polymer preparation equipment manufacturers focusing exclusively on mixing and dosing systems with deep technical expertise; comprehensive water treatment equipment suppliers offering polymer mixing units as part of broader chemical feed and process equipment portfolios; regional manufacturers serving local markets with cost-competitive solutions and responsive service capabilities; and package treatment system integrators incorporating polymer mixing units as components of complete treatment solutions.
Competitive differentiation increasingly centers on equipment reliability and longevity, automation and monitoring capabilities, technical support and application expertise, and total cost of ownership including energy consumption and maintenance requirements. Project-specific customization capabilities including materials of construction selection, capacity scaling, and control system integration represent critical differentiators as treatment facilities implement unique requirements and existing infrastructure constraints. Price competition remains significant particularly in municipal procurement processes utilizing competitive bidding, though lifecycle cost considerations including energy efficiency and maintenance accessibility increasingly influence purchasing decisions beyond initial capital costs.
Strategic imperatives include developing automated mixing systems with integrated monitoring supporting operational optimization, expanding service networks ensuring responsive technical support and spare parts availability, and building application expertise supporting effective polymer selection and process optimization throughout equipment lifecycle. Geographic expansion focuses on high-growth emerging markets particularly Asia where infrastructure investment creates substantial opportunities, while established markets emphasize equipment replacement and upgrade opportunities as aging infrastructure requires modernization. Technology development priorities include energy-efficient mixing mechanisms, advanced control algorithms optimizing polymer preparation, and modular designs supporting flexible capacity scaling and simplified installation across diverse facility configurations and spatial constraints.
Who are the Prominent Companies Shaping the Polymer Mixing Unit Market Globally?
- ProMinent (TOMAL)
- Polymore AB
- MSE Hiller
Scope of the Report
| Items |
Values |
| Quantitative Units |
USD 525.2 million |
| Material Form |
Liquid, Powder |
| Application |
Wastewater Treatment, Paper Industry, Chemical Industry, Others |
| Regions Covered |
North America, Latin America, Europe, Asia Pacific, Middle East & Africa |
| Country Covered |
China, India, Germany, Brazil, United States, United Kingdom, Japan, South Korea, and other 35+ countries |
| Key Companies Profiled |
ProMinent (Tomal), Polymore AB, MSE Hiller, AllWater Technologies, WA Cooke & Sons, Milton Roy, Clearwater Industries, Hoffland Environmental, S.K. EUROMARKET, CNP Water, MEPCSS, Sera, SPINPRO, Trident |
| Additional Attributes |
Dollar sales by material form and application, regional demand (North America, Europe, Asia Pacific, Latin America, Middle East & Africa), competitive landscape, automation capabilities, reliability achievements, and advanced mixing technologies driving operational efficiency, chemical optimization, and environmental compliance |
Polymer Mixing Unit Market Segmentation
By Material Form:
By Application:
- Wastewater Treatment
- Paper Industry
- Chemical Industry
- Others
By Region:
- North America
- Europe
- Asia Pacific
- Latin America
- Middle East & Africa
Frequently Asked Questions
How big is the polymer mixing unit market in 2025?
The global polymer mixing unit market is estimated to be valued at USD 525.2 million in 2025.
What will be the size of polymer mixing unit market in 2035?
The market size for the polymer mixing unit market is projected to reach USD 659.3 million by 2035.
How much will be the polymer mixing unit market growth between 2025 and 2035?
The polymer mixing unit market is expected to grow at a 2.3% CAGR between 2025 and 2035.
What are the key product types in the polymer mixing unit market?
The key product types in polymer mixing unit market are liquid and powder.
Which application segment to contribute significant share in the polymer mixing unit market in 2025?
In terms of application, wastewater treatment segment to command 44.6% share in the polymer mixing unit market in 2025.


