Porous Metal Sheet Market Size and Share Forecast Outlook 2025 to 2035

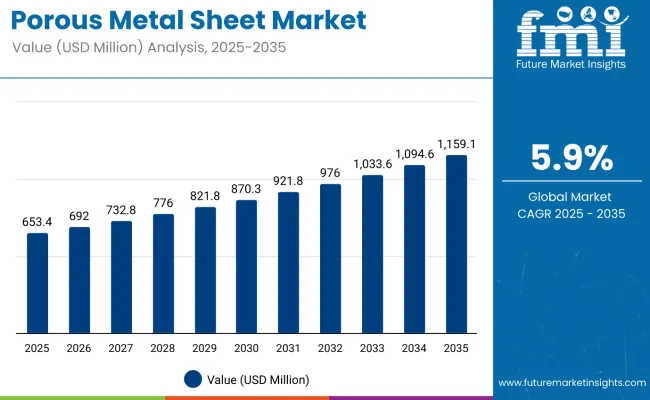
The global porous metal sheet market is estimated to reach USD 653.4 million in 2025 and is projected to expand to approximately USD 1,159.1 million by 2035, marking an absolute dollar growth of USD 505.7 million and a 77.4% increase over the assessment period. The market is anticipated to grow at a compound annual growth rate (CAGR) of 5.9%, with the industry forecast to grow by nearly 1.77X over the decade.
Quick Stats For Porous Metal Sheet Market

  • Industry Value (2025): USD 653.4 million
  • Forecast Value (2035): USD 1,159.1 million
  • Forecast CAGR: 5.9%
  • Leading Segment (2025): Filtration Application (40% share)
  • Key Growth Region: China (6.8% CAGR)
  • Top Key Players: Mott Corporation, Taisei Kogyo Co., Ltd., Van Borselen, ShengzhenHengko, Applied Porous Technologies

Porous Metal Sheet Market

Metric Value
Industry Size (2025E) USD 653.4 million
Industry Value (2035F) USD 1,159.1 million
CAGR (2025 to 2035) 5.9%

Demand is being shaped by increased utilization of porous metal sheets in advanced filtration systems, noise reduction modules, structural reinforcements, and high-temperature gas diffusion applications across chemical processing, automotive, aerospace, and energy sectors.

Between 2025 and 2030, the market is projected to increase from USD 653.4 million to USD 870.3 million, generating an incremental opportunity of USD 216.9 million. Growth in this period is being propelled by stronger regulatory enforcement around particulate filtration, increased replacement of polymer and ceramic materials with metal-based porous alternatives, and expanded use of structured metal meshes in electrochemical and catalytic reactors.

From 2030 to 2035, market value is forecast to grow from USD 870.3 million to USD 1,159.1 million, accounting for a further addition of USD 288.8 million. Key contributors to this growth include rising adoption in hydrogen fuel cell support plates, battery thermal barriers, biomedical implants, and waste heat recovery units. Innovation in powder metallurgy, additive manufacturing, and sintering technologies is enhancing the structural precision, porosity control, and application compatibility of porous metal sheet formats.

Material suppliers and OEMs are expected to benefit from improved product customization, modularity, and regulatory compliance, particularly in industries prioritizing durability, corrosion resistance, and thermal conductivity. The porous metal sheet market is evolving as a critical enabler of multi-functional design in next-generation energy systems, clean-tech platforms, and sustainable infrastructure projects.

Between 2020 and 2025, the porous metal sheet market recorded steady expansion, with the global value rising from USD 490.6 million in 2020 to USD 653.4 million in 2025, registering an absolute gain of USD 162.8 million over the five-year period. This growth was primarily supported by the resurgence of industrial filtration demand across chemical, petrochemical, and food processing sectors, alongside accelerated adoption of metallic meshes for noise dampening, heat shielding, and gas-liquid separation.

Product usage intensified in oil mist eliminators, self-cleaning filters, and degassing units, where polymer-based membranes were increasingly replaced by corrosion-resistant porous metal media due to their longer service life, mechanical strength, and resistance to thermal degradation. The period also saw OEMs integrating porous sheets into automotive exhaust components, fluid power systems, and metal-air battery enclosures.

Why the Porous Metal Sheet Market is Growing?

The porous metal sheet market is expanding due to technological differentiation, performance-driven end-use demand, and rising industrial preference for reusable filtration media. Increasing global focus on process reliability, equipment longevity, and contamination control has elevated the importance of metallic porous structures across sectors.

Industrial filtration and separation applications are a primary growth lever. Porous metal sheets are being selected for backflushable filter systems, fluidizing beds, and multiphase reactors, particularly in the chemical, oil & gas, and pharmaceutical industries, where polymer alternatives cannot withstand high temperatures, pressure fluctuations, or corrosive streams. Their resistance to cracking, fouling, and delamination under cyclic operations makes them essential for critical systems that demand zero compromise on flow consistency and purity.

The market is also benefitting from advances in powder metallurgy, sintering control, and multi-layer lamination, which are enabling custom porosity profiles, gradient density zones, and optimized flow paths. These innovations are allowing manufacturers to meet application-specific permeability, strength, and thermal requirements without excessive weight or material wastage.

Segment Overview

The market is segmented by material type into stainless steel, aluminum, nickel, bronze, titanium & alloys, and others, reflecting varied corrosion resistance, strength, and cost considerations. Manufacturing processes include sintered powder sheets, metal fibers, mesh laminates, and metal foam sheets, each offering distinct porosity and mechanical properties.

Key application areas span filtration, flow control, acoustic damping, medical implants, electronics shielding, and others, supporting use across industrial, healthcare, and electronic sectors. Regional analysis covers North America, Latin America, Western and Eastern Europe, East Asia, South Asia & Pacific, and the Middle East and Africa to track growth differentials and emerging demand centers.
Stainless Steel Remains the Primary Material Used for Porous Metal Sheets

Porous Metal Sheet Market By Material

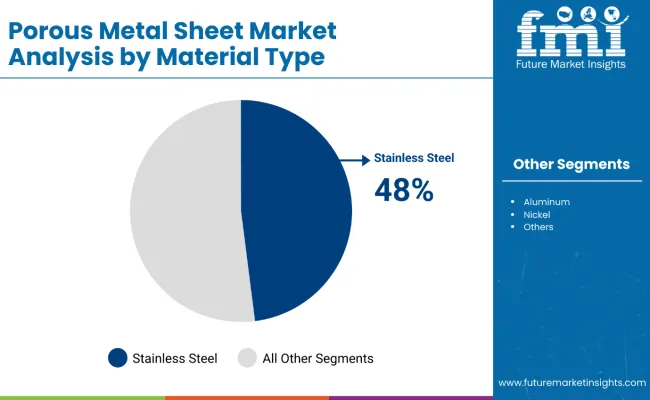
Stainless steel is estimated to hold a 48% share in the material type segment in 2025 and is projected to maintain dominance throughout the forecast period. Its widespread use is supported by excellent corrosion resistance, mechanical strength, and compatibility with multiple fabrication techniques.

Stainless steel porous sheets are extensively adopted in chemical processing, food and beverage, pharmaceutical, and filtration systems where durability under high pressure and temperature is required. The ability to produce fine pores and high structural integrity further reinforces its preference over alternatives like bronze or titanium.
Sintered Powder Sheets Dominate Manufacturing Owing to High Customizability

Porous Metal Sheet Market By Manufacturing

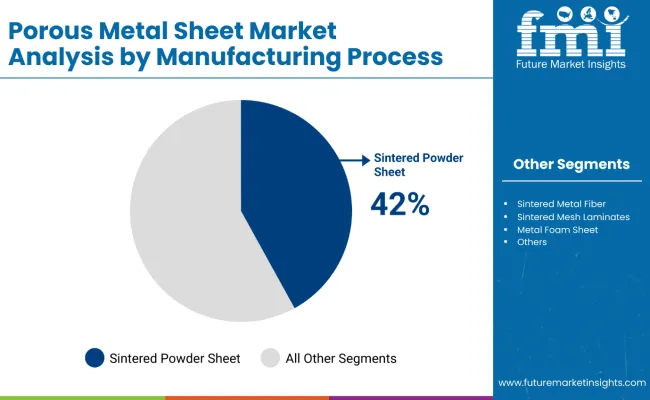
Sintered powder sheets are expected to account for 42% of the manufacturing process segment in 2025 and remain the most utilized fabrication technique through 2035. Their adoption is driven by the ability to achieve uniform porosity, tailored flow rates, and controlled permeability for filtration and diffusion applications.

The sintering of metal powders enables production of robust and corrosion-resistant sheets with precision thickness, which makes them suitable for use in aerospace, industrial gas filtration, and catalyst support structures. Manufacturers continue to favor this process for its cost-effectiveness in volume production.
Filtration Application Drives Bulk of Demand in End Use Industries

Porous Metal Sheet Market By Application

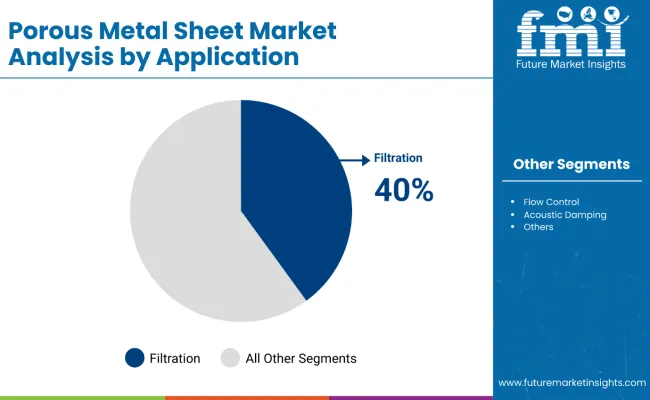
Filtration is projected to represent 40% share in the application segment in 2025 and is likely to remain the most prominent usage area over the next decade. Porous metal sheets serve as key media for fluid and gas filtration in sectors such as petrochemical, pharmaceuticals, power generation, and water treatment.

The combination of high temperature resistance, cleanability, and mechanical strength makes them suitable for aggressive operating environments. Demand is being reinforced by stricter industry regulations, emphasis on process purity, and the need for long-life filter media in critical operations.

What are the Drivers, Restraints, and Key Trends of the Porous Metal Sheet Market?

The porous metal sheet market is being driven by increased demand for durable, high-performance filtration and flow control solutions across chemical processing, clean energy, and life sciences. These sheets offer long service life, corrosion resistance, and thermal stability which is critical in systems exposed to aggressive media, high temperatures, or dynamic pressures.

However, growth is moderated by high production costs, limited global manufacturing capacity, and the precision engineering required to maintain consistent porosity and mechanical integrity. The adoption curve remains steep for price-sensitive industries where polymer or ceramic alternatives are still viable.

Hydrogen Economy Accelerates Adoption in Energy and Transportation

As hydrogen fuel systems scale globally, porous metal sheets are being integrated into fuel cells, hydrogen separators, and moisture traps due to their permeability control and pressure handling capabilities. Their role as support structures in bipolar plates and diffusion layers is enabling better heat dissipation and structural resilience in mobile and stationary hydrogen systems.

Process-Specific Customization Enhances Competitive Differentiation

Demand is rising for customized porosity gradients, multi-layer mesh laminates, and hybrid metal-fiber constructions. These configurations allow process designers to fine-tune flow uniformity, acoustic absorption, and chemical resistance based on exact operating requirements. OEMs and system integrators are increasingly turning to porous metal sheet suppliers with advanced sintering, layering, and bonding technologies to meet application-specific performance benchmarks.
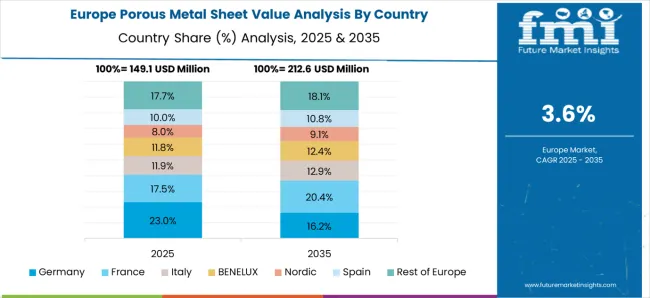
Europe Market Split by Country

Porous Metal Sheet Market Europe

The porous metal sheet market in Europe is projected to expand from USD 149.1 million in 2025 to USD 212.6 million by 2035, reflecting a CAGR of 3.6%. Germany will continue to lead in absolute terms but its market share is expected to decline from 23.0% to 16.2% due to saturation in traditional applications like automotive filtration.

Spain is poised for strong growth, increasing its share from 17.5% to 20.4%, supported by industrial air treatment and filtration projects. Italy’s share is expected to grow from 11.9% to 12.9%, aided by the country’s strength in stainless steel production and medical-grade filter systems. France and the BENELUX region are likely to experience steady gains driven by pharmaceutical, cleanroom, and precision engineering uses.
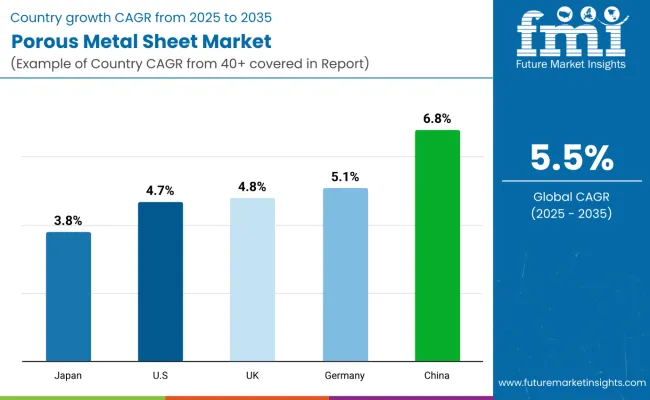
Country Wise Growth Outlook

Porous Metal Sheet Market By Country

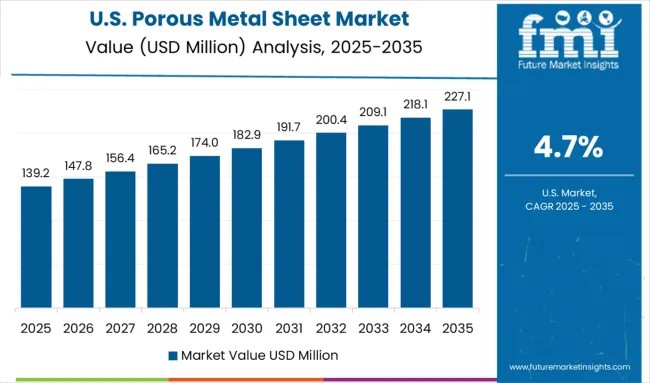
United States: Filtration Efficiency and Industrial Retrofitting to Support 4.7% CAGR

Porous Metal Sheet Market Usa

The USA porous metal sheet market is projected to grow at a CAGR of 4.7% between 2025 and 2035. Demand is driven by stringent EPA and FDA requirements for advanced filtration in food processing, pharmaceuticals, and chemical industries. Retrofitting of industrial HVAC and gas filtration systems is expanding the application base of sintered metal sheets.

  • Uptake in medical implants and sterile filtration in biotech facilities
  • Growth in demand for flow restrictors in hydraulic and pneumatic systems
  • Adoption of metal mesh in noise suppression solutions for defense and transport
  • Increasing domestic sourcing for clean energy applications such as hydrogen

United Kingdom: Smart Manufacturing Push Bolsters 4.8% CAGR

The UK is expected to grow at a CAGR of 4.8%, supported by government incentives for smart factories and industrial modernization. Sintered metal sheets are increasingly used in air and gas filtration systems, particularly in electronics, battery storage, and chemical sectors.

  • Localized production of porous media for lab-on-chip and analytical instruments
  • Filtration-grade stainless steel sheets deployed in semiconductor fabs
  • Medical device manufacturers leveraging corrosion-resistant alloys
  • Focus on reducing contamination in EV battery cooling loops

Germany: Process Safety and High-Purity Applications Drive 5.1% CAGR

Germany’s market is forecast to grow at a CAGR of 5.1% through 2035, led by high-precision applications in industrial filtration, automotive exhaust control, and chemical reactors. The country's dominance in manufacturing equipment is reinforcing usage of metal mesh laminates and foam sheets.

  • Broad deployment in gas filtration for pharma and fine chemicals
  • Energy transition boosting demand in electrolyzer and fuel cell systems
  • Preference for corrosion-resistant nickel and alloy-based sintered parts
  • Retrofit of flow control units in petrochemical and HVAC sectors

China: Broad-Based Industrialization to Accelerate Market at 6.8% CAGR

China is projected to lead the global market with a CAGR of 6.8% from 2025 to 2035. The country is experiencing strong demand for porous metal components in wastewater treatment, construction equipment, and chemical filtration. Local manufacturing of sintered products is expanding due to cost and logistics advantages.

  • Widespread use of stainless steel sintered sheets in environmental filtration
  • Automotive and aerospace OEMs integrating porous metals in pressure equalization and fuel systems
  • Proliferation of membrane protection layers in water desalination and purification
  • Increasing exports of porous metal filters to Southeast Asia and MENA

Japan: Compact Industrial Systems and Medical Technology Drive 3.8% CAGR

Japan is expected to grow at a CAGR of 3.8%, supported by niche applications in precision medical implants, acoustic control systems, and compact electronics cooling. Stainless steel and titanium porous sheets are being used in advanced surgical tools, implantable devices, and precision filters.
  • Medical device segment driving demand for miniaturized sintered parts
  • Acoustic damping in consumer electronics supported by metal foam sheets
  • Expanded use of porous media in hydrogen sensors and catalyst beds
  • Integration in automotive EGR and emission control subsystems for hybrids

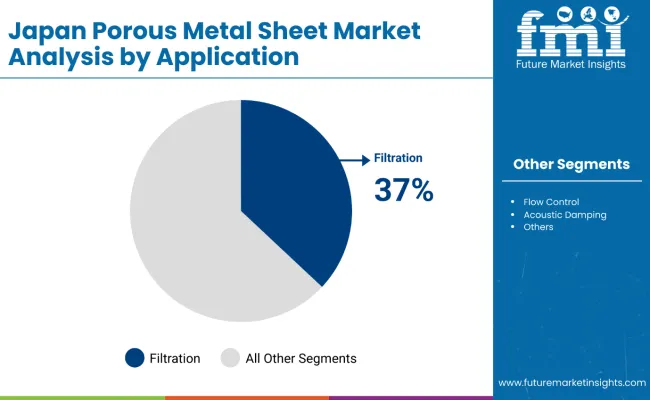
Japan: Filtration Applications Lead Porous Metal Sheet Adoption

Porous Metal Sheet Market Japan

In Japan, filtration is estimated to hold a 37% share in porous metal sheet applications by 2025. The dominance of this segment is attributed to the country's strong base of high-precision industries, including medical devices, electronics, and pharmaceuticals, where fine particulate removal and fluid purity are critical. Flow control accounts for 18%, driven by usage in microfluidic systems and process control valves.

Acoustic damping and electronics shielding each hold 12%, reflecting applications in compact consumer electronics, automotive infotainment, and high-end industrial systems. Medical implants represent 14% of demand, where titanium- and nickel-based porous sheets are used in orthopedic and surgical implants due to their biocompatibility and strength-to-weight performance.
  • High-grade stainless steel sintered sheets widely used in drug delivery and biotech filtration
  • Demand for damping and shielding solutions driven by miniaturized consumer electronics
  • Filtration elements integrated into cleanroom and air purification systems
  • Custom porous geometries preferred in spinal and dental implants for osseointegration

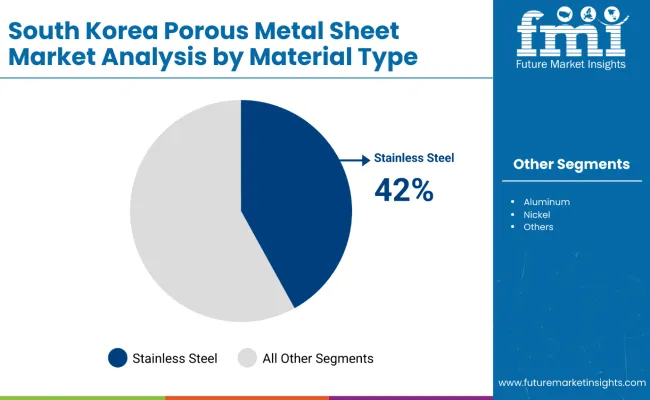
South Korea: Stainless Steel Accounts for 42% of Material Usage

Porous Metal Sheet Market South Korea

In South Korea, stainless steel is expected to lead material adoption for porous metal sheets with a 42% share in 2025. Its durability, corrosion resistance, and suitability for precision filtration make it ideal for high-spec industrial and medical applications. Nickel contributes 14%, favored in high-temperature and chemically reactive environments such as fuel cells, hydrogen filtration, and specialty electronics.

Aluminum holds 10% share, particularly in lightweight structural and energy storage applications. Titanium and alloys (8%) are increasingly utilized in aerospace and surgical tool segments, while bronze (6%) finds niche use in marine, fluid control, and vibration dampening components. Others, accounting for 20%, include hybrid metal composites and localized alloy variants tailored for export-grade product specifications.
  • Stainless steel dominates in chemical, power, and electronics filtration systems
  • Nickel porous sheets increasingly used in lithium-ion battery and hydrogen systems
  • Aluminum preferred for low-weight, high-surface-area applications in HVAC and batteries
  • Titanium expanding in export-focused surgical and aerospace manufacturing clusters

Competition Outlook

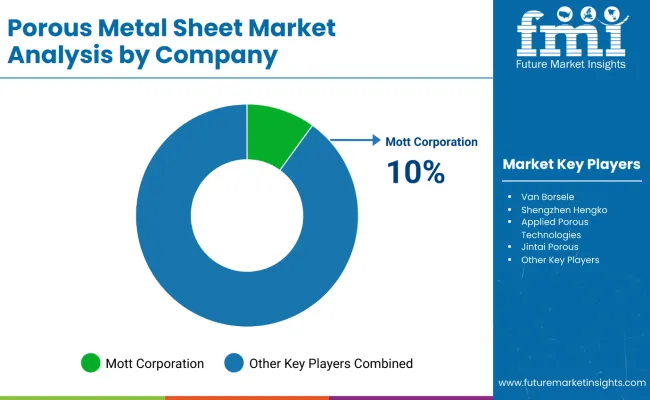
Porous Metal Sheet Market By Company

The porous metal sheet market is evolving with a focus on high-performance, application-specific solutions across filtration, aerospace, automotive, and energy sectors. Manufacturers are investing in advanced fabrication techniques, including precision perforation, sintering, and additive manufacturing, to enhance porosity control, strength, and durability. Developments in corrosion-resistant and lightweight alloys are enabling expanded use in harsh operating environments.

  • In June 2024, Mott Corporation announced the development of a new 65,000-square-foot facility in Connecticut to support its expanding clean energy business. The investment is expected to generate 100 new high-tech jobs focused on advanced manufacturing of porous metal components used in hydrogen fuel cells and clean energy systems. The facility aims to boost Mott’s capacity to meet growing global demand for decarbonization technologies, including electrolyzers and filtration solutions critical to clean hydrogen production.

Companies

  • Mott Corporation
  • Taisei Kogyo Co., Ltd.
  • Van Borselen
  • ShengzhenHengko
  • Applied Porous Technologies
  • Jintai Porous

Scope Table

Item Value
Quantitative Units USD 653.4 Million (2025)
Material Type Stainless Steel, Aluminum, Nickel, Bronze, Titanium & Alloys, Others
Manufacturing Process Sintered Powder Sheets, Sintered Metal Fiber, Sintered Mesh Laminates, Metal Foam Sheet, Others
Application Filtration, Flow Control, Acoustic Damping, Medical Implants, Electronics Shielding, Others
Regions Covered North America, Europe, East Asia, South Asia & Pacific, Latin America, Middle East & Africa
Countries Covered United States, Germany, United Kingdom, Japan, China
Key Companies Profiled Mott Corporation, GKN Powder Metallurgy, Porvair plc, Baoji Fitow Metal Co., Ltd., SINTO Group, HENGKO Technology Co., Ltd., Filtration Group

Key Segments

By Material Type:

  • Stainless Steel
  • Aluminum
  • Nickel
  • Bronze
  • Titanium & Alloys
  • Others

By Manufacturing Process:

  • Sintered Powder Sheets
  • Sintered Metal Fiber
  • Sintered Mesh Laminates
  • Metal Foam Sheet
  • Others

By Application:

  • Filtration
  • Flow Control
  • Acoustic Damping
  • Medical Implants
  • Electronics Shielding
  • Others

By Region:

  • North America
  • Latin America
  • Western Europe
  • Eastern Europe
  • East Asia
  • South Asia & Pacific
  • Middle East & Africa

Table of Content

  1. Executive Summary
    • Global Market Outlook
    • Demand-side Trends
    • Supply-side Trends
    • Technology Roadmap Analysis
    • Analysis and Recommendations
  2. Market Overview
    • Market Coverage / Taxonomy
    • Market Definition / Scope / Limitations
  3. Market Background
    • Market Dynamics
      • Drivers
      • Restraints
      • Opportunity
      • Trends
    • Scenario Forecast
      • Demand in Optimistic Scenario
      • Demand in Likely Scenario
      • Demand in Conservative Scenario
    • Key Success Factors
    • Industry Developments
    • Supply Chain Analysis
      • Sourcing and Procurement
        • Raw Material / Component Suppliers
        • Technology Providers
      • Product Manufacturers
      • Channel Partners
      • End Users / Customers
    • Market Assessment Factors
      • Macro-economic Factors
      • Forecast Factors
  4. 3.10. Parent Market Outlook
  5. Global Market Analysis 2020 to 2024 and Forecast, 2025 to 2035
    • Historical Market Size Value (USD Million) & Volume (Tons) Analysis, 2020 to 2024
    • Current and Future Market Size Value (USD Million) & Volume (Tons) Projections, 2025 to 2035
      • Y-o-Y Growth Trend Analysis
      • Absolute $ Opportunity Analysis
  6. Global Market Pricing Analysis 2020 to 2024 and Forecast 2025 to 2035
  7. Global Market Analysis 2020 to 2024 and Forecast 2025 to 2035, By Material Type
    • Introduction / Key Findings
    • Historical Market Size Value (USD Million) & Volume (Tons) Analysis By Material Type, 2020 to 2024
    • Current and Future Market Size Value (USD Million) & Volume (Tons) Analysis and Forecast By Material Type, 2025 to 2035
      • Stainless Steel
      • Aluminum
      • Nickel
      • Bronze
      • Titanium & Alloys
      • Others
    • Y-o-Y Growth Trend Analysis By Material Type, 2020 to 2024
    • Absolute $ Opportunity Analysis By Material Type, 2025 to 2035
  8. Global Market Analysis 2020 to 2024 and Forecast 2025 to 2035, By Manufacturing Process
    • Introduction / Key Findings
    • Historical Market Size Value (USD Million) & Volume (Tons) Analysis By Manufacturing Process, 2020 to 2024
    • Current and Future Market Size Value (USD Million) & Volume (Tons) Analysis and Forecast By Manufacturing Process, 2025 to 2035
      • Sintered Powder Sheets
      • Sintered Metal Fiber
      • Sintered Mesh Laminates
      • Metal Foam Sheet
      • Others
    • Y-o-Y Growth Trend Analysis By Manufacturing Process, 2020 to 2024
    • Absolute $ Opportunity Analysis By Manufacturing Process, 2025 to 2035
  9. Global Market Analysis 2020 to 2024 and Forecast 2025 to 2035, By Application
    • Introduction / Key Findings
    • Historical Market Size Value (USD Million) & Volume (Tons) Analysis By Application, 2020 to 2024
    • Current and Future Market Size Value (USD Million) & Volume (Tons) Analysis and Forecast By Application, 2025 to 2035
      • Filtration
      • Flow Control
      • Acoustic Damping
      • Medical Implants
      • Electronics Shielding
      • Others
    • Y-o-Y Growth Trend Analysis By Application, 2020 to 2024
    • Absolute $ Opportunity Analysis By Application, 2025 to 2035
  10. Global Market Analysis 2020 to 2024 and Forecast 2025 to 2035, By Region
    • Introduction
    • Historical Market Size Value (USD Million) & Volume (Tons) Analysis By Region, 2020 to 2024
    • Current Market Size Value (USD Million) & Volume (Tons) Analysis and Forecast By Region, 2025 to 2035
      • North America
      • Latin America
      • Western Europe
      • Eastern Europe
      • East Asia
      • South Asia & Pacific
      • Middle East & Africa
    • Market Attractiveness Analysis By Region
  11. North America Market Analysis 2020 to 2024 and Forecast 2025 to 2035, By Country
    • Historical Market Size Value (USD Million) & Volume (Tons) Trend Analysis By Market Taxonomy, 2020 to 2024
    • Market Size Value (USD Million) & Volume (Tons) Forecast By Market Taxonomy, 2025 to 2035
      • By Country
        • USA
        • Canada
        • Mexico
      • By Material Type
      • By Manufacturing Process
      • By Application
    • Market Attractiveness Analysis
      • By Country
      • By Material Type
      • By Manufacturing Process
      • By Application
    • Key Takeaways
  12. Latin America Market Analysis 2020 to 2024 and Forecast 2025 to 2035, By Country
    • Historical Market Size Value (USD Million) & Volume (Tons) Trend Analysis By Market Taxonomy, 2020 to 2024
    • Market Size Value (USD Million) & Volume (Tons) Forecast By Market Taxonomy, 2025 to 2035
      • By Country
        • Brazil
        • Argentina
        • Rest of Latin America
      • By Material Type
      • By Manufacturing Process
      • By Application
    • Market Attractiveness Analysis
      • By Country
      • By Material Type
      • By Manufacturing Process
      • By Application
    • Key Takeaways
  13. Western Europe Market Analysis 2020 to 2024 and Forecast 2025 to 2035, By Country
    • Historical Market Size Value (USD Million) & Volume (Tons) Trend Analysis By Market Taxonomy, 2020 to 2024
    • Market Size Value (USD Million) & Volume (Tons) Forecast By Market Taxonomy, 2025 to 2035
      • By Country
        • Germany
        • Italy
        • France
        • UK
        • Spain
        • BENELUX
        • Nordics
        • Rest of W. Europe
      • By Material Type
      • By Manufacturing Process
      • By Application
    • Market Attractiveness Analysis
      • By Country
      • By Material Type
      • By Manufacturing Process
      • By Application
    • Key Takeaways
  14. Eastern Europe Market Analysis 2020 to 2024 and Forecast 2025 to 2035, By Country
    • Historical Market Size Value (USD Million) & Volume (Tons) Trend Analysis By Market Taxonomy, 2020 to 2024
    • Market Size Value (USD Million) & Volume (Tons) Forecast By Market Taxonomy, 2025 to 2035
      • By Country
        • Hungary
        • Poland
        • Russia
        • Balkan & Baltics
        • Rest of E.Europe
      • By Material Type
      • By Manufacturing Process
      • By Application
    • Market Attractiveness Analysis
      • By Country
      • By Material Type
      • By Manufacturing Process
      • By Application
    • Key Takeaways
  15. East Asia Market Analysis 2020 to 2024 and Forecast 2025 to 2035, By Country
    • Historical Market Size Value (USD Million) & Volume (Tons) Trend Analysis By Market Taxonomy, 2020 to 2024
    • Market Size Value (USD Million) & Volume (Tons) Forecast By Market Taxonomy, 2025 to 2035
      • By Country
        • China
        • Japan
        • South Korea
      • By Material Type
      • By Manufacturing Process
      • By Application
    • Market Attractiveness Analysis
      • By Country
      • By Material Type
      • By Manufacturing Process
      • By Application
    • Key Takeaways
  16. South Asia & Pacific Market Analysis 2020 to 2024 and Forecast 2025 to 2035, By Country
    • Historical Market Size Value (USD Million) & Volume (Tons) Trend Analysis By Market Taxonomy, 2020 to 2024
    • Market Size Value (USD Million) & Volume (Tons) Forecast By Market Taxonomy, 2025 to 2035
      • By Country
        • India
        • ASEAN
        • Australia & New Zealand
      • By Material Type
      • By Manufacturing Process
      • By Application
    • Market Attractiveness Analysis
      • By Country
      • By Material Type
      • By Manufacturing Process
      • By Application
    • Key Takeaways
  17. Middle East & Africa Market Analysis 2020 to 2024 and Forecast 2025 to 2035, By Country
    • Historical Market Size Value (USD Million) & Volume (Tons) Trend Analysis By Market Taxonomy, 2020 to 2024
    • Market Size Value (USD Million) & Volume (Tons) Forecast By Market Taxonomy, 2025 to 2035
      • By Country
        • GCC Countries
        • Turkiye
        • Northern Africa
        • South Africa
        • Rest of MEA
      • By Material Type
      • By Manufacturing Process
      • By Application
    • Market Attractiveness Analysis
      • By Country
      • By Material Type
      • By Manufacturing Process
      • By Application
    • Key Takeaways
  18. Key Countries Market Analysis
    • USA
      • Pricing Analysis
      • Market Share Analysis, 2024
        • By Material Type
        • By Manufacturing Process
        • By Application
    • Canada
      • Pricing Analysis
      • Market Share Analysis, 2024
        • By Material Type
        • By Manufacturing Process
        • By Application
    • Mexico
      • Pricing Analysis
      • Market Share Analysis, 2024
        • By Material Type
        • By Manufacturing Process
        • By Application
    • Brazil
      • Pricing Analysis
      • Market Share Analysis, 2024
        • By Material Type
        • By Manufacturing Process
        • By Application
    • Argentina
      • Pricing Analysis
      • Market Share Analysis, 2024
        • By Material Type
        • By Manufacturing Process
        • By Application
    • Germany
      • Pricing Analysis
      • Market Share Analysis, 2024
        • By Material Type
        • By Manufacturing Process
        • By Application
    • Italy
      • Pricing Analysis
      • Market Share Analysis, 2024
        • By Material Type
        • By Manufacturing Process
        • By Application
    • France
      • Pricing Analysis
      • Market Share Analysis, 2024
        • By Material Type
        • By Manufacturing Process
        • By Application
    • UK
      • Pricing Analysis
      • Market Share Analysis, 2024
        • By Material Type
        • By Manufacturing Process
        • By Application
    • Spain
      • Pricing Analysis
      • Market Share Analysis, 2024
        • By Material Type
        • By Manufacturing Process
        • By Application
    • BENELUX
      • Pricing Analysis
      • Market Share Analysis, 2024
        • By Material Type
        • By Manufacturing Process
        • By Application
    • Nordics
      • Pricing Analysis
      • Market Share Analysis, 2024
        • By Material Type
        • By Manufacturing Process
        • By Application
    • Russia
      • Pricing Analysis
      • Market Share Analysis, 2024
        • By Material Type
        • By Manufacturing Process
        • By Application
    • Hungary
      • Pricing Analysis
      • Market Share Analysis, 2024
        • By Material Type
        • By Manufacturing Process
        • By Application
    • Poland
      • Pricing Analysis
      • Market Share Analysis, 2024
        • By Material Type
        • By Manufacturing Process
        • By Application
    • Balkan & Baltics
      • Pricing Analysis
      • Market Share Analysis, 2024
        • By Material Type
        • By Manufacturing Process
        • By Application
    • China
      • Pricing Analysis
      • Market Share Analysis, 2024
        • By Material Type
        • By Manufacturing Process
        • By Application
    • Japan
      • Pricing Analysis
      • Market Share Analysis, 2024
        • By Material Type
        • By Manufacturing Process
        • By Application
    • South Korea
      • Pricing Analysis
      • Market Share Analysis, 2024
        • By Material Type
        • By Manufacturing Process
        • By Application
    • India
      • Pricing Analysis
      • Market Share Analysis, 2024
        • By Material Type
        • By Manufacturing Process
        • By Application
    • ASEAN
      • Pricing Analysis
      • Market Share Analysis, 2024
        • By Material Type
        • By Manufacturing Process
        • By Application
    • Australia & New Zealand
      • Pricing Analysis
      • Market Share Analysis, 2024
        • By Material Type
        • By Manufacturing Process
        • By Application
    • GCC Countries
      • Pricing Analysis
      • Market Share Analysis, 2024
        • By Material Type
        • By Manufacturing Process
        • By Application
    • Turkiye
      • Pricing Analysis
      • Market Share Analysis, 2024
        • By Material Type
        • By Manufacturing Process
        • By Application
    • Northern Africa
      • Pricing Analysis
      • Market Share Analysis, 2024
        • By Material Type
        • By Manufacturing Process
        • By Application
    • South Africa
      • Pricing Analysis
      • Market Share Analysis, 2024
        • By Material Type
        • By Manufacturing Process
        • By Application
  19. Market Structure Analysis
    • Competition Dashboard
    • Competition Benchmarking
    • Market Share Analysis of Top Players
      • By Regional
      • By Material Type
      • By Manufacturing Process
      • By Application
  20. Competition Analysis
    • Competition Deep Dive
      • Mott Corporation
        • Overview
        • Product Portfolio
        • Profitability by Market Segments
        • Sales Footprint
        • Strategy Overview
      • Taisei Kogyo Co., Ltd.
        • Overview
        • Product Portfolio
        • Profitability by Market Segments
        • Sales Footprint
        • Strategy Overview
      • Van Borselen
        • Overview
        • Product Portfolio
        • Profitability by Market Segments
        • Sales Footprint
        • Strategy Overview
      • Shengzhen Hengko
        • Overview
        • Product Portfolio
        • Profitability by Market Segments
        • Sales Footprint
        • Strategy Overview
      • Applied Porous Technologies
        • Overview
        • Product Portfolio
        • Profitability by Market Segments
        • Sales Footprint
        • Strategy Overview
      • Jintai Porous
        • Overview
        • Product Portfolio
        • Profitability by Market Segments
        • Sales Footprint
        • Strategy Overview
  21. Assumptions & Acronyms Used
  22. Research Methodology

List of Tables

  • Table 1: Global Market Value (USD Million) Forecast by Region, 2020-2035
  • Table 2: Global Market Volume (Tons) Forecast by Region, 2020-2035
  • Table 3: Global Market Value (USD Million) Forecast by Material Type, 2020-2035
  • Table 4: Global Market Volume (Tons) Forecast by Material Type, 2020-2035
  • Table 5: Global Market Value (USD Million) Forecast by Manufacturing Process, 2020-2035
  • Table 6: Global Market Volume (Tons) Forecast by Manufacturing Process, 2020-2035
  • Table 7: Global Market Value (USD Million) Forecast by Application, 2020-2035
  • Table 8: Global Market Volume (Tons) Forecast by Application, 2020-2035
  • Table 9: North America Market Value (USD Million) Forecast by Country, 2020-2035
  • Table 10: North America Market Volume (Tons) Forecast by Country, 2020-2035
  • Table 11: North America Market Value (USD Million) Forecast by Material Type, 2020-2035
  • Table 12: North America Market Volume (Tons) Forecast by Material Type, 2020-2035
  • Table 13: North America Market Value (USD Million) Forecast by Manufacturing Process, 2020-2035
  • Table 14: North America Market Volume (Tons) Forecast by Manufacturing Process, 2020-2035
  • Table 15: North America Market Value (USD Million) Forecast by Application, 2020-2035
  • Table 16: North America Market Volume (Tons) Forecast by Application, 2020-2035
  • Table 17: Latin America Market Value (USD Million) Forecast by Country, 2020-2035
  • Table 18: Latin America Market Volume (Tons) Forecast by Country, 2020-2035
  • Table 19: Latin America Market Value (USD Million) Forecast by Material Type, 2020-2035
  • Table 20: Latin America Market Volume (Tons) Forecast by Material Type, 2020-2035
  • Table 21: Latin America Market Value (USD Million) Forecast by Manufacturing Process, 2020-2035
  • Table 22: Latin America Market Volume (Tons) Forecast by Manufacturing Process, 2020-2035
  • Table 23: Latin America Market Value (USD Million) Forecast by Application, 2020-2035
  • Table 24: Latin America Market Volume (Tons) Forecast by Application, 2020-2035
  • Table 25: Western Europe Market Value (USD Million) Forecast by Country, 2020-2035
  • Table 26: Western Europe Market Volume (Tons) Forecast by Country, 2020-2035
  • Table 27: Western Europe Market Value (USD Million) Forecast by Material Type, 2020-2035
  • Table 28: Western Europe Market Volume (Tons) Forecast by Material Type, 2020-2035
  • Table 29: Western Europe Market Value (USD Million) Forecast by Manufacturing Process, 2020-2035
  • Table 30: Western Europe Market Volume (Tons) Forecast by Manufacturing Process, 2020-2035
  • Table 31: Western Europe Market Value (USD Million) Forecast by Application, 2020-2035
  • Table 32: Western Europe Market Volume (Tons) Forecast by Application, 2020-2035
  • Table 33: Eastern Europe Market Value (USD Million) Forecast by Country, 2020-2035
  • Table 34: Eastern Europe Market Volume (Tons) Forecast by Country, 2020-2035
  • Table 35: Eastern Europe Market Value (USD Million) Forecast by Material Type, 2020-2035
  • Table 36: Eastern Europe Market Volume (Tons) Forecast by Material Type, 2020-2035
  • Table 37: Eastern Europe Market Value (USD Million) Forecast by Manufacturing Process, 2020-2035
  • Table 38: Eastern Europe Market Volume (Tons) Forecast by Manufacturing Process, 2020-2035
  • Table 39: Eastern Europe Market Value (USD Million) Forecast by Application, 2020-2035
  • Table 40: Eastern Europe Market Volume (Tons) Forecast by Application, 2020-2035
  • Table 41: East Asia Market Value (USD Million) Forecast by Country, 2020-2035
  • Table 42: East Asia Market Volume (Tons) Forecast by Country, 2020-2035
  • Table 43: East Asia Market Value (USD Million) Forecast by Material Type, 2020-2035
  • Table 44: East Asia Market Volume (Tons) Forecast by Material Type, 2020-2035
  • Table 45: East Asia Market Value (USD Million) Forecast by Manufacturing Process, 2020-2035
  • Table 46: East Asia Market Volume (Tons) Forecast by Manufacturing Process, 2020-2035
  • Table 47: East Asia Market Value (USD Million) Forecast by Application, 2020-2035
  • Table 48: East Asia Market Volume (Tons) Forecast by Application, 2020-2035
  • Table 49: South Asia & Pacific Market Value (USD Million) Forecast by Country, 2020-2035
  • Table 50: South Asia & Pacific Market Volume (Tons) Forecast by Country, 2020-2035
  • Table 51: South Asia & Pacific Market Value (USD Million) Forecast by Material Type, 2020-2035
  • Table 52: South Asia & Pacific Market Volume (Tons) Forecast by Material Type, 2020-2035
  • Table 53: South Asia & Pacific Market Value (USD Million) Forecast by Manufacturing Process, 2020-2035
  • Table 54: South Asia & Pacific Market Volume (Tons) Forecast by Manufacturing Process, 2020-2035
  • Table 55: South Asia & Pacific Market Value (USD Million) Forecast by Application, 2020-2035
  • Table 56: South Asia & Pacific Market Volume (Tons) Forecast by Application, 2020-2035
  • Table 57: Middle East & Africa Market Value (USD Million) Forecast by Country, 2020-2035
  • Table 58: Middle East & Africa Market Volume (Tons) Forecast by Country, 2020-2035
  • Table 59: Middle East & Africa Market Value (USD Million) Forecast by Material Type, 2020-2035
  • Table 60: Middle East & Africa Market Volume (Tons) Forecast by Material Type, 2020-2035
  • Table 61: Middle East & Africa Market Value (USD Million) Forecast by Manufacturing Process, 2020-2035
  • Table 62: Middle East & Africa Market Volume (Tons) Forecast by Manufacturing Process, 2020-2035
  • Table 63: Middle East & Africa Market Value (USD Million) Forecast by Application, 2020-2035
  • Table 64: Middle East & Africa Market Volume (Tons) Forecast by Application, 2020-2035

List of Figures

  • Figure 1: Global Market Volume (Tons) Forecast 2020-2035
  • Figure 2: Global Market Pricing Analysis
  • Figure 3: Global Market Value (USD Million) Forecast 2020-2035
  • Figure 4: Global Market Value Share and BPS Analysis by Material Type, 2025 and 2035
  • Figure 5: Global Market Y-o-Y Growth Comparison by Material Type, 2025-2035
  • Figure 6: Global Market Attractiveness Analysis by Material Type
  • Figure 7: Global Market Value Share and BPS Analysis by Manufacturing Process, 2025 and 2035
  • Figure 8: Global Market Y-o-Y Growth Comparison by Manufacturing Process, 2025-2035
  • Figure 9: Global Market Attractiveness Analysis by Manufacturing Process
  • Figure 10: Global Market Value Share and BPS Analysis by Application, 2025 and 2035
  • Figure 11: Global Market Y-o-Y Growth Comparison by Application, 2025-2035
  • Figure 12: Global Market Attractiveness Analysis by Application
  • Figure 13: Global Market Value (USD Million) Share and BPS Analysis by Region, 2025 and 2035
  • Figure 14: Global Market Y-o-Y Growth Comparison by Region, 2025-2035
  • Figure 15: Global Market Attractiveness Analysis by Region
  • Figure 16: North America Market Incremental $ Opportunity, 2025-2035
  • Figure 17: Latin America Market Incremental $ Opportunity, 2025-2035
  • Figure 18: Western Europe Market Incremental $ Opportunity, 2025-2035
  • Figure 19: Eastern Europe Market Incremental $ Opportunity, 2025-2035
  • Figure 20: East Asia Market Incremental $ Opportunity, 2025-2035
  • Figure 21: South Asia & Pacific Market Incremental $ Opportunity, 2025-2035
  • Figure 22: Middle East & Africa Market Incremental $ Opportunity, 2025-2035
  • Figure 23: North America Market Value Share and BPS Analysis by Country, 2025 and 2035
  • Figure 24: North America Market Value Share and BPS Analysis by Material Type, 2025 and 2035
  • Figure 25: North America Market Y-o-Y Growth Comparison by Material Type, 2025-2035
  • Figure 26: North America Market Attractiveness Analysis by Material Type
  • Figure 27: North America Market Value Share and BPS Analysis by Manufacturing Process, 2025 and 2035
  • Figure 28: North America Market Y-o-Y Growth Comparison by Manufacturing Process, 2025-2035
  • Figure 29: North America Market Attractiveness Analysis by Manufacturing Process
  • Figure 30: North America Market Value Share and BPS Analysis by Application, 2025 and 2035
  • Figure 31: North America Market Y-o-Y Growth Comparison by Application, 2025-2035
  • Figure 32: North America Market Attractiveness Analysis by Application
  • Figure 33: Latin America Market Value Share and BPS Analysis by Country, 2025 and 2035
  • Figure 34: Latin America Market Value Share and BPS Analysis by Material Type, 2025 and 2035
  • Figure 35: Latin America Market Y-o-Y Growth Comparison by Material Type, 2025-2035
  • Figure 36: Latin America Market Attractiveness Analysis by Material Type
  • Figure 37: Latin America Market Value Share and BPS Analysis by Manufacturing Process, 2025 and 2035
  • Figure 38: Latin America Market Y-o-Y Growth Comparison by Manufacturing Process, 2025-2035
  • Figure 39: Latin America Market Attractiveness Analysis by Manufacturing Process
  • Figure 40: Latin America Market Value Share and BPS Analysis by Application, 2025 and 2035
  • Figure 41: Latin America Market Y-o-Y Growth Comparison by Application, 2025-2035
  • Figure 42: Latin America Market Attractiveness Analysis by Application
  • Figure 43: Western Europe Market Value Share and BPS Analysis by Country, 2025 and 2035
  • Figure 44: Western Europe Market Value Share and BPS Analysis by Material Type, 2025 and 2035
  • Figure 45: Western Europe Market Y-o-Y Growth Comparison by Material Type, 2025-2035
  • Figure 46: Western Europe Market Attractiveness Analysis by Material Type
  • Figure 47: Western Europe Market Value Share and BPS Analysis by Manufacturing Process, 2025 and 2035
  • Figure 48: Western Europe Market Y-o-Y Growth Comparison by Manufacturing Process, 2025-2035
  • Figure 49: Western Europe Market Attractiveness Analysis by Manufacturing Process
  • Figure 50: Western Europe Market Value Share and BPS Analysis by Application, 2025 and 2035
  • Figure 51: Western Europe Market Y-o-Y Growth Comparison by Application, 2025-2035
  • Figure 52: Western Europe Market Attractiveness Analysis by Application
  • Figure 53: Eastern Europe Market Value Share and BPS Analysis by Country, 2025 and 2035
  • Figure 54: Eastern Europe Market Value Share and BPS Analysis by Material Type, 2025 and 2035
  • Figure 55: Eastern Europe Market Y-o-Y Growth Comparison by Material Type, 2025-2035
  • Figure 56: Eastern Europe Market Attractiveness Analysis by Material Type
  • Figure 57: Eastern Europe Market Value Share and BPS Analysis by Manufacturing Process, 2025 and 2035
  • Figure 58: Eastern Europe Market Y-o-Y Growth Comparison by Manufacturing Process, 2025-2035
  • Figure 59: Eastern Europe Market Attractiveness Analysis by Manufacturing Process
  • Figure 60: Eastern Europe Market Value Share and BPS Analysis by Application, 2025 and 2035
  • Figure 61: Eastern Europe Market Y-o-Y Growth Comparison by Application, 2025-2035
  • Figure 62: Eastern Europe Market Attractiveness Analysis by Application
  • Figure 63: East Asia Market Value Share and BPS Analysis by Country, 2025 and 2035
  • Figure 64: East Asia Market Value Share and BPS Analysis by Material Type, 2025 and 2035
  • Figure 65: East Asia Market Y-o-Y Growth Comparison by Material Type, 2025-2035
  • Figure 66: East Asia Market Attractiveness Analysis by Material Type
  • Figure 67: East Asia Market Value Share and BPS Analysis by Manufacturing Process, 2025 and 2035
  • Figure 68: East Asia Market Y-o-Y Growth Comparison by Manufacturing Process, 2025-2035
  • Figure 69: East Asia Market Attractiveness Analysis by Manufacturing Process
  • Figure 70: East Asia Market Value Share and BPS Analysis by Application, 2025 and 2035
  • Figure 71: East Asia Market Y-o-Y Growth Comparison by Application, 2025-2035
  • Figure 72: East Asia Market Attractiveness Analysis by Application
  • Figure 73: South Asia & Pacific Market Value Share and BPS Analysis by Country, 2025 and 2035
  • Figure 74: South Asia & Pacific Market Value Share and BPS Analysis by Material Type, 2025 and 2035
  • Figure 75: South Asia & Pacific Market Y-o-Y Growth Comparison by Material Type, 2025-2035
  • Figure 76: South Asia & Pacific Market Attractiveness Analysis by Material Type
  • Figure 77: South Asia & Pacific Market Value Share and BPS Analysis by Manufacturing Process, 2025 and 2035
  • Figure 78: South Asia & Pacific Market Y-o-Y Growth Comparison by Manufacturing Process, 2025-2035
  • Figure 79: South Asia & Pacific Market Attractiveness Analysis by Manufacturing Process
  • Figure 80: South Asia & Pacific Market Value Share and BPS Analysis by Application, 2025 and 2035
  • Figure 81: South Asia & Pacific Market Y-o-Y Growth Comparison by Application, 2025-2035
  • Figure 82: South Asia & Pacific Market Attractiveness Analysis by Application
  • Figure 83: Middle East & Africa Market Value Share and BPS Analysis by Country, 2025 and 2035
  • Figure 84: Middle East & Africa Market Value Share and BPS Analysis by Material Type, 2025 and 2035
  • Figure 85: Middle East & Africa Market Y-o-Y Growth Comparison by Material Type, 2025-2035
  • Figure 86: Middle East & Africa Market Attractiveness Analysis by Material Type
  • Figure 87: Middle East & Africa Market Value Share and BPS Analysis by Manufacturing Process, 2025 and 2035
  • Figure 88: Middle East & Africa Market Y-o-Y Growth Comparison by Manufacturing Process, 2025-2035
  • Figure 89: Middle East & Africa Market Attractiveness Analysis by Manufacturing Process
  • Figure 90: Middle East & Africa Market Value Share and BPS Analysis by Application, 2025 and 2035
  • Figure 91: Middle East & Africa Market Y-o-Y Growth Comparison by Application, 2025-2035
  • Figure 92: Middle East & Africa Market Attractiveness Analysis by Application
  • Figure 93: Global Market - Tier Structure Analysis
  • Figure 94: Global Market - Company Share Analysis

Frequently Asked Questions

What is the market size of the porous metal sheet market in 2025?

The global porous metal sheet market is estimated to reach USD 653.4 million in 2025.

What will be the market value of porous metal sheets by 2035?

The market is projected to reach USD 1,159.1 million by 2035.

What is the forecast CAGR for this market during 2025-2035?

The market is projected to grow at a CAGR of 5.5% from 2025 to 2035.

Which material type leads the market in 2025?

Stainless steel leads with a 48% share due to its corrosion resistance and strength.

Which application accounts for the highest market share?

Filtration is the leading application, accounting for 40% of the total market in 2025.

What manufacturing process dominates porous metal sheet production?

Sintered powder sheets represent the dominant manufacturing method, holding a 42% share in 2025.

Which country exhibits the highest growth potential?

China is expected to register the fastest CAGR at 6.8% between 2025 and 2035.

What are the key trends influencing market growth?

Rising demand for advanced filtration systems, lightweight acoustic materials, and biocompatible implants are key growth drivers. Material innovations and miniaturized component design are also shaping market evolution.

Explore Similar Insights

Future Market Insights

Porous Metal Sheet Market