Prefabricated Track Surfaces Market Forecast and Outlook 2025 to 2035

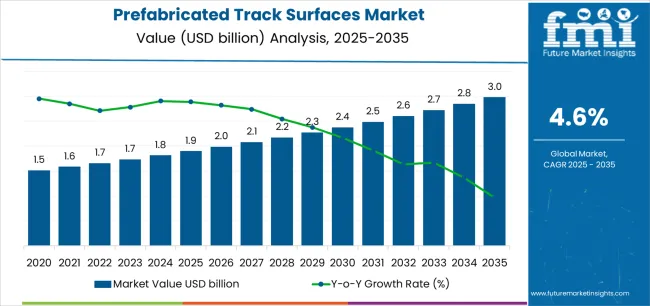
The global prefabricated track surfaces market is valued at USD 1.9 billion in 2025 and is projected to reach USD 3.0 billion by 2035, expanding at a CAGR of 4.6%. Beginning from an estimated USD 1.6 billion in 2021, rolling CAGR analysis indicates consistent mid-term acceleration, supported by the modernization of sports infrastructure and the replacement of aging athletic surfaces with engineered, prefabricated alternatives. The market’s evolution reflects a shift toward controlled production environments that ensure uniform thickness, shock absorption, and surface texture.

Manufacturers are developing modular designs that allow rapid installation with minimal site disruption, meeting growing demand from schools, municipalities, and professional venues. Advancements in polyurethane and rubber compound formulations have improved weather resistance and traction while extending lifecycle durability. Prefabrication also reduces maintenance variability and enhances recyclability, aligning with evolving sustainability requirements for materials. Regional trends show strong adoption in Europe and North America, where regulatory specifications for sports safety and surface certification are firmly established. Asia Pacific continues to gain share through new stadium construction and investment in athletic infrastructure. Raw material pricing, polymer quality control, and logistics coordination remain key determinants of project cost and completion efficiency across the forecast horizon to 2035.
Quick Stats for the Prefabricated Track Surfaces Market

  • Prefabricated Track Surfaces Market Value (2025): USD 1.9 billion
  • Prefabricated Track Surfaces Market Forecast Value (2035): USD 3.0 billion
  • Prefabricated Track Surfaces Market Forecast CAGR (2025 to 2035): 4.6%
  • Leading Type in Prefabricated Track Surfaces Market: Rubber Prefabricated Track Surfaces
  • Key Growth Regions: Europe, North America, and Asia Pacific
  • Top Players: MONDO, epiQ Tracks, REGUPOL, Novotrack, Rekortan, Sansu Sports, Wegi Sports Inc., Jracesports, huadongtrack, Guangzhou Tongxin Sports Industry Group, Foshan Flystep Rubber Sports Floor Manufacturing Co., Ltd, Huantengxiangsu, Shengli Sports, Ecore

Prefabricated Track Surfaces Market Market Value Analysis

Prefabricated Track Surfaces Market Year-over-Year Forecast 2025 to 2035

Between 2025 and 2030, the Prefabricated Track Surfaces Market is projected to expand from USD 1.9 billion to USD 2.4 billion, recording a 26.3% increase and accounting for 46.0% of the decade’s overall growth. This period will be driven by rising investments in sports infrastructure, increasing global participation in athletics, and growing adoption of modular, high-performance track systems. Technological improvements in surface materials, including polyurethane and rubber composites, are enhancing durability, shock absorption, and weather resistance. Manufacturers are focusing on sustainable production processes and eco-friendly formulations to align with evolving construction and environmental standards.

From 2030 to 2035, the market is forecast to grow from USD 2.4 billion to USD 3.0 billion, reflecting a 25.0% increase and contributing 54.0% of the decade’s total expansion. Growth during this phase will be propelled by the modernization of school, community, and professional sports facilities across emerging economies. The integration of smart surface technologies for monitoring wear, traction, and performance will redefine design standards. Strategic partnerships between material developers, sports federations, and urban planners will enhance innovation and accelerate project delivery, positioning prefabricated track surfaces as a sustainable and high-performance solution in global athletic infrastructure development.

Prefabricated Track Surfaces Market Key Takeaways

Metric Value
Market Value (2025) USD 1.9 billion
Market Forecast Value (2035) USD 3.0 billion
Forecast CAGR (2025 to 2035) 4.6%

What Is Driving the Increased Utilization of Prefabricated Track Surfaces in Modern Sports Infrastructure?

The prefabricated track surfaces market is expanding as sports facility operators and urban planners seek durable, low-maintenance athletic surfaces that provide consistent performance and quick installation. Prefabricated systems, typically composed of vulcanized rubber or polyurethane-based materials, offer uniform shock absorption, enhanced traction, and weather resistance, making them suitable for both professional and community-level applications. These surfaces are manufactured in controlled environments and delivered in ready-to-install rolls or panels, reducing on-site variability and construction time.

Rising investment in athletic infrastructure, particularly in schools, stadiums, and municipal recreation projects, drives steady market demand. The increasing global focus on sports participation, health programs, and event readiness further supports adoption. Manufacturers continue to refine polymer composition and bonding techniques to enhance UV stability, surface elasticity, and recyclability, aligning with sustainability requirements and international athletic standards such as those set by World Athletics. The ability to customize color, thickness, and friction properties also appeals to designers seeking performance-specific configurations. Despite higher upfront costs compared to traditional poured-in-place systems, reduced downtime and predictable installation quality improve long-term value. As modernization and renovation of sports venues accelerate, prefabricated track surfaces remain integral to efficient, high-performance athletic infrastructure development worldwide.

How Is the Prefabricated Track Surfaces Market Segmented by Classification, Application, and Region?

The prefabricated track surfaces market is segmented by classification, application, and region. By classification, the market is divided into rubber prefabricated track surfaces, synthetic prefabricated track surfaces, and hybrid prefabricated track surfaces. Based on application, it is categorized into schools, stadiums, parks, and others. Regionally, the market is segmented into North America, Europe, East Asia, South Asia, Latin America, and the Middle East & Africa. These segments define product material composition, installation environments, and usage trends across institutional and recreational infrastructure projects worldwide.
By Classification, Which Segment Leads the Prefabricated Track Surfaces Market?

Prefabricated Track Surfaces Market Analysis By Classification

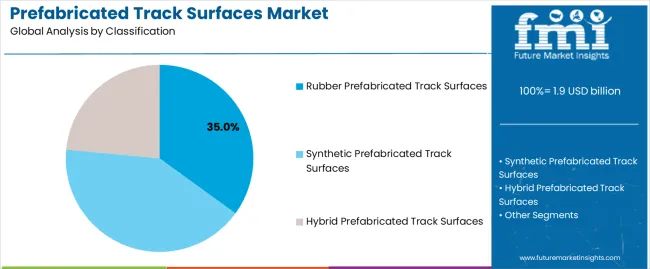
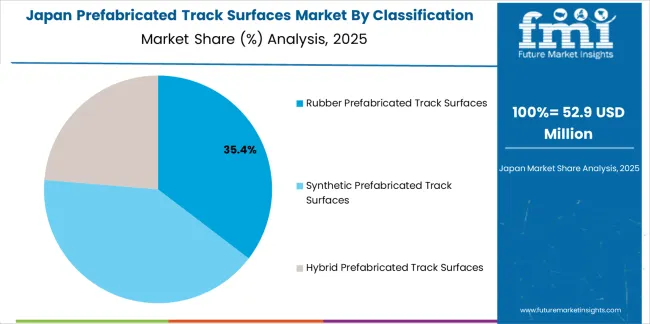
The rubber prefabricated track surfaces segment accounts for approximately 35.0% of the global prefabricated track surfaces market in 2025, making it the leading classification category. This dominance reflects the segment’s extensive use in educational and community sports facilities that prioritize safety, comfort, and cost efficiency. Rubber-based surfaces offer high impact absorption, durability under repetitive use, and stable traction, supporting consistent athletic performance across training and recreational environments.

These surfaces are typically composed of vulcanized rubber sheets pre-manufactured for easy installation and uniformity, reducing site preparation time. Their resilience against temperature variations and UV degradation enhances lifespan, making them suitable for both indoor and outdoor use. The segment benefits from widespread acceptance in public sector projects and school installations, where maintenance simplicity and environmental compliance influence material selection. Manufacturers continue refining production techniques to improve elasticity, surface uniformity, and recyclability of rubber materials. The rubber prefabricated track surface segment remains integral to the market due to its balance of performance, affordability, and durability, sustaining its position as the preferred choice for institutional and community-level athletic infrastructure worldwide.
By Application, Which Segment Dominates Market Demand?

Prefabricated Track Surfaces Market Analysis By Application

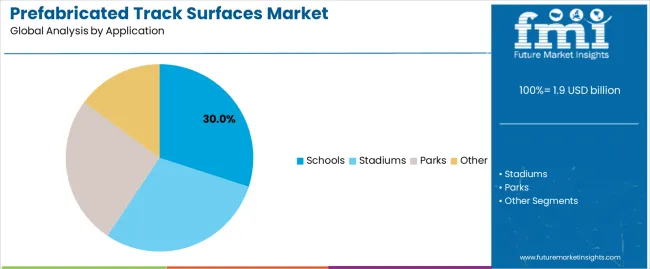
The schools segment represents about 30.0% of the total prefabricated track surfaces market in 2025, establishing it as the largest application category. This leadership is driven by the consistent demand for safe and standardized sports infrastructure within educational institutions. Schools adopt prefabricated track surfaces for their uniform quality, easy installation, and reduced maintenance requirements compared to traditional poured-in-place systems. These features make prefabricated materials suitable for multi-purpose athletic fields and running tracks in primary and secondary education facilities.

Government and private education sectors invest in durable track solutions to support physical education programs and ensure long-term cost efficiency. The segment’s growth is particularly notable in East Asia and Europe, where policy-driven upgrades to school infrastructure promote sustainable and student-safe materials. Rubber and hybrid prefabricated tracks are favored for their anti-slip properties and shock absorption, which minimize injury risk during athletic activities. The schools segment continues to dominate overall market demand as educational institutions increasingly prioritize standardized sports surfaces that meet environmental and safety certifications while offering consistent performance over extended use. Its steady procurement base ensures ongoing contribution to global market growth across both developed and emerging regions.

What are the Key Trends, Drivers, and Restraints in the Prefabricated Track Surfaces Market?

The prefabricated track surfaces market is expanding as sports venue developers and institutional clients increasingly adopt pre-manufactured systems that reduce installation time and improve quality consistency. Prefabricated surfaces often rubber or synthetic modules manufactured off-site provide predictable performance and less disruption during installation compared with traditional poured-in-place tracks. Growth is supported by rising investment in athletic infrastructure, especially in schools and stadiums. At the same time, higher material costs, logistics challenges and competition from alternative surfacing methods remain constraints. A key trend is the shift toward modular, rapid-install systems and expanded global adoption in emerging markets.

What factors are driving growth in the prefabricated track surfaces market?

Growth is largely driven by increasing demand for upgraded athletic and recreational facilities worldwide. Governments, educational institutions and private sports operators are allocating budgets for new and refurbished tracks to meet performance standards and shorten project timelines. Prefabricated track systems enable faster installation, less site labour, and better control of material quality under factory conditions. The emphasis on safety, durability and compliance with international certification standards supports increased uptake across track surface projects in stadiums, schools and public parks.

What restraints are limiting market expansion?

The market is restrained by the relatively high cost of prefabricated modules and the logistics involved in transporting large surface panels to site. Manufacturing such surfaces requires specialised materials, strict quality control and dedicated production facilities, which raise unit cost. In many projects, site-prepared sub-bases and existing infrastructure may not align with prefabricated system requirements, leading to compatibility challenges. Additionally, competition from lower-cost on-site poured systems and local materials may limit adoption in budget-constrained environments or regions with limited import capability.

What key trends are shaping future market development?

One key trend is the evolution of prefab track surfaces toward more modular, adaptable formats with improved installation flexibility and sustainability. Manufacturers are developing roll-out panels or interlocking modules with standard dimensions, making transport, storage and installation more efficient. Digitally aided manufacturing, pre-certified design profiles and enhanced materials (such as higher-grade synthetics with improved wear resistance) are becoming more common. Growth is particularly strong in emerging regions where sports infrastructure investment is accelerating and project timelines favour prefab solutions.
What is the Analysis of the Prefabricated Track Surfaces Market by Key Country?

Prefabricated Track Surfaces Market Cagr Analysis By Country

Country CAGR (%)
China 6.2%
India 5.8%
Germany 5.3%
Brazil 4.8%
USA 4.4%
UK 3.9%
Japan 3.5%

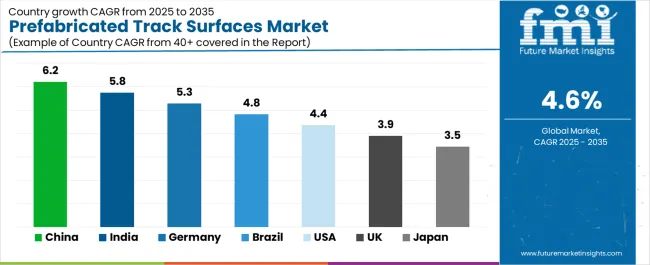
The Prefabricated Track Surfaces Market is growing steadily worldwide, with China leading at a 6.2% CAGR through 2035, supported by large-scale sports infrastructure projects, urban development initiatives, and growing interest in athletic facilities. India follows at 5.8%, fueled by expanding school and public sports programs and government-backed infrastructure spending. Germany records 5.3%, driven by advanced material engineering and high-quality synthetic surface production. Brazil, at 4.8%, benefits from increasing sports participation and facility modernization. The USA posts a 4.4% CAGR, supported by strong institutional and community-level investments, while the UK (3.9%) and Japan (3.5%) maintain stable growth, emphasizing sustainability, durability, and innovation in prefabricated athletic and recreational track surface materials.

The report covers an in-depth analysis of 40+ countries top-performing countries are highlighted below.
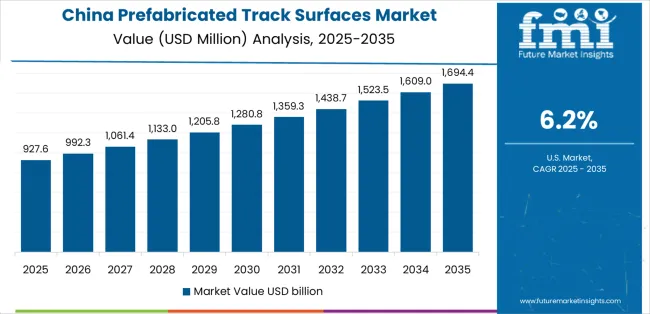
How Is Sports Infrastructure Development Accelerating Market Growth in China?

Prefabricated Track Surfaces Market Country Value Analysis

Revenue from prefabricated track surfaces in China is projected to grow at a CAGR of 6.2% through 2035, supported by rapid expansion in sports facility construction and public fitness infrastructure. Government investment in athletic complexes, schools, and stadiums is driving large-scale installations of prefabricated surfaces. Domestic manufacturers are improving polymer formulations and installation efficiency to meet durability standards. Rising participation in athletics and sports education is sustaining consistent demand for high-performance track materials.

  • Expansion of public sports infrastructure supports large installation projects.
  • Domestic innovation enhances product strength and weather resistance.
  • Growth in school and community sports programs sustains utilization.
  • Government initiatives promote durable surface technology adoption.

Why Is Sports Facility Modernization Supporting Market Expansion in India?

Revenue from prefabricated track surfaces in India is increasing at a CAGR of 5.8%, driven by national sports infrastructure programs and rising interest in athletics. Installation of synthetic and modular tracks across educational institutions and municipal facilities continues to expand. Government initiatives under sports development schemes promote procurement of prefabricated surfaces meeting international standards. Manufacturers are focusing on cost-effective materials and rapid installation techniques suited to diverse climatic conditions.
  • Growth in athletic programs supports track construction projects.
  • Policy-driven investment encourages infrastructure development.
  • Material innovation improves performance and affordability.
  • Expansion in educational and training facilities sustains demand.

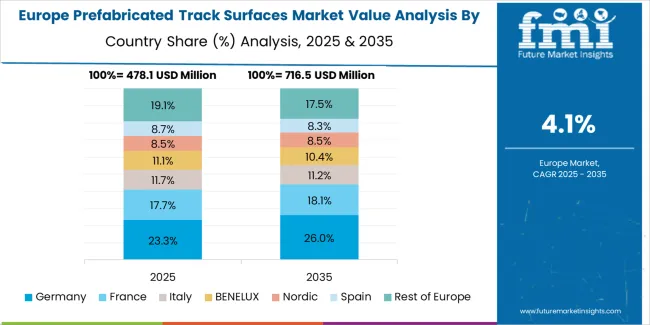
How Does Engineering Precision Sustain Market Competitiveness in Germany?

Prefabricated Track Surfaces Market Europe Country Market Share Analysis, 2025 & 2035

Revenue from prefabricated track surfaces in Germany is advancing at a CAGR of 5.3%, supported by the country’s focus on material engineering and adherence to athletic performance standards. Manufacturers are prioritizing product consistency, shock absorption, and resistance to environmental wear. Sports associations and municipal authorities are investing in facility upgrades to align with global specifications. Research in sustainable surface materials continues to enhance product lifecycle and recyclability.

  • Strong engineering standards ensure high-quality surface production.
  • Facility renovation programs drive replacement demand.
  • Research in sustainable materials supports product innovation.
  • Compliance with global athletic standards maintains competitiveness.

Why Is Urban Development Encouraging Market Growth in Brazil?

Revenue from prefabricated track surfaces in Brazil is projected to grow at a CAGR of 4.8%, supported by urban development projects and increased investment in public sports infrastructure. Demand is rising across municipal athletic fields and recreation centers. Government programs promoting youth sports participation are driving consistent procurement. Partnerships with international surface manufacturers are improving access to certified prefabricated materials.

  • Expansion of urban sports facilities supports installation activity.
  • Public sector investment encourages equipment standardization.
  • Collaboration with international suppliers ensures product quality.
  • Growth in youth and community sports participation sustains demand.

How Do Renovation Programs Sustain Market Expansion in the United States?

Revenue from prefabricated track surfaces in the United States is increasing at a CAGR of 4.4%, supported by renovation of aging athletic infrastructure and steady demand for high-performance sports surfaces. Educational institutions and municipalities are upgrading tracks to improve safety and performance standards. Manufacturers are emphasizing UV resistance, impact durability, and ease of installation. Ongoing investments in collegiate and community athletics continue to support replacement cycles.

  • Renovation of sports facilities drives continuous product demand.
  • Innovation in material technology improves long-term durability.
  • Education and municipal projects sustain market activity.
  • Compliance with performance standards ensures product reliability.

Why Is Facility Standardization Supporting Market Stability in the United Kingdom?

Revenue from prefabricated track surfaces in the United Kingdom is growing at a CAGR of 3.9%, supported by modernization of sports infrastructure and standardization of athletic facility design. Investments in training centers and community stadiums maintain consistent installation demand. Manufacturers are focusing on sustainable materials and modular construction methods to meet environmental objectives. Government-backed programs for youth sports development continue to reinforce utilization.
  • Standardization initiatives promote consistent track surface quality.
  • Investment in community sports centers drives stable demand.
  • Sustainable material use aligns with environmental objectives.
  • Modernization of athletic facilities supports long-term utilization.

How Does Material Innovation Maintain Market Consistency in Japan?

Prefabricated Track Surfaces Market Japan Market Share Analysis By Classification

Revenue from prefabricated track surfaces in Japan is projected to grow at a CAGR of 3.5%, supported by technological precision, infrastructure maintenance, and sports development initiatives. Manufacturers emphasize materials with improved elasticity, drainage performance, and climatic resilience. Demand from schools, universities, and public sports facilities remains steady due to continuous renovation programs. Research in polymer technology supports durability and energy return characteristics.
  • Advanced material engineering enhances surface performance.
  • Facility renovation programs sustain regular replacement cycles.
  • Climatic resilience supports product adoption across varied regions.
  • Continuous R&D in polymers maintains market consistency.

How Competitive Is the Global Prefabricated Track Surfaces Market and What Defines Its Strategic Landscape?

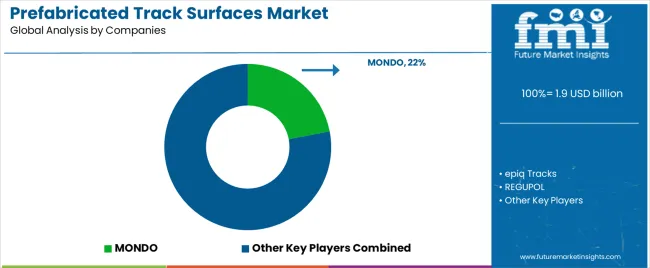
Prefabricated Track Surfaces Market Analysis By Company

The global prefabricated track surfaces market is moderately consolidated, led by established manufacturers of synthetic sports flooring and specialized rubberized surfacing systems. MONDO holds a leading position with an estimated 22% market share, supported by its long-standing presence in athletic infrastructure and extensive deployment across international stadiums and competition venues. The company’s strength lies in polymer engineering, shock absorption optimization, and consistent surface performance under varied climatic conditions. epiQ Tracks and REGUPOL follow as significant competitors, offering polyurethane-based and recycled rubber systems emphasizing durability and compliance with international athletic standards.

Novotrack and Rekortan maintain solid positions through integrated product development and track system customization for school and professional athletics. Sansu Sports, Wegi Sports Inc, and Jracesports provide cost-effective prefabricated solutions targeting regional markets in Asia and the Middle East. huadongtrack, Guangzhou Tongxin Sports Industry Group, and Foshan Flystep Rubber Sports Floor Manufacturing Co., Ltd contribute to large-scale manufacturing output, emphasizing environmental performance and installation efficiency.

Huantengxiangsu, Shengli Sports, and Ecore operate across diverse flooring segments, extending their product reach into sports infrastructure and modular surface applications. Competition across this market is influenced by material formulation, traction consistency, and compliance with World Athletics certification standards. Strategic differentiation increasingly depends on sustainable raw material sourcing, surface recyclability, and installation precision, while long-term advantage is determined by performance longevity and ongoing innovation in prefabricated elastomeric track technology.

Key Players of the Prefabricated Track Surfaces Market

  • MONDO
  • epiq Tracks
  • REGUPOL
  • Novotrack
  • Rekortan
  • Sansu Sports
  • Wegi Sports Inc
  • Jracesports
  • huadongtrack
  • Guangzhou Tongxin Sports Industry Group (tongxin)
  • Foshan Flystep Rubber Sports Floor Manufacturing Co., Ltd
  • Huantengxiangsu
  • Shengli Sports
  • Ecore

Report Scope of the Prefabricated Track Surfaces Market

Items Values
Quantitative Units (2025) USD 1.9 billion
Type (Classification) Rubber Prefabricated Track Surfaces, Synthetic Prefabricated Track Surfaces, Hybrid Prefabricated Track Surfaces
Application Schools, Stadiums, Parks, Others
Regions Covered North America, Europe, East Asia, South Asia, Latin America, Middle East & Africa, Eastern Europe
Countries Covered China, India, USA, Germany, Brazil, UK, Japan, and 40+ countries
Key Companies Profiled MONDO, epiQ Tracks, REGUPOL, Novotrack, Rekortan, Sansu Sports, Wegi Sports Inc, Jracesports, huadongtrack, Guangzhou Tongxin Sports Industry Group, Foshan Flystep, Ecore
Additional Attributes Dollar sales by classification and application; regional adoption trends (notably East Asia and Europe); compliance with World Athletics standards; material formulation (polyurethane, vulcanized rubber), modular installation formats (rolls, panels, interlocking modules); lifecycle cost analysis, installation time savings, logistics/sub-base compatibility issues, sustainability and recyclability initiatives, and warranty/maintenance frameworks.

Prefabricated Track Surfaces Market by Segments

Classification:

  • Rubber Prefabricated Track Surfaces
  • Synthetic Prefabricated Track Surfaces
  • Hybrid Prefabricated Track Surfaces

Application:

  • Schools
  • Stadium
  • Park
  • Other

Region:

  • East Asia
    • China
    • Japan
    • South Korea
    • Taiwan
    • Rest of East Asia
  • Europe
    • Germany
    • UK
    • France
    • Italy
    • Spain
    • Switzerland
    • Nordic
    • BENELUX
    • Rest of Europe
  • North America
    • USA
    • Canada
    • Mexico
  • South Asia
    • India
    • Pakistan
    • Bangladesh
    • Rest of South Asia
  • Latin America
    • Brazil
    • Argentina
    • Chile
    • Rest of Latin America
  • Middle East & Africa
    • Kingdom of Saudi Arabia
    • Other GCC Countries
    • Turkey
    • South Africa
    • Other African Union
    • Rest of Middle East & Africa
  • Eastern Europe
    • Russia
    • Poland
    • Czech Republic
    • Rest of Eastern Europe

Frequently Asked Questions

How big is the prefabricated track surfaces market in 2025?

The global prefabricated track surfaces market is estimated to be valued at USD 1.9 billion in 2025.

What will be the size of prefabricated track surfaces market in 2035?

The market size for the prefabricated track surfaces market is projected to reach USD 3.0 billion by 2035.

How much will be the prefabricated track surfaces market growth between 2025 and 2035?

The prefabricated track surfaces market is expected to grow at a 4.6% CAGR between 2025 and 2035.

What are the key product types in the prefabricated track surfaces market?

The key product types in prefabricated track surfaces market are rubber prefabricated track surfaces, synthetic prefabricated track surfaces and hybrid prefabricated track surfaces.

Which application segment to contribute significant share in the prefabricated track surfaces market in 2025?

In terms of application, schools segment to command 30.0% share in the prefabricated track surfaces market in 2025.

Table of Content

  1. Executive Summary
    • Global Market Outlook
    • Demand to side Trends
    • Supply to side Trends
    • Technology Roadmap Analysis
    • Analysis and Recommendations
  2. Market Overview
    • Market Coverage / Taxonomy
    • Market Definition / Scope / Limitations
  3. Market Background
    • Market Dynamics
      • Drivers
      • Restraints
      • Opportunity
      • Trends
    • Scenario Forecast
      • Demand in Optimistic Scenario
      • Demand in Likely Scenario
      • Demand in Conservative Scenario
    • Opportunity Map Analysis
    • Product Life Cycle Analysis
    • Supply Chain Analysis
    • Investment Feasibility Matrix
    • Value Chain Analysis
    • PESTLE and Porter’s Analysis
    • Regulatory Landscape
    • Regional Parent Market Outlook
    • Production and Consumption Statistics
    • Import and Export Statistics
  4. Global Market Analysis 2020 to 2024 and Forecast, 2025 to 2035
    • Historical Market Size Value (USD Million) Analysis, 2020 to 2024
    • Current and Future Market Size Value (USD Million) Projections, 2025 to 2035
      • Y to o to Y Growth Trend Analysis
      • Absolute $ Opportunity Analysis
  5. Global Market Pricing Analysis 2020 to 2024 and Forecast 2025 to 2035
  6. Global Market Analysis 2020 to 2024 and Forecast 2025 to 2035, By Classification
    • Introduction / Key Findings
    • Historical Market Size Value (USD Million) Analysis By Classification , 2020 to 2024
    • Current and Future Market Size Value (USD Million) Analysis and Forecast By Classification , 2025 to 2035
      • Rubber Prefabricated Track Surfaces
      • Synthetic Prefabricated Track Surfaces
      • Hybrid Prefabricated Track Surfaces
    • Y to o to Y Growth Trend Analysis By Classification , 2020 to 2024
    • Absolute $ Opportunity Analysis By Classification , 2025 to 2035
  7. Global Market Analysis 2020 to 2024 and Forecast 2025 to 2035, By Application
    • Introduction / Key Findings
    • Historical Market Size Value (USD Million) Analysis By Application, 2020 to 2024
    • Current and Future Market Size Value (USD Million) Analysis and Forecast By Application, 2025 to 2035
      • Schools
      • Stadiums
      • Parks
      • Other
    • Y to o to Y Growth Trend Analysis By Application, 2020 to 2024
    • Absolute $ Opportunity Analysis By Application, 2025 to 2035
  8. Global Market Analysis 2020 to 2024 and Forecast 2025 to 2035, By Region
    • Introduction
    • Historical Market Size Value (USD Million) Analysis By Region, 2020 to 2024
    • Current Market Size Value (USD Million) Analysis and Forecast By Region, 2025 to 2035
      • North America
      • Latin America
      • Western Europe
      • Eastern Europe
      • East Asia
      • South Asia and Pacific
      • Middle East & Africa
    • Market Attractiveness Analysis By Region
  9. North America Market Analysis 2020 to 2024 and Forecast 2025 to 2035, By Country
    • Historical Market Size Value (USD Million) Trend Analysis By Market Taxonomy, 2020 to 2024
    • Market Size Value (USD Million) Forecast By Market Taxonomy, 2025 to 2035
      • By Country
        • USA
        • Canada
        • Mexico
      • By Classification
      • By Application
    • Market Attractiveness Analysis
      • By Country
      • By Classification
      • By Application
    • Key Takeaways
  10. Latin America Market Analysis 2020 to 2024 and Forecast 2025 to 2035, By Country
    • Historical Market Size Value (USD Million) Trend Analysis By Market Taxonomy, 2020 to 2024
    • Market Size Value (USD Million) Forecast By Market Taxonomy, 2025 to 2035
      • By Country
        • Brazil
        • Chile
        • Rest of Latin America
      • By Classification
      • By Application
    • Market Attractiveness Analysis
      • By Country
      • By Classification
      • By Application
    • Key Takeaways
  11. Western Europe Market Analysis 2020 to 2024 and Forecast 2025 to 2035, By Country
    • Historical Market Size Value (USD Million) Trend Analysis By Market Taxonomy, 2020 to 2024
    • Market Size Value (USD Million) Forecast By Market Taxonomy, 2025 to 2035
      • By Country
        • Germany
        • UK
        • Italy
        • Spain
        • France
        • Nordic
        • BENELUX
        • Rest of Western Europe
      • By Classification
      • By Application
    • Market Attractiveness Analysis
      • By Country
      • By Classification
      • By Application
    • Key Takeaways
  12. Eastern Europe Market Analysis 2020 to 2024 and Forecast 2025 to 2035, By Country
    • Historical Market Size Value (USD Million) Trend Analysis By Market Taxonomy, 2020 to 2024
    • Market Size Value (USD Million) Forecast By Market Taxonomy, 2025 to 2035
      • By Country
        • Russia
        • Poland
        • Hungary
        • Balkan & Baltic
        • Rest of Eastern Europe
      • By Classification
      • By Application
    • Market Attractiveness Analysis
      • By Country
      • By Classification
      • By Application
    • Key Takeaways
  13. East Asia Market Analysis 2020 to 2024 and Forecast 2025 to 2035, By Country
    • Historical Market Size Value (USD Million) Trend Analysis By Market Taxonomy, 2020 to 2024
    • Market Size Value (USD Million) Forecast By Market Taxonomy, 2025 to 2035
      • By Country
        • China
        • Japan
        • South Korea
      • By Classification
      • By Application
    • Market Attractiveness Analysis
      • By Country
      • By Classification
      • By Application
    • Key Takeaways
  14. South Asia and Pacific Market Analysis 2020 to 2024 and Forecast 2025 to 2035, By Country
    • Historical Market Size Value (USD Million) Trend Analysis By Market Taxonomy, 2020 to 2024
    • Market Size Value (USD Million) Forecast By Market Taxonomy, 2025 to 2035
      • By Country
        • India
        • ASEAN
        • Australia & New Zealand
        • Rest of South Asia and Pacific
      • By Classification
      • By Application
    • Market Attractiveness Analysis
      • By Country
      • By Classification
      • By Application
    • Key Takeaways
  15. Middle East & Africa Market Analysis 2020 to 2024 and Forecast 2025 to 2035, By Country
    • Historical Market Size Value (USD Million) Trend Analysis By Market Taxonomy, 2020 to 2024
    • Market Size Value (USD Million) Forecast By Market Taxonomy, 2025 to 2035
      • By Country
        • Kingdom of Saudi Arabia
        • Other GCC Countries
        • Turkiye
        • South Africa
        • Other African Union
        • Rest of Middle East & Africa
      • By Classification
      • By Application
    • Market Attractiveness Analysis
      • By Country
      • By Classification
      • By Application
    • Key Takeaways
  16. Key Countries Market Analysis
    • USA
      • Pricing Analysis
      • Market Share Analysis, 2024
        • By Classification
        • By Application
    • Canada
      • Pricing Analysis
      • Market Share Analysis, 2024
        • By Classification
        • By Application
    • Mexico
      • Pricing Analysis
      • Market Share Analysis, 2024
        • By Classification
        • By Application
    • Brazil
      • Pricing Analysis
      • Market Share Analysis, 2024
        • By Classification
        • By Application
    • Chile
      • Pricing Analysis
      • Market Share Analysis, 2024
        • By Classification
        • By Application
    • Germany
      • Pricing Analysis
      • Market Share Analysis, 2024
        • By Classification
        • By Application
    • UK
      • Pricing Analysis
      • Market Share Analysis, 2024
        • By Classification
        • By Application
    • Italy
      • Pricing Analysis
      • Market Share Analysis, 2024
        • By Classification
        • By Application
    • Spain
      • Pricing Analysis
      • Market Share Analysis, 2024
        • By Classification
        • By Application
    • France
      • Pricing Analysis
      • Market Share Analysis, 2024
        • By Classification
        • By Application
    • India
      • Pricing Analysis
      • Market Share Analysis, 2024
        • By Classification
        • By Application
    • ASEAN
      • Pricing Analysis
      • Market Share Analysis, 2024
        • By Classification
        • By Application
    • Australia & New Zealand
      • Pricing Analysis
      • Market Share Analysis, 2024
        • By Classification
        • By Application
    • China
      • Pricing Analysis
      • Market Share Analysis, 2024
        • By Classification
        • By Application
    • Japan
      • Pricing Analysis
      • Market Share Analysis, 2024
        • By Classification
        • By Application
    • South Korea
      • Pricing Analysis
      • Market Share Analysis, 2024
        • By Classification
        • By Application
    • Russia
      • Pricing Analysis
      • Market Share Analysis, 2024
        • By Classification
        • By Application
    • Poland
      • Pricing Analysis
      • Market Share Analysis, 2024
        • By Classification
        • By Application
    • Hungary
      • Pricing Analysis
      • Market Share Analysis, 2024
        • By Classification
        • By Application
    • Kingdom of Saudi Arabia
      • Pricing Analysis
      • Market Share Analysis, 2024
        • By Classification
        • By Application
    • Turkiye
      • Pricing Analysis
      • Market Share Analysis, 2024
        • By Classification
        • By Application
    • South Africa
      • Pricing Analysis
      • Market Share Analysis, 2024
        • By Classification
        • By Application
  17. Market Structure Analysis
    • Competition Dashboard
    • Competition Benchmarking
    • Market Share Analysis of Top Players
      • By Regional
      • By Classification
      • By Application
  18. Competition Analysis
    • Competition Deep Dive
      • MONDO
        • Overview
        • Product Portfolio
        • Profitability by Market Segments (Product/Age /Sales Channel/Region)
        • Sales Footprint
        • Strategy Overview
          • Marketing Strategy
          • Product Strategy
          • Channel Strategy
      • epiq Tracks
      • REGUPOL
      • Novotrack
      • Rekortan
      • Sansu Sports
      • Wegi Sports Inc
      • Jracesports
      • huadongtrack
      • Guangzhou Tongxin Sports Industry Group (tongxin)
      • Foshan Flystep Rubber Sports Floor Manufacturing Co.,Ltd
      • Huantengxiangsu
      • Shengli Sports
      • Ecore
  19. Assumptions & Acronyms Used
  20. Research Methodology

List of Tables

  • Table 1: Global Market Value (USD Million) Forecast by Region, 2020 to 2035
  • Table 2: Global Market Value (USD Million) Forecast by Classification , 2020 to 2035
  • Table 3: Global Market Value (USD Million) Forecast by Application, 2020 to 2035
  • Table 4: North America Market Value (USD Million) Forecast by Country, 2020 to 2035
  • Table 5: North America Market Value (USD Million) Forecast by Classification , 2020 to 2035
  • Table 6: North America Market Value (USD Million) Forecast by Application, 2020 to 2035
  • Table 7: Latin America Market Value (USD Million) Forecast by Country, 2020 to 2035
  • Table 8: Latin America Market Value (USD Million) Forecast by Classification , 2020 to 2035
  • Table 9: Latin America Market Value (USD Million) Forecast by Application, 2020 to 2035
  • Table 10: Western Europe Market Value (USD Million) Forecast by Country, 2020 to 2035
  • Table 11: Western Europe Market Value (USD Million) Forecast by Classification , 2020 to 2035
  • Table 12: Western Europe Market Value (USD Million) Forecast by Application, 2020 to 2035
  • Table 13: Eastern Europe Market Value (USD Million) Forecast by Country, 2020 to 2035
  • Table 14: Eastern Europe Market Value (USD Million) Forecast by Classification , 2020 to 2035
  • Table 15: Eastern Europe Market Value (USD Million) Forecast by Application, 2020 to 2035
  • Table 16: East Asia Market Value (USD Million) Forecast by Country, 2020 to 2035
  • Table 17: East Asia Market Value (USD Million) Forecast by Classification , 2020 to 2035
  • Table 18: East Asia Market Value (USD Million) Forecast by Application, 2020 to 2035
  • Table 19: South Asia and Pacific Market Value (USD Million) Forecast by Country, 2020 to 2035
  • Table 20: South Asia and Pacific Market Value (USD Million) Forecast by Classification , 2020 to 2035
  • Table 21: South Asia and Pacific Market Value (USD Million) Forecast by Application, 2020 to 2035
  • Table 22: Middle East & Africa Market Value (USD Million) Forecast by Country, 2020 to 2035
  • Table 23: Middle East & Africa Market Value (USD Million) Forecast by Classification , 2020 to 2035
  • Table 24: Middle East & Africa Market Value (USD Million) Forecast by Application, 2020 to 2035

List of Figures

  • Figure 1: Global Market Pricing Analysis
  • Figure 2: Global Market Value (USD Million) Forecast 2020-2035
  • Figure 3: Global Market Value Share and BPS Analysis by Classification , 2025 and 2035
  • Figure 4: Global Market Y-o-Y Growth Comparison by Classification , 2025-2035
  • Figure 5: Global Market Attractiveness Analysis by Classification
  • Figure 6: Global Market Value Share and BPS Analysis by Application, 2025 and 2035
  • Figure 7: Global Market Y-o-Y Growth Comparison by Application, 2025-2035
  • Figure 8: Global Market Attractiveness Analysis by Application
  • Figure 9: Global Market Value (USD Million) Share and BPS Analysis by Region, 2025 and 2035
  • Figure 10: Global Market Y-o-Y Growth Comparison by Region, 2025-2035
  • Figure 11: Global Market Attractiveness Analysis by Region
  • Figure 12: North America Market Incremental Dollar Opportunity, 2025-2035
  • Figure 13: Latin America Market Incremental Dollar Opportunity, 2025-2035
  • Figure 14: Western Europe Market Incremental Dollar Opportunity, 2025-2035
  • Figure 15: Eastern Europe Market Incremental Dollar Opportunity, 2025-2035
  • Figure 16: East Asia Market Incremental Dollar Opportunity, 2025-2035
  • Figure 17: South Asia and Pacific Market Incremental Dollar Opportunity, 2025-2035
  • Figure 18: Middle East & Africa Market Incremental Dollar Opportunity, 2025-2035
  • Figure 19: North America Market Value Share and BPS Analysis by Country, 2025 and 2035
  • Figure 20: North America Market Value Share and BPS Analysis by Classification , 2025 and 2035
  • Figure 21: North America Market Y-o-Y Growth Comparison by Classification , 2025-2035
  • Figure 22: North America Market Attractiveness Analysis by Classification
  • Figure 23: North America Market Value Share and BPS Analysis by Application, 2025 and 2035
  • Figure 24: North America Market Y-o-Y Growth Comparison by Application, 2025-2035
  • Figure 25: North America Market Attractiveness Analysis by Application
  • Figure 26: Latin America Market Value Share and BPS Analysis by Country, 2025 and 2035
  • Figure 27: Latin America Market Value Share and BPS Analysis by Classification , 2025 and 2035
  • Figure 28: Latin America Market Y-o-Y Growth Comparison by Classification , 2025-2035
  • Figure 29: Latin America Market Attractiveness Analysis by Classification
  • Figure 30: Latin America Market Value Share and BPS Analysis by Application, 2025 and 2035
  • Figure 31: Latin America Market Y-o-Y Growth Comparison by Application, 2025-2035
  • Figure 32: Latin America Market Attractiveness Analysis by Application
  • Figure 33: Western Europe Market Value Share and BPS Analysis by Country, 2025 and 2035
  • Figure 34: Western Europe Market Value Share and BPS Analysis by Classification , 2025 and 2035
  • Figure 35: Western Europe Market Y-o-Y Growth Comparison by Classification , 2025-2035
  • Figure 36: Western Europe Market Attractiveness Analysis by Classification
  • Figure 37: Western Europe Market Value Share and BPS Analysis by Application, 2025 and 2035
  • Figure 38: Western Europe Market Y-o-Y Growth Comparison by Application, 2025-2035
  • Figure 39: Western Europe Market Attractiveness Analysis by Application
  • Figure 40: Eastern Europe Market Value Share and BPS Analysis by Country, 2025 and 2035
  • Figure 41: Eastern Europe Market Value Share and BPS Analysis by Classification , 2025 and 2035
  • Figure 42: Eastern Europe Market Y-o-Y Growth Comparison by Classification , 2025-2035
  • Figure 43: Eastern Europe Market Attractiveness Analysis by Classification
  • Figure 44: Eastern Europe Market Value Share and BPS Analysis by Application, 2025 and 2035
  • Figure 45: Eastern Europe Market Y-o-Y Growth Comparison by Application, 2025-2035
  • Figure 46: Eastern Europe Market Attractiveness Analysis by Application
  • Figure 47: East Asia Market Value Share and BPS Analysis by Country, 2025 and 2035
  • Figure 48: East Asia Market Value Share and BPS Analysis by Classification , 2025 and 2035
  • Figure 49: East Asia Market Y-o-Y Growth Comparison by Classification , 2025-2035
  • Figure 50: East Asia Market Attractiveness Analysis by Classification
  • Figure 51: East Asia Market Value Share and BPS Analysis by Application, 2025 and 2035
  • Figure 52: East Asia Market Y-o-Y Growth Comparison by Application, 2025-2035
  • Figure 53: East Asia Market Attractiveness Analysis by Application
  • Figure 54: South Asia and Pacific Market Value Share and BPS Analysis by Country, 2025 and 2035
  • Figure 55: South Asia and Pacific Market Value Share and BPS Analysis by Classification , 2025 and 2035
  • Figure 56: South Asia and Pacific Market Y-o-Y Growth Comparison by Classification , 2025-2035
  • Figure 57: South Asia and Pacific Market Attractiveness Analysis by Classification
  • Figure 58: South Asia and Pacific Market Value Share and BPS Analysis by Application, 2025 and 2035
  • Figure 59: South Asia and Pacific Market Y-o-Y Growth Comparison by Application, 2025-2035
  • Figure 60: South Asia and Pacific Market Attractiveness Analysis by Application
  • Figure 61: Middle East & Africa Market Value Share and BPS Analysis by Country, 2025 and 2035
  • Figure 62: Middle East & Africa Market Value Share and BPS Analysis by Classification , 2025 and 2035
  • Figure 63: Middle East & Africa Market Y-o-Y Growth Comparison by Classification , 2025-2035
  • Figure 64: Middle East & Africa Market Attractiveness Analysis by Classification
  • Figure 65: Middle East & Africa Market Value Share and BPS Analysis by Application, 2025 and 2035
  • Figure 66: Middle East & Africa Market Y-o-Y Growth Comparison by Application, 2025-2035
  • Figure 67: Middle East & Africa Market Attractiveness Analysis by Application
  • Figure 68: Global Market - Tier Structure Analysis
  • Figure 69: Global Market - Company Share Analysis
Dashboard
Dashboard
Dashboard
Dashboard
Dashboard
Dashboard

Our Research Products

Full Research Suite

The "Full Research Suite" delivers actionable market intel, deep dives on markets or technologies, so clients act faster, cut risk, and unlock growth.

Competitor Leaderboard Report

The Leaderboard benchmarks and ranks top vendors, classifying them as Established Leaders, Leading Challengers, or Disruptors & Challengers.

Future Leaders Index

Locates where complements amplify value and substitutes erode it, forecasting net impact by horizon

Market Data & Forecasts

We deliver granular, decision-grade intel: market sizing, 5-year forecasts, pricing, adoption, usage, revenue, and operational KPIs—plus competitor tracking, regulation, and value chains—across 60 countries broadly.

Market Focus Report

Spot the shifts before they hit your P&L. We track inflection points, adoption curves, pricing moves, and ecosystem plays to show where demand is heading, why it is changing, and what to do next across high-growth markets and disruptive tech

Survey Report

Real-time reads of user behavior. We track shifting priorities, perceptions of today’s and next-gen services, and provider experience, then pace how fast tech moves from trial to adoption, blending buyer, consumer, and channel inputs with social signals (#WhySwitch, #UX).

Bespoke Reports

Partner with our analyst team to build a custom report designed around your business priorities. From analysing market trends to assessing competitors or crafting bespoke datasets, we tailor insights to your needs.

Supplier Intelligence

Discovery & Profiling

Capacity & Footprint

Performance & Risk

Compliance & Governance

Commercial Readiness

Who Supplies Whom

Scorecards & Shortlists

Playbooks & Docs

Category Intelligence

Definition & Scope

Demand & Use Cases

Cost Drivers

Market Structure

Supply Chain Map

Trade & Policy

Operating Norms

Deliverables

Buyer Intelligence

Account Basics

Spend & Scope

Procurement Model

Vendor Requirements

Terms & Policies

Entry Strategy

Pain Points & Triggers

Outputs

Pricing Analysis

Benchmarks

Trends

Should-Cost

Indexation

Landed Cost

Commercial Terms

Deliverables

Brand Analysis

Positioning & Value Prop

Share & Presence

Customer Evidence

Go-to-Market

Digital & Reputation

Compliance & Trust

KPIs & Gaps

Outputs

Full Research Suite comprises of:

Market outlook & trends analysis

Market outlook & trends analysis

Interviews & case studies

Interviews & case studies

Strategic recommendations

Strategic recommendations

Vendor profiles & capabilities analysis

Vendor profiles & capabilities analysis

5-year forecasts

5-year forecasts

8 regions and 60+ country-level data splits

8 regions and 60+ country-level data splits

Market segment data splits

Market segment data splits

12 months of continuous data updates

12 months of continuous data updates

DELIVERED AS:

PDF EXCEL ONLINE

Full Research Suite


$5000

$7500

$10000

Buy Report Now
Similar Industry Reports

Similar Industry Reports

Prefabricated Composite Sandwich Panels Market

Prefabricated Composite Sandwich Panels Market Size and Share Forecast Outlook 2025 to 2035

Prefabricated Bathroom Pods Market

Prefabricated Bathroom Pods Market Size and Share Forecast Outlook 2025 to 2035

Prefabricated Building System Market

Prefabricated Building System Market Growth - Trends & Forecast 2025 to 2035

Modular & Prefabricated Construction Market

Modular & Prefabricated Construction Market Size and Share Forecast Outlook 2025 to 2035

Track Geometry Measurement System Market

Track Geometry Measurement System Market Size and Share Forecast Outlook 2025 to 2035

Track and Trace Solutions Market

Track and Trace Solutions Market Trends - Growth & Forecast 2025 to 2035

Track And Trace Packaging Market

Track and Trace Packaging Market Report – Trends & Innovations 2025-2035

Track And Trace Packaging Market Share Analysis

Market Share Breakdown of Track And Trace Packaging Manufacturers

Track Laying Equipment Market

Track Laying Equipment Market

Track Mounted Gangway Market

Track Mounted Gangway Market

Eye Tracking System Market

Eye Tracking System Market Forecast and Outlook 2025 to 2035

GPS Tracker Market
GPS Tracker Market

GPS Tracker Market Growth – Trends & Forecast 2024-2034

Eye Tracking Solutions Market

Eye Tracking Solutions Market

Mini Track Machinery Market

Mini Track Machinery Market Size and Share Forecast Outlook 2025 to 2035

Solar Tracking Module Market

Solar Tracking Module Market Size and Share Forecast Outlook 2025 to 2035

Sleep Tracking and Optimization Products Market

Sleep Tracking and Optimization Products Market Size and Share Forecast Outlook 2025 to 2035

Solar Tracker for Power Generation Market

Solar Tracker for Power Generation Market Size and Share Forecast Outlook 2025 to 2035

Laser Trackers Market

Laser Trackers Market - Growth, Demand & Forecast 2025 to 2035

Solar Trackers Market

Solar Trackers Market Trends & Forecast 2025 to 2035

Tumor Tracking Systems Market

Tumor Tracking Systems Market

Future Market Insights

Prefabricated Track Surfaces Market

Chat With MaRIA

Chat With

MaRIA

Hi There, I am MaRIA, Your Market Research Intelligence Assistant. How may I help you?