Recyclability Certified Labels and Adhesives Market Size and Share Forecast Outlook 2025 to 2035

The recyclability certified labels and adhesives market is expected to grow from USD 1.3 billion in 2025 to USD 2.6 billion by 2035, resulting in a total increase of USD 1.3 billion over the forecast decade. This represents a 100.0% total expansion, with the market advancing at a compound annual growth rate (CAGR) of 7.2%. Over ten years, the market grows by a 2.0 multiple.
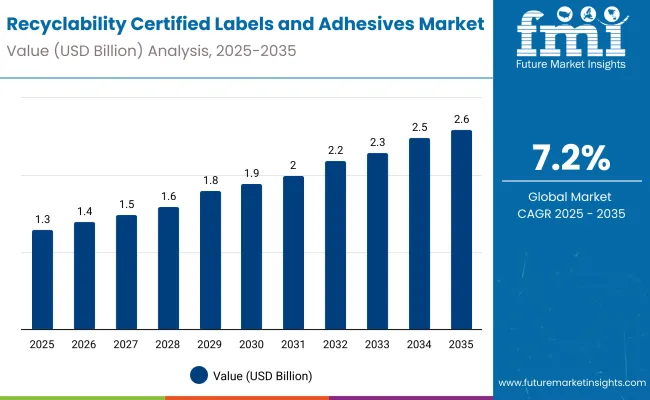
Quick Stats for Recyclability Certified Labels and Adhesives Market

  • Market Value (2025): USD 1.3 billion
  • Market Forecast Value (2035): USD 2.6 billion
  • Market Forecast CAGR: 7.2%
  • Leading Segment in 2025: Water-based adhesives (42.3%)
  • Key Growth Regions: Asia-Pacific (China is the fastest-growing market with 7.9% CAGR)
  • Top Key Players: UPM Raflatac, BASF, Dow, Bostik, Derksen Co., Henkel, Avery Dennison / Sappi, Progressive Label, Penmar Industries, August Faller GmbH & Co. KG

Recyclability Certified Labels And Adhesives Market

Metric Value
Industry Size (2025E) USD 1.3 billion
Industry Value (2035F) USD 2.6 billion
CAGR (2025 to 2035) 7.2%

In the first five years (2025-2030), the market progresses from USD 1.3 billion to USD 1.8 billion, contributing USD 0.5 billion, or 38.5% of total decade growth. This phase is shaped by early adoption in food, beverage, and logistics sectors, where compliance with recycling standards is prioritized. Demand is reinforced by increasing use of paper-based and bio-based adhesives.

In the second half (2030-2035), the market grows from USD 1.8 billion to USD 2.6 billion, adding USD 0.8 billion, or 61.5% of the total growth. This acceleration is supported by advancements in water-based adhesives, compostable labels, and certification programs promoting circular economy goals. Expansion across e-commerce and personal care industries further strengthens demand, making recyclable labeling integral to sustainable packaging practices.

From 2020 to 2024, the recyclability certified labels and adhesives market expanded from USD 1.0 billion to USD 1.2 billion, supported by stricter recycling mandates and brand commitments to circular packaging. Nearly 70% of revenues came from major label and adhesive suppliers offering solutions compatible with PET, PE, and paper recycling streams. Leaders such as Avery Dennison, UPM Raflatac, and HERMA emphasized wash-off adhesives, compostable substrates, and certification compliance. Differentiation centered on recyclability performance, print durability, and material compatibility, while smart labeling features remained secondary. Service-driven offerings such as recyclability audits contributed less than 15% of revenue, with manufacturers favoring direct adoption of certified label solutions.

By 2035, the recyclability certified labels and adhesives market will reach USD 2.6 billion, growing at a CAGR of 7.20%, with sustainable label-adhesive systems representing more than 40% of value. Competitive intensity will rise as providers launch bio-based adhesives, solvent-free coatings, and IoT-enabled recyclability tracking. Established players are pivoting to hybrid models that combine physical label solutions with compliance-driven verification platforms. Emerging firms such as CCL Industries, Sappi, and Mondi are gaining traction with recyclable formats, modular label designs, and advanced adhesive technologies, aligning with global sustainability mandates and brand-owner requirements for packaging circularity.

Why is the Recyclability Certified Labels and Adhesives Market growing?

The rising demand for sustainable packaging solutions is driving growth in the recyclability certified labels and adhesives market. These products ensure that packaging materials remain fully recyclable without contamination, supporting circular economy initiatives. Increasing regulatory pressures and brand commitments to eco-friendly practices are accelerating adoption across food, beverage, healthcare, and logistics sectors.

Labels and adhesives developed with water-based, compostable, and bio-based formulations are gaining popularity for their compatibility with recycling streams. Pressure-sensitive, shrink sleeve, and in-mold formats enhance versatility across applications. Their role in improving brand transparency, reducing environmental impact, and aligning with global sustainability standards is further reinforcing strong market expansion.

Segmental Analysis

The market is segmented by material type, adhesive type, label format, end-use industry, and region. Material type includes paper-based labels, polyethylene (PE) labels, polypropylene (PP) labels, polyethylene terephthalate (PET) labels, and compostable/bio-based labels, supporting recyclable and sustainable packaging solutions. Adhesive type covers water-based adhesives, hot-melt adhesives, solvent-based adhesives, acrylic adhesives, and bio-based adhesives, ensuring compatibility with recycling processes.

Label format includes pressure-sensitive labels, shrink sleeve labels, in-mold labels, and wraparound labels, offering versatile applications across industries. End-use industries include food and beverages, pharmaceuticals and healthcare, cosmetics and personal care, household products, and e-commerce and logistics, addressing growing demand for sustainable labeling. Regionally, the market is segmented into North America, Europe, Asia-Pacific, Latin America, and the Middle East & Africa.
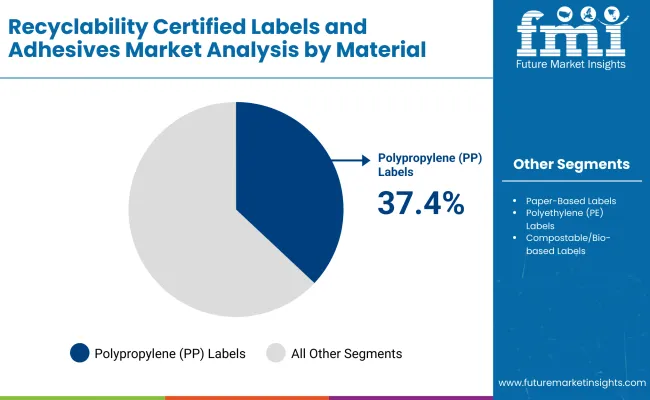
Polypropylene Labels Dominate Materials with Durability and Versatility

Recyclability Certified Labels And Adhesives Market By Material

Polypropylene (PP) labels are projected to account for 37.4% of the market in 2025, supported by their balance of strength, moisture resistance, and recyclability. They perform well in demanding environments such as chilled foods, beverages, and household products, where durability is critical. Their printability also enhances branding opportunities for consumer-facing industries.

Adoption is reinforced by regulatory shifts encouraging recyclable plastics in packaging. PP labels’ compatibility with widely used recycling streams further strengthens their role. With expanding demand for cost-effective, high-performance labeling, polypropylene remains the preferred material choice across diverse sectors.
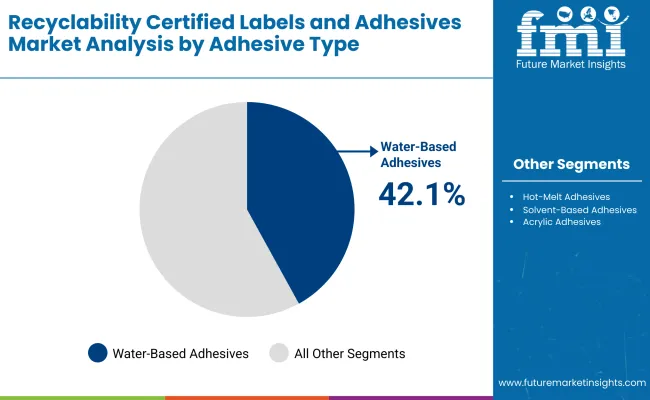
Water-Based Adhesives Lead with Eco-Friendly Performance

Recyclability Certified Labels And Adhesives Market By Adhesive

Water-based adhesives are expected to hold 42.1% of the market in 2025, driven by their low VOC emissions and compatibility with recycling processes. These adhesives ensure label removal without contaminating paper or plastic recycling streams, supporting circular economy initiatives. Their strong bonding strength makes them effective across food, beverage, and healthcare packaging.

Their adoption is supported by strict environmental regulations and brand sustainability goals. Continuous advancements in water-based formulations enhance resistance to moisture and temperature changes. As recyclability certification gains momentum, water-based adhesives dominate as the most compliant and eco-friendly solution.
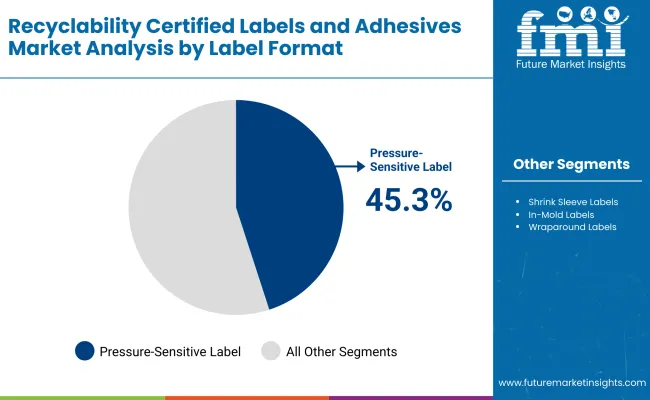
Pressure-Sensitive Labels Dominate Formats with Wide Applicability

Recyclability Certified Labels And Adhesives Market By Label

Pressure-sensitive labels are projected to represent 45.3% of the market in 2025, reflecting their versatility, ease of application, and compatibility with automated labeling systems. They are widely used across food, beverage, personal care, and logistics packaging due to their efficiency and adaptability.

Their recyclability certifications make them integral to sustainable packaging initiatives. The segment benefits from high-speed application capabilities, reducing downtime in production. With consumer goods industries prioritizing convenience and branding, pressure-sensitive labels remain the leading format.
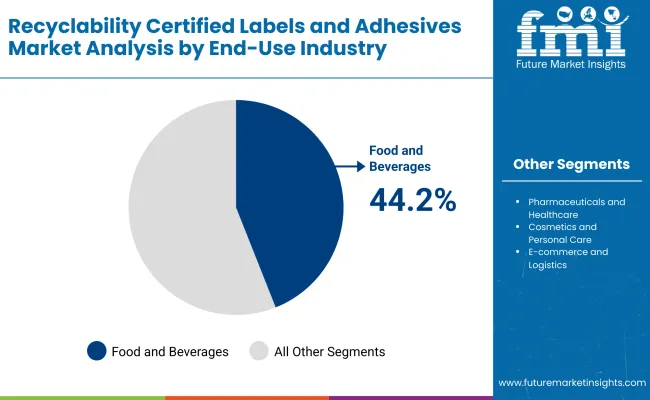
Food and Beverages Lead End-Use with High-Volume Adoption

Recyclability Certified Labels And Adhesives Market By End Use

The food and beverage industry is forecast to account for 44.2% of the market in 2025, as labeling ensures compliance, traceability, and strong shelf presence. Certified recyclable labels support sustainability goals while maintaining visual appeal for branding and consumer engagement.

High turnover of packaged foods and drinks sustains demand for efficient labeling solutions. Producers rely on certified adhesives and materials to meet both regulatory standards and consumer eco-preferences. As global packaged food consumption grows, this sector anchors demand for recyclable labels and adhesives.

What are the Drivers, Restraints, and Key Trends of the Recyclability Certified Labels and Adhesives Market?

The recyclability certified labels and adhesives market is expanding as industries prioritize sustainable packaging to meet regulatory mandates and consumer demand. Growth in food, beverage, and personal care sectors is fueling adoption of recyclable labeling solutions. However, high certification costs and technical challenges in adhesion restrain market penetration. Innovations in water-based adhesives, compostable substrates, and circular economy practices are shaping its growth trajectory.

Sustainability Goals, Regulations, and Brand Commitments Driving Adoption

Recyclability certified labels and adhesives enable brands to ensure packaging compatibility with recycling streams, reducing contamination. Food and beverage companies are adopting these solutions to align with global sustainability targets and plastic reduction mandates. Certification assures consumers of eco-friendly practices, enhancing brand image and trust. Personal care and e-commerce sectors also benefit from recyclable label formats that combine durability with environmental responsibility. These drivers make certified labeling solutions essential for brand competitiveness and compliance.

High Certification Costs, Technical Adhesion Issues, and Material Limits Restraining Growth

Despite rising demand, obtaining recyclability certification involves high testing, auditing, and compliance costs, challenging small and mid-sized companies. Technical issues arise in achieving strong adhesion while maintaining recyclability, especially on films and flexible substrates. Limitations in performance under extreme conditions, such as moisture or heat, further restrict adoption. Additionally, recycling infrastructures vary globally, affecting label recovery rates. These restraints slow scalability, despite sustainability-driven momentum in packaging industries.

Water-based Adhesives, Compostable Substrates, and Circular Practices Trends Emerging

Key trends include the rise of water-based and bio-based adhesives that enhance recyclability without compromising performance. Compostable and paper-based labels are gaining traction in food and retail packaging, reducing waste impact. Circular economy initiatives are encouraging closed-loop systems, where certified labels facilitate higher recovery rates. Smart printing technologies are enabling clearer recycling instructions on packaging. These innovations are positioning recyclability certified labels and adhesives as critical enablers of sustainable packaging ecosystems worldwide.
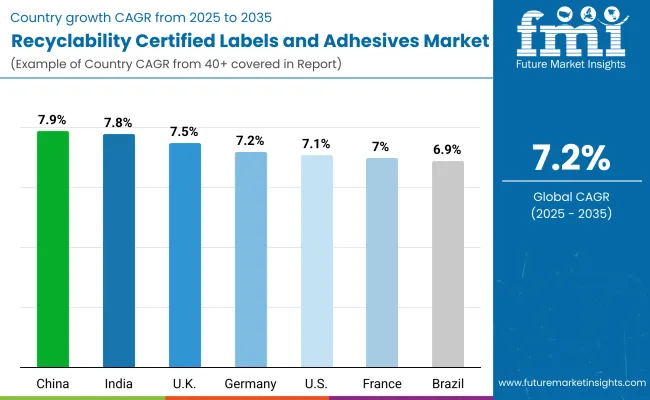
Analysis of Recyclability Certified Labels and Adhesives Market by Key Countries

Recyclability Certified Labels And Adhesives Market By Country

The global recyclability certified labels and adhesives market is expanding rapidly, driven by the transition to circular packaging, stricter regulations, and consumer demand for eco-friendly solutions. Asia-Pacific is emerging as a key growth region, with India and China leading adoption due to strong government sustainability initiatives and rising FMCG demand. Developed markets such as the USA, Germany, and Japan are focusing on advanced adhesive chemistries, water-based solutions, and certification compliance, ensuring performance while supporting recycling infrastructure and global sustainability goals.
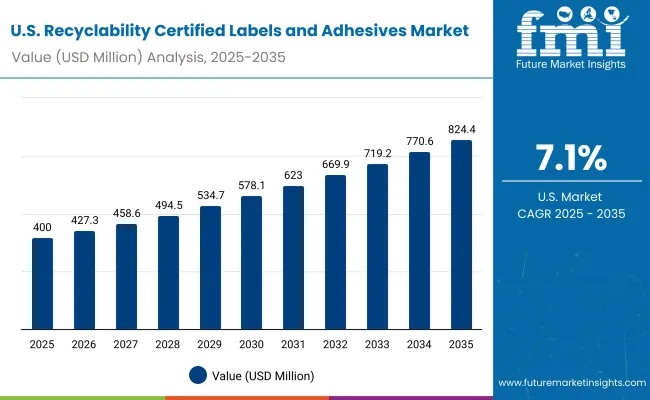
Sales Outlook for Recyclability Certified Labels and Adhesives Market United States

Recyclability Certified Labels And Adhesives Market Usa

The USA market is projected to grow at a CAGR of 7.5% from 2025 to 2035, fueled by rising demand from food, beverages, and pharmaceuticals. Companies are investing in water-based and biodegradable adhesives that maintain recyclability across packaging streams. Growth is also driven by e-commerce and logistics, where certified labels ensure sustainability compliance. OEMs are developing high-speed labeling systems compatible with eco-friendly adhesives to help USA industries meet federal packaging mandates and brand sustainability targets.
  • Food and beverage firms adopt recyclable labels for compliance and branding.
  • Pharma brands use certified adhesives for safe, eco-friendly labeling.
  • OEMs design labeling systems for biodegradable adhesive compatibility.

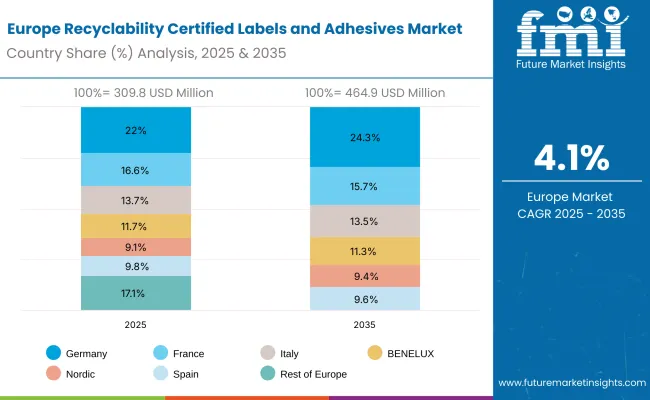
Growth Outlook for Recyclability Certified Labels and Adhesives Market Germany

Recyclability Certified Labels And Adhesives Market Europe

Germany’s market is expected to grow at a CAGR of 7.2%, supported by strict EU recycling targets and circular economy goals. German manufacturers are pioneering solvent-free adhesives and recyclable labels tailored for beverages, cosmetics, and consumer goods. Demand is strong for labels that ensure high optical quality while being fully recyclable. Export-oriented industries are driving innovation, with OEMs designing modular labeling systems that align with EU sustainability mandates and reduce environmental impact in large-scale operations.

  • Beverage firms adopt recyclable labels aligned with EU packaging mandates.
  • Cosmetics producers use eco-labels for sustainable branding.
  • OEMs innovate modular systems with solvent-free adhesives.

Expansion Outlook for Recyclability Certified Labels and Adhesives Market United Kingdom

The UK market is forecast to grow at a CAGR of 7.1%, driven by demand in FMCG, personal care, and e-commerce packaging. Rising pressure to meet packaging waste reduction targets is fueling adoption of certified recyclable labels and adhesives. SMEs are increasingly investing in cost-effective eco-label solutions to enhance compliance. Innovation is also focused on wash-off adhesives that maintain recyclability in PET and HDPE streams, supporting sustainability goals across UK industries.

  • FMCG brands adopt recyclable labels for eco-compliance.
  • SMEs integrate cost-efficient eco-labels for packaging waste reduction.
  • OEMs provide wash-off adhesive systems for PET and HDPE recyclability.

Sales Outlook for Recyclability Certified Labels and Adhesives Market China

China’s market is projected to grow at a CAGR of 7.9%, driven by rapid industrial growth, e-commerce expansion, and government-led plastic reduction mandates. Local manufacturers are producing cost-effective recyclable labels with water-based adhesives for mass adoption. Strong demand is emerging in food, beverage, and logistics industries. Export-oriented companies are increasingly adopting certified labels to meet international compliance requirements, reinforcing China’s position as a major hub for recyclable packaging solutions.

  • Food processors adopt recyclable labels for freshness and compliance.
  • Logistics firms integrate eco-labels for e-commerce packaging.
  • OEMs scale affordable water-based adhesive technologies.

Growth Outlook for Recyclability Certified Labels and Adhesives Market India

India is forecast to grow at a CAGR of 7.8%, supported by strong FMCG, pharmaceutical, and retail growth. Government sustainability initiatives and rising consumer preference for eco-friendly packaging are fueling demand. SMEs are adopting recyclable adhesive solutions to meet export requirements. Growth is also supported by domestic innovation in bio-based adhesives. The shift toward sustainable packaging formats across industries is making India a prominent growth hub for certified recyclable labels and adhesives.

  • FMCG exporters adopt recyclable labels for global compliance.
  • Pharma brands use eco-adhesives for sustainable labeling.
  • SMEs deploy affordable certified solutions for compliance.

Growth Outlook for Recyclability Certified Labels and Adhesives Market Japan

Japan’s market is projected to grow at a CAGR of 7.0%, driven by demand in electronics, beverages, and healthcare. Manufacturers are focusing on recyclable adhesives with strong durability and optical clarity. Compact, high-performance labeling systems are being designed to meet Japan’s precision and quality standards. Demand for certified labels that ensure recyclability while maintaining premium product aesthetics is further reinforcing adoption, particularly in electronics and premium beverages.

  • Electronics firms adopt certified labels for premium product compliance.
  • Beverage companies use eco-labels to align with sustainability norms.
  • OEMs deliver compact high-performance labeling machines.

Expansion Outlook for Recyclability Certified Labels and Adhesives Market South Korea

South Korea’s market is expected to grow at a CAGR of 7.1%, supported by cosmetics, pharmaceuticals, and K-food exports. Companies are adopting recyclable adhesives and certified labels to comply with global export standards. Local OEMs are focusing on advanced eco-friendly labeling technologies compatible with automation. Rising demand for sustainable branding in cosmetics and packaged food is reinforcing adoption, positioning South Korea as a leader in recyclable labeling innovation across Asia-Pacific.
  • K-beauty firms adopt recyclable labels for export markets.
  • Food exporters integrate eco-adhesives for compliance with global standards.
  • OEMs design automation-ready eco-labeling systems.

Analysis of Japan by Material Type

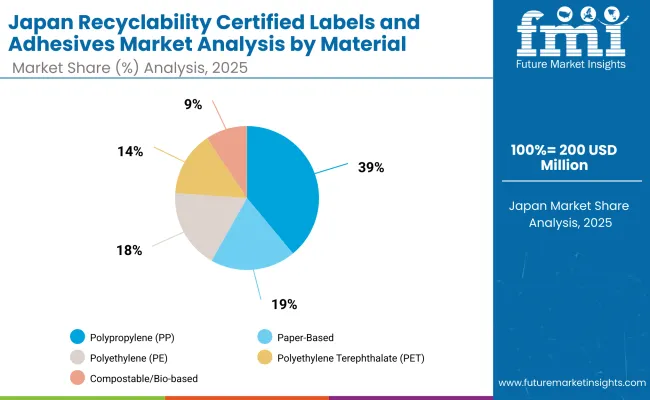
Recyclability Certified Labels And Adhesives Market Japan

Japan’s recyclability certified labels and adhesives market, valued at USD 200 million in 2025, is dominated by polypropylene (PP) labels, holding 39.0% share for their durability and versatility in consumer and industrial packaging. Paper-based labels follow at 19.2%, driven by sustainability and cost-effectiveness. Polyethylene (PE) labels capture 17.9%, while polyethylene terephthalate (PET) labels hold 14.5%, known for strength and transparency. Compostable or bio-based labels, though smaller at 9.4%, are gaining traction as eco-friendly packaging alternatives. This mix highlights Japan’s dual focus on reliable plastic substrates and growing adoption of sustainable solutions, aligning with global packaging innovation trends and environmental targets.
Analysis of South Korea by Adhesive Type

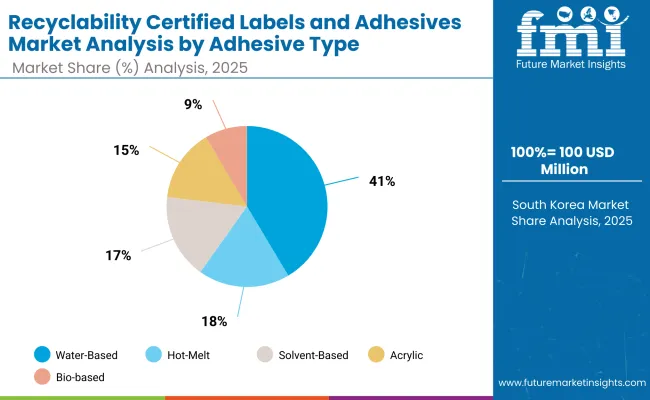
Recyclability Certified Labels And Adhesives Market South Korea

South Korea’s recyclability certified labels and adhesives market, worth USD 100 million in 2025, is led by water-based adhesives, commanding 41.4% share, reflecting their eco-friendly profile and regulatory compliance. Hot-melt adhesives hold 18.4%, offering efficiency in high-speed applications. Solvent-based adhesives account for 17.0%, valued for durability, though gradually declining due to environmental concerns. Acrylic adhesives represent 14.6%, supporting versatile consumer applications, while bio-based adhesives capture 8.5%, reflecting early adoption of greener solutions. This distribution demonstrates South Korea’s shift toward sustainable, water-based adhesives while maintaining diversity in adhesive technologies, balancing performance, cost, and sustainability in its growing packaging and labeling industries.
Competitive Landscape of Recyclability Certified Labels and Adhesives Market

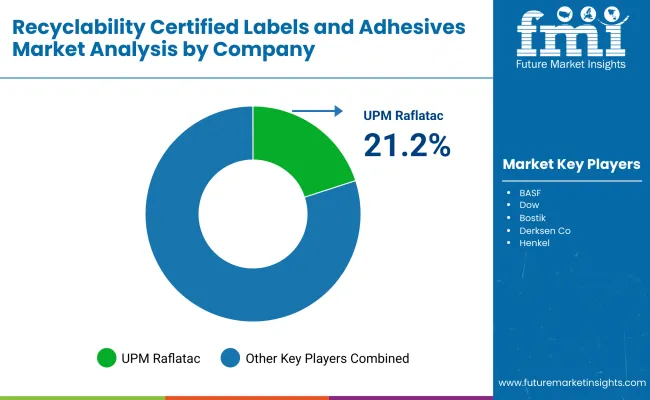
Recyclability Certified Labels And Adhesives Market By Company

The recyclability certified labels and adhesives market is moderately fragmented, with chemical giants, label manufacturers, and adhesive technology providers competing across food, beverages, pharmaceuticals, and consumer goods sectors. Global leaders such as UPM Raflatac, BASF, and Dow hold notable market share, driven by pressure-sensitive labels, wash-off adhesives, and compliance with APR and EU recyclability guidelines. Their strategies increasingly emphasize circular economy solutions, low-migration adhesives, and compatibility with PET and paper recycling streams.

Established mid-sized players including Bostik, Derksen Co., and Henkel are supporting adoption of recyclable labeling formats featuring bio-based adhesives, solvent-free formulations, and high-performance bonding for multiple substrates. These companies are especially active in consumer packaging and healthcare, offering solutions that reduce contamination risks, enhance sustainability credentials, and deliver reliable adhesion without hindering recycling processes.

Specialized providers such as Avery Dennison/Sappi, Progressive Label, Penmar Industries, and August Faller GmbH & Co. KG focus on customized recyclable label solutions for regional and niche markets. Their strengths lie in sustainable facestock sourcing, eco-certified adhesives, and integration of smart features like traceability codes, enabling brands to meet regulatory demands while reinforcing environmental responsibility and brand differentiation.

Key Developments

  • In September 2024, UPM Raflatac became the first in the industry to earn APR Design® for Recyclability Recognition for its clear and white polypropylene (PP) pressure-sensitive labels, paired with SmartCircle™ wash-off adhesive and general-purpose acrylic adhesives. These labels meet rigorous recycling criteria for PET and HDPE packaging in North America specifically for natural HDPE, marking a significant sustainability milestone.
  • In June 2024, Three Dow laminating adhesives PACACEL™ L75-200, L-75-191 solventless, and ADCOTE™ 536A solvent-borne received APR Critical Guidance Recognition for enabling recyclability in polyethylene film packaging. PACACEL L75-200 and L-75-191 are Dow’s first solventless adhesives to earn this recognition.

Key Companies

  • UPM Raflatac
  • BASF
  • Dow
  • Bostik
  • Derksen Co.
  • Henkel
  • Avery Dennison / Sappi
  • Progressive Label
  • Penmar Industries
  • August Faller GmbH & Co. KG

Scope of the Report

Item Value
Quantitative Units USD 1.3 Billion
By Material Type Paper-Based Labels, Polyethylene (PE) Labels, Polypropylene (PP) Labels, Polyethylene Terephthalate (PET) Labels, Compostable/Bio-based Labels
By Adhesive Type Water-Based Adhesives, Hot-Melt Adhesives, Solvent-Based Adhesives, Acrylic Adhesives, Bio-based Adhesives
By Label Format Pressure-Sensitive Labels, Shrink Sleeve Labels, In-Mold Labels, Wraparound Labels
By End-Use Industry Food and Beverages, Pharmaceuticals and Healthcare, Cosmetics and Personal Care, Household Products, E-commerce and Logistics
Key Companies Profiled UPM Raflatac, BASF, Dow, Bostik, Derksen Co., Henkel, Avery Dennison / Sappi, Progressive Label, Penmar Industries, August Faller GmbH & Co. KG
Additional Attributes Rising adoption of water-based adhesives projected to dominate due to eco-friendly compliance, increasing demand for pressure-sensitive labels in food and beverage packaging, growing emphasis on compostable and bio-based labels supporting circular economy, enhanced recycling compatibility driving PET and PP label use, and regulatory shifts pushing brand owners to adopt certified recyclable adhesives and label formats across consumer goods, e-commerce, and healthcare applications.

Key Segmentation

By Material Type:

  • Paper-Based Labels
  • Polyethylene (PE) Labels
  • Polypropylene (PP) Labels
  • Polyethylene Terephthalate (PET) Labels
  • Compostable/Bio-based Labels

By Adhesive Type:

  • Water-Based Adhesives
  • Hot-Melt Adhesives
  • Solvent-Based Adhesives
  • Acrylic Adhesives
  • Bio-based Adhesives

By Label Format:

  • Pressure-Sensitive Labels
  • Shrink Sleeve Labels
  • In-Mold Labels
  • Wraparound Labels

By End-Use Industry:

  • Food and Beverages
  • Pharmaceuticals and Healthcare
  • Cosmetics and Personal Care
  • Household Products
  • E-commerce and Logistics

By Region:

  • North America
  • Europe
  • Asia-Pacific
  • Latin America
  • Middle East & Africa

Table of Content

  1. Executive Summary
    • Global Market Outlook
    • Demand-side Trends
    • Supply-side Trends
    • Technology Roadmap Analysis
    • Analysis and Recommendations
  2. Market Overview
    • Market Coverage / Taxonomy
    • Market Definition / Scope / Limitations
  3. Market Background
    • Market Dynamics
      • Drivers
      • Restraints
      • Opportunity
      • Trends
    • Scenario Forecast
      • Demand in Optimistic Scenario
      • Demand in Likely Scenario
      • Demand in Conservative Scenario
    • Opportunity Map Analysis
    • Product Life Cycle Analysis
    • Supply Chain Analysis
      • Supply Side Participants and their Roles
        • Producers
        • Mid-Level Participants (Traders/ Agents/ Brokers)
        • Wholesalers and Distributors
      • Value Added and Value Created at Node in the Supply Chain
      • List of Raw Material Suppliers
      • List of Existing and Potential Buyer’s
    • Investment Feasibility Matrix
    • Value Chain Analysis
      • Profit Margin Analysis
      • Wholesalers and Distributors
      • Retailers
    • PESTLE and Porter’s Analysis
    • Regulatory Landscape
      • By Key Regions
      • By Key Countries
    • Regional Parent Market Outlook
    • Production and Consumption Statistics
    • Import and Export Statistics
  4. Global Market Analysis 2020 to 2024 and Forecast, 2025 to 2035
    • Historical Market Size Value (USD Billion) & Volume (Units) Analysis, 2020 to 2024
    • Current and Future Market Size Value (USD Billion) & Volume (Units) Projections, 2025 to 2035
      • Y-o-Y Growth Trend Analysis
      • Absolute $ Opportunity Analysis
  5. Global Market Analysis 2020 to 2024 and Forecast 2025 to 2035, By Material Type
    • Introduction / Key Findings
    • Historical Market Size Value (USD Billion) & Volume (Units) Analysis By Material Type, 2020 to 2024
    • Current and Future Market Size Value (USD Billion) & Volume (Units) Analysis and Forecast By Material Type, 2025 to 2035
      • Paper-Based Labels
      • Polyethylene (PE) Labels
      • Polypropylene (PP) Labels
      • Polyethylene Terephthalate (PET) Labels
      • Compostable/Bio-based Labels
    • Y-o-Y Growth Trend Analysis By Material Type, 2020 to 2024
    • Absolute $ Opportunity Analysis By Material Type, 2025 to 2035
  6. Global Market Analysis 2020 to 2024 and Forecast 2025 to 2035, By Adhesive Type
    • Introduction / Key Findings
    • Historical Market Size Value (USD Billion) & Volume (Units) Analysis By Adhesive Type, 2020 to 2024
    • Current and Future Market Size Value (USD Billion) & Volume (Units) Analysis and Forecast By Adhesive Type, 2025 to 2035
      • Water-Based Adhesives
      • Hot-Melt Adhesives
      • Solvent-Based Adhesives
      • Acrylic Adhesives
      • Bio-based Adhesives
    • Y-o-Y Growth Trend Analysis By Adhesive Type, 2020 to 2024
    • Absolute $ Opportunity Analysis By Adhesive Type, 2025 to 2035
  7. Global Market Analysis 2020 to 2024 and Forecast 2025 to 2035, By Label Format
    • Introduction / Key Findings
    • Historical Market Size Value (USD Billion) & Volume (Units) Analysis By Label Format, 2020 to 2024
    • Current and Future Market Size Value (USD Billion) & Volume (Units) Analysis and Forecast By Label Format, 2025 to 2035
      • Pressure-Sensitive Labels
      • Shrink Sleeve Labels
      • In-Mold Labels
      • Wraparound Labels
    • Y-o-Y Growth Trend Analysis By Label Format, 2020 to 2024
    • Absolute $ Opportunity Analysis By Label Format, 2025 to 2035
  8. Global Market Analysis 2020 to 2024 and Forecast 2025 to 2035, By End-Use Industry
    • Introduction / Key Findings
    • Historical Market Size Value (USD Billion) & Volume (Units) Analysis By End-Use Industry, 2020 to 2024
    • Current and Future Market Size Value (USD Billion) & Volume (Units) Analysis and Forecast By End-Use Industry, 2025 to 2035
      • Food and Beverages
      • Pharmaceuticals and Healthcare
      • Cosmetics and Personal Care
      • Household Products
      • E-commerce and Logistics
    • Y-o-Y Growth Trend Analysis By End-Use Industry, 2020 to 2024
    • Absolute $ Opportunity Analysis By End-Use Industry, 2025 to 2035
  9. Global Market Analysis 2020 to 2024 and Forecast 2025 to 2035, By Region
    • Introduction
    • Historical Market Size Value (USD Billion) & Volume (Units) Analysis By Region, 2020 to 2024
    • Current Market Size Value (USD Billion) & Volume (Units) Analysis and Forecast By Region, 2025 to 2035
      • North America
      • Latin America
      • East Asia
      • South Asia & Pacific
      • Europe
      • Middle East & Africa
    • Market Attractiveness Analysis By Region
  10. North America Market Analysis 2020 to 2024 and Forecast 2025 to 2035, By Country
    • Historical Market Size Value (USD Billion) & Volume (Units) Trend Analysis By Market Taxonomy, 2020 to 2024
    • Market Size Value (USD Billion) & Volume (Units) Forecast By Market Taxonomy, 2025 to 2035
      • By Country
        • USA
        • Canada
        • Mexico
      • By Material Type
      • By Adhesive Type
      • By Label Format
      • By End-Use Industry
    • Market Attractiveness Analysis
      • By Country
      • By Material Type
      • By Adhesive Type
      • By Label Format
      • By End-Use Industry
    • Key Takeaways
  11. Latin America Market Analysis 2020 to 2024 and Forecast 2025 to 2035, By Country
    • Historical Market Size Value (USD Billion) & Volume (Units) Trend Analysis By Market Taxonomy, 2020 to 2024
    • Market Size Value (USD Billion) & Volume (Units) Forecast By Market Taxonomy, 2025 to 2035
      • By Country
        • Brazil
        • Argentina
        • Rest of Latin America
      • By Material Type
      • By Adhesive Type
      • By Label Format
      • By End-Use Industry
    • Market Attractiveness Analysis
      • By Country
      • By Material Type
      • By Adhesive Type
      • By Label Format
      • By End-Use Industry
    • Key Takeaways
  12. East Asia Market Analysis 2020 to 2024 and Forecast 2025 to 2035, By Country
    • Historical Market Size Value (USD Billion) & Volume (Units) Trend Analysis By Market Taxonomy, 2020 to 2024
    • Market Size Value (USD Billion) & Volume (Units) Forecast By Market Taxonomy, 2025 to 2035
      • By Country
        • China
        • Japan
        • South Korea
      • By Material Type
      • By Adhesive Type
      • By Label Format
      • By End-Use Industry
    • Market Attractiveness Analysis
      • By Country
      • By Material Type
      • By Adhesive Type
      • By Label Format
      • By End-Use Industry
    • Key Takeaways
  13. South Asia & Pacific Market Analysis 2020 to 2024 and Forecast 2025 to 2035, By Country
    • Historical Market Size Value (USD Billion) & Volume (Units) Trend Analysis By Market Taxonomy, 2020 to 2024
    • Market Size Value (USD Billion) & Volume (Units) Forecast By Market Taxonomy, 2025 to 2035
      • By Country
        • India
        • ASEAN Countries
        • Australia& New Zealand
        • Rest of South Asia
      • By Material Type
      • By Adhesive Type
      • By Label Format
      • By End-Use Industry
    • Market Attractiveness Analysis
      • By Country
      • By Material Type
      • By Adhesive Type
      • By Label Format
      • By End-Use Industry
    • Key Takeaways
  14. Europe Market Analysis 2020 to 2024 and Forecast 2025 to 2035, By Country
    • Historical Market Size Value (USD Billion) & Volume (Units) Trend Analysis By Market Taxonomy, 2020 to 2024
    • Market Size Value (USD Billion) & Volume (Units) Forecast By Market Taxonomy, 2025 to 2035
      • By Country
        • Germany
        • UK
        • France
        • Italy
        • Spain
        • BENELUX
        • Nordic Countries
        • Russia
        • Hungary
        • Poland
        • Rest of Europe
      • By Material Type
      • By Adhesive Type
      • By Label Format
      • By End-Use Industry
    • Market Attractiveness Analysis
      • By Country
      • By Material Type
      • By Adhesive Type
      • By Label Format
      • By End-Use Industry
    • Key Takeaways
  15. Middle East & Africa Market Analysis 2020 to 2024 and Forecast 2025 to 2035, By Country
    • Historical Market Size Value (USD Billion) & Volume (Units) Trend Analysis By Market Taxonomy, 2020 to 2024
    • Market Size Value (USD Billion) & Volume (Units) Forecast By Market Taxonomy, 2025 to 2035
      • By Country
        • Saudi Arabia
        • Türkiye
        • South Africa
        • Other African Union
        • Rest of Middle East & Africa
      • By Material Type
      • By Adhesive Type
      • By Label Format
      • By End-Use Industry
    • Market Attractiveness Analysis
      • By Country
      • By Material Type
      • By Adhesive Type
      • By Label Format
      • By End-Use Industry
    • Key Takeaways
  16. Key Countries Market Analysis
    • USA.
      • Pricing Analysis
      • Market Share Analysis, 2024
        • By Material Type
        • By Adhesive Type
        • By Label Format
        • By End-Use Industry
    • Brazil
      • Pricing Analysis
      • Market Share Analysis, 2024
        • By Material Type
        • By Adhesive Type
        • By Label Format
        • By End-Use Industry
    • China
      • Pricing Analysis
      • Market Share Analysis, 2024
        • By Material Type
        • By Adhesive Type
        • By Label Format
        • By End-Use Industry
    • India
      • Pricing Analysis
      • Market Share Analysis, 2024
        • By Material Type
        • By Adhesive Type
        • By Label Format
        • By End-Use Industry
    • Europe
      • Pricing Analysis
      • Market Share Analysis, 2024
        • By Material Type
        • By Adhesive Type
        • By Label Format
        • By End-Use Industry
    • Germany
      • Pricing Analysis
      • Market Share Analysis, 2024
        • By Material Type
        • By Adhesive Type
        • By Label Format
        • By End-Use Industry
    • France
      • Pricing Analysis
      • Market Share Analysis, 2024
        • By Material Type
        • By Adhesive Type
        • By Label Format
        • By End-Use Industry
    • UK
      • Pricing Analysis
      • Market Share Analysis, 2024
        • By Material Type
        • By Adhesive Type
        • By Label Format
        • By End-Use Industry
  17. Market Structure Analysis
    • Competition Dashboard
    • Competition Benchmarking
    • Market Share Analysis of Top Players
      • By Regional
      • By Material Type
      • By Adhesive Type
      • By Label Format
      • By End-Use Industry
  18. Competition Analysis
    • Competition Deep Dive
      • UPM Raflatac
        • Overview
        • Product Portfolio
        • Profitability by Market Segments (Product/Age /Sales Channel/Region)
        • Sales Footprint
        • Strategy Overview
          • Marketing Strategy
          • Product Strategy
          • Channel Strategy
      • BASF
        • Overview
        • Product Portfolio
        • Profitability by Market Segments (Product/Age /Sales Channel/Region)
        • Sales Footprint
        • Strategy Overview
          • Marketing Strategy
          • Product Strategy
          • Channel Strategy
      • Dow
        • Overview
        • Product Portfolio
        • Profitability by Market Segments (Product/Age /Sales Channel/Region)
        • Sales Footprint
        • Strategy Overview
          • Marketing Strategy
          • Product Strategy
          • Channel Strategy
      • Bostik
        • Overview
        • Product Portfolio
        • Profitability by Market Segments (Product/Age /Sales Channel/Region)
        • Sales Footprint
        • Strategy Overview
          • Marketing Strategy
          • Product Strategy
          • Channel Strategy
      • Derksen Co.
        • Overview
        • Product Portfolio
        • Profitability by Market Segments (Product/Age /Sales Channel/Region)
        • Sales Footprint
        • Strategy Overview
          • Marketing Strategy
          • Product Strategy
          • Channel Strategy
      • Henkel
        • Overview
        • Product Portfolio
        • Profitability by Market Segments (Product/Age /Sales Channel/Region)
        • Sales Footprint
        • Strategy Overview
          • Marketing Strategy
          • Product Strategy
          • Channel Strategy
      • Avery Dennison / Sappi
        • Overview
        • Product Portfolio
        • Profitability by Market Segments (Product/Age /Sales Channel/Region)
        • Sales Footprint
        • Strategy Overview
          • Marketing Strategy
          • Product Strategy
          • Channel Strategy
      • Progressive Label
        • Overview
        • Product Portfolio
        • Profitability by Market Segments (Product/Age /Sales Channel/Region)
        • Sales Footprint
        • Strategy Overview
          • Marketing Strategy
          • Product Strategy
          • Channel Strategy
      • Penmar Industries
        • Overview
        • Product Portfolio
        • Profitability by Market Segments (Product/Age /Sales Channel/Region)
        • Sales Footprint
        • Strategy Overview
          • Marketing Strategy
          • Product Strategy
          • Channel Strategy
      • August Faller GmbH & Co. KG
        • Overview
        • Product Portfolio
        • Profitability by Market Segments (Product/Age /Sales Channel/Region)
        • Sales Footprint
        • Strategy Overview
          • Marketing Strategy
          • Product Strategy
          • Channel Strategy
  19. Assumptions & Acronyms Used
  20. Research Methodology

List of Tables

  • Table 1: Global Market Value (USD Billion) Forecast by Region, 2020-2035
  • Table 2: Global Market Volume (Units) Forecast by Region, 2020-2035
  • Table 3: Global Market Value (USD Billion) Forecast by Material Type, 2020-2035
  • Table 4: Global Market Volume (Units) Forecast by Material Type, 2020-2035
  • Table 5: Global Market Value (USD Billion) Forecast by Adhesive Type, 2020-2035
  • Table 6: Global Market Volume (Units) Forecast by Adhesive Type, 2020-2035
  • Table 7: Global Market Value (USD Billion) Forecast by Label Format, 2020-2035
  • Table 8: Global Market Volume (Units) Forecast by Label Format, 2020-2035
  • Table 9: Global Market Value (USD Billion) Forecast by End-Use Industry, 2020-2035
  • Table 10: Global Market Volume (Units) Forecast by End-Use Industry, 2020-2035
  • Table 11: North America Market Value (USD Billion) Forecast by Country, 2020-2035
  • Table 12: North America Market Volume (Units) Forecast by Country, 2020-2035
  • Table 13: North America Market Value (USD Billion) Forecast by Material Type, 2020-2035
  • Table 14: North America Market Volume (Units) Forecast by Material Type, 2020-2035
  • Table 15: North America Market Value (USD Billion) Forecast by Adhesive Type, 2020-2035
  • Table 16: North America Market Volume (Units) Forecast by Adhesive Type, 2020-2035
  • Table 17: North America Market Value (USD Billion) Forecast by Label Format, 2020-2035
  • Table 18: North America Market Volume (Units) Forecast by Label Format, 2020-2035
  • Table 19: North America Market Value (USD Billion) Forecast by End-Use Industry, 2020-2035
  • Table 20: North America Market Volume (Units) Forecast by End-Use Industry, 2020-2035
  • Table 21: Latin America Market Value (USD Billion) Forecast by Country, 2020-2035
  • Table 22: Latin America Market Volume (Units) Forecast by Country, 2020-2035
  • Table 23: Latin America Market Value (USD Billion) Forecast by Material Type, 2020-2035
  • Table 24: Latin America Market Volume (Units) Forecast by Material Type, 2020-2035
  • Table 25: Latin America Market Value (USD Billion) Forecast by Adhesive Type, 2020-2035
  • Table 26: Latin America Market Volume (Units) Forecast by Adhesive Type, 2020-2035
  • Table 27: Latin America Market Value (USD Billion) Forecast by Label Format, 2020-2035
  • Table 28: Latin America Market Volume (Units) Forecast by Label Format, 2020-2035
  • Table 29: Latin America Market Value (USD Billion) Forecast by End-Use Industry, 2020-2035
  • Table 30: Latin America Market Volume (Units) Forecast by End-Use Industry, 2020-2035
  • Table 31: East Asia Market Value (USD Billion) Forecast by Country, 2020-2035
  • Table 32: East Asia Market Volume (Units) Forecast by Country, 2020-2035
  • Table 33: East Asia Market Value (USD Billion) Forecast by Material Type, 2020-2035
  • Table 34: East Asia Market Volume (Units) Forecast by Material Type, 2020-2035
  • Table 35: East Asia Market Value (USD Billion) Forecast by Adhesive Type, 2020-2035
  • Table 36: East Asia Market Volume (Units) Forecast by Adhesive Type, 2020-2035
  • Table 37: East Asia Market Value (USD Billion) Forecast by Label Format, 2020-2035
  • Table 38: East Asia Market Volume (Units) Forecast by Label Format, 2020-2035
  • Table 39: East Asia Market Value (USD Billion) Forecast by End-Use Industry, 2020-2035
  • Table 40: East Asia Market Volume (Units) Forecast by End-Use Industry, 2020-2035
  • Table 41: South Asia & Pacific Market Value (USD Billion) Forecast by Country, 2020-2035
  • Table 42: South Asia & Pacific Market Volume (Units) Forecast by Country, 2020-2035
  • Table 43: South Asia & Pacific Market Value (USD Billion) Forecast by Material Type, 2020-2035
  • Table 44: South Asia & Pacific Market Volume (Units) Forecast by Material Type, 2020-2035
  • Table 45: South Asia & Pacific Market Value (USD Billion) Forecast by Adhesive Type, 2020-2035
  • Table 46: South Asia & Pacific Market Volume (Units) Forecast by Adhesive Type, 2020-2035
  • Table 47: South Asia & Pacific Market Value (USD Billion) Forecast by Label Format, 2020-2035
  • Table 48: South Asia & Pacific Market Volume (Units) Forecast by Label Format, 2020-2035
  • Table 49: South Asia & Pacific Market Value (USD Billion) Forecast by End-Use Industry, 2020-2035
  • Table 50: South Asia & Pacific Market Volume (Units) Forecast by End-Use Industry, 2020-2035
  • Table 51: Europe Market Value (USD Billion) Forecast by Country, 2020-2035
  • Table 52: Europe Market Volume (Units) Forecast by Country, 2020-2035
  • Table 53: Europe Market Value (USD Billion) Forecast by Material Type, 2020-2035
  • Table 54: Europe Market Volume (Units) Forecast by Material Type, 2020-2035
  • Table 55: Europe Market Value (USD Billion) Forecast by Adhesive Type, 2020-2035
  • Table 56: Europe Market Volume (Units) Forecast by Adhesive Type, 2020-2035
  • Table 57: Europe Market Value (USD Billion) Forecast by Label Format, 2020-2035
  • Table 58: Europe Market Volume (Units) Forecast by Label Format, 2020-2035
  • Table 59: Europe Market Value (USD Billion) Forecast by End-Use Industry, 2020-2035
  • Table 60: Europe Market Volume (Units) Forecast by End-Use Industry, 2020-2035
  • Table 61: Middle East & Africa Market Value (USD Billion) Forecast by Country, 2020-2035
  • Table 62: Middle East & Africa Market Volume (Units) Forecast by Country, 2020-2035
  • Table 63: Middle East & Africa Market Value (USD Billion) Forecast by Material Type, 2020-2035
  • Table 64: Middle East & Africa Market Volume (Units) Forecast by Material Type, 2020-2035
  • Table 65: Middle East & Africa Market Value (USD Billion) Forecast by Adhesive Type, 2020-2035
  • Table 66: Middle East & Africa Market Volume (Units) Forecast by Adhesive Type, 2020-2035
  • Table 67: Middle East & Africa Market Value (USD Billion) Forecast by Label Format, 2020-2035
  • Table 68: Middle East & Africa Market Volume (Units) Forecast by Label Format, 2020-2035
  • Table 69: Middle East & Africa Market Value (USD Billion) Forecast by End-Use Industry, 2020-2035
  • Table 70: Middle East & Africa Market Volume (Units) Forecast by End-Use Industry, 2020-2035

List of Figures

  • Figure 1: Global Market Value (USD Billion) by Material Type, 2025-2035
  • Figure 2: Global Market Value (USD Billion) by Adhesive Type, 2025-2035
  • Figure 3: Global Market Value (USD Billion) by Label Format, 2025-2035
  • Figure 4: Global Market Value (USD Billion) by End-Use Industry, 2025-2035
  • Figure 5: Global Market Value (USD Billion) by Region, 2025-2035
  • Figure 6: Global Market Value (USD Billion) Analysis by Region, 2020-2035
  • Figure 7: Global Market Volume (Units) Analysis by Region, 2020-2035
  • Figure 8: Global Market Value Share (%) and BPS Analysis by Region, 2025-2035
  • Figure 9: Global Market Y-o-Y Growth (%) Projections by Region, 2025-2035
  • Figure 10: Global Market Value (USD Billion) Analysis by Material Type, 2020-2035
  • Figure 11: Global Market Volume (Units) Analysis by Material Type, 2020-2035
  • Figure 12: Global Market Value Share (%) and BPS Analysis by Material Type, 2025-2035
  • Figure 13: Global Market Y-o-Y Growth (%) Projections by Material Type, 2025-2035
  • Figure 14: Global Market Value (USD Billion) Analysis by Adhesive Type, 2020-2035
  • Figure 15: Global Market Volume (Units) Analysis by Adhesive Type, 2020-2035
  • Figure 16: Global Market Value Share (%) and BPS Analysis by Adhesive Type, 2025-2035
  • Figure 17: Global Market Y-o-Y Growth (%) Projections by Adhesive Type, 2025-2035
  • Figure 18: Global Market Value (USD Billion) Analysis by Label Format, 2020-2035
  • Figure 19: Global Market Volume (Units) Analysis by Label Format, 2020-2035
  • Figure 20: Global Market Value Share (%) and BPS Analysis by Label Format, 2025-2035
  • Figure 21: Global Market Y-o-Y Growth (%) Projections by Label Format, 2025-2035
  • Figure 22: Global Market Value (USD Billion) Analysis by End-Use Industry, 2020-2035
  • Figure 23: Global Market Volume (Units) Analysis by End-Use Industry, 2020-2035
  • Figure 24: Global Market Value Share (%) and BPS Analysis by End-Use Industry, 2025-2035
  • Figure 25: Global Market Y-o-Y Growth (%) Projections by End-Use Industry, 2025-2035
  • Figure 26: Global Market Attractiveness by Material Type, 2025-2035
  • Figure 27: Global Market Attractiveness by Adhesive Type, 2025-2035
  • Figure 28: Global Market Attractiveness by Label Format, 2025-2035
  • Figure 29: Global Market Attractiveness by End-Use Industry, 2025-2035
  • Figure 30: Global Market Attractiveness by Region, 2025-2035
  • Figure 31: North America Market Value (USD Billion) by Material Type, 2025-2035
  • Figure 32: North America Market Value (USD Billion) by Adhesive Type, 2025-2035
  • Figure 33: North America Market Value (USD Billion) by Label Format, 2025-2035
  • Figure 34: North America Market Value (USD Billion) by End-Use Industry, 2025-2035
  • Figure 35: North America Market Value (USD Billion) by Country, 2025-2035
  • Figure 36: North America Market Value (USD Billion) Analysis by Country, 2020-2035
  • Figure 37: North America Market Volume (Units) Analysis by Country, 2020-2035
  • Figure 38: North America Market Value Share (%) and BPS Analysis by Country, 2025-2035
  • Figure 39: North America Market Y-o-Y Growth (%) Projections by Country, 2025-2035
  • Figure 40: North America Market Value (USD Billion) Analysis by Material Type, 2020-2035
  • Figure 41: North America Market Volume (Units) Analysis by Material Type, 2020-2035
  • Figure 42: North America Market Value Share (%) and BPS Analysis by Material Type, 2025-2035
  • Figure 43: North America Market Y-o-Y Growth (%) Projections by Material Type, 2025-2035
  • Figure 44: North America Market Value (USD Billion) Analysis by Adhesive Type, 2020-2035
  • Figure 45: North America Market Volume (Units) Analysis by Adhesive Type, 2020-2035
  • Figure 46: North America Market Value Share (%) and BPS Analysis by Adhesive Type, 2025-2035
  • Figure 47: North America Market Y-o-Y Growth (%) Projections by Adhesive Type, 2025-2035
  • Figure 48: North America Market Value (USD Billion) Analysis by Label Format, 2020-2035
  • Figure 49: North America Market Volume (Units) Analysis by Label Format, 2020-2035
  • Figure 50: North America Market Value Share (%) and BPS Analysis by Label Format, 2025-2035
  • Figure 51: North America Market Y-o-Y Growth (%) Projections by Label Format, 2025-2035
  • Figure 52: North America Market Value (USD Billion) Analysis by End-Use Industry, 2020-2035
  • Figure 53: North America Market Volume (Units) Analysis by End-Use Industry, 2020-2035
  • Figure 54: North America Market Value Share (%) and BPS Analysis by End-Use Industry, 2025-2035
  • Figure 55: North America Market Y-o-Y Growth (%) Projections by End-Use Industry, 2025-2035
  • Figure 56: North America Market Attractiveness by Material Type, 2025-2035
  • Figure 57: North America Market Attractiveness by Adhesive Type, 2025-2035
  • Figure 58: North America Market Attractiveness by Label Format, 2025-2035
  • Figure 59: North America Market Attractiveness by End-Use Industry, 2025-2035
  • Figure 60: North America Market Attractiveness by Country, 2025-2035
  • Figure 61: Latin America Market Value (USD Billion) by Material Type, 2025-2035
  • Figure 62: Latin America Market Value (USD Billion) by Adhesive Type, 2025-2035
  • Figure 63: Latin America Market Value (USD Billion) by Label Format, 2025-2035
  • Figure 64: Latin America Market Value (USD Billion) by End-Use Industry, 2025-2035
  • Figure 65: Latin America Market Value (USD Billion) by Country, 2025-2035
  • Figure 66: Latin America Market Value (USD Billion) Analysis by Country, 2020-2035
  • Figure 67: Latin America Market Volume (Units) Analysis by Country, 2020-2035
  • Figure 68: Latin America Market Value Share (%) and BPS Analysis by Country, 2025-2035
  • Figure 69: Latin America Market Y-o-Y Growth (%) Projections by Country, 2025-2035
  • Figure 70: Latin America Market Value (USD Billion) Analysis by Material Type, 2020-2035
  • Figure 71: Latin America Market Volume (Units) Analysis by Material Type, 2020-2035
  • Figure 72: Latin America Market Value Share (%) and BPS Analysis by Material Type, 2025-2035
  • Figure 73: Latin America Market Y-o-Y Growth (%) Projections by Material Type, 2025-2035
  • Figure 74: Latin America Market Value (USD Billion) Analysis by Adhesive Type, 2020-2035
  • Figure 75: Latin America Market Volume (Units) Analysis by Adhesive Type, 2020-2035
  • Figure 76: Latin America Market Value Share (%) and BPS Analysis by Adhesive Type, 2025-2035
  • Figure 77: Latin America Market Y-o-Y Growth (%) Projections by Adhesive Type, 2025-2035
  • Figure 78: Latin America Market Value (USD Billion) Analysis by Label Format, 2020-2035
  • Figure 79: Latin America Market Volume (Units) Analysis by Label Format, 2020-2035
  • Figure 80: Latin America Market Value Share (%) and BPS Analysis by Label Format, 2025-2035
  • Figure 81: Latin America Market Y-o-Y Growth (%) Projections by Label Format, 2025-2035
  • Figure 82: Latin America Market Value (USD Billion) Analysis by End-Use Industry, 2020-2035
  • Figure 83: Latin America Market Volume (Units) Analysis by End-Use Industry, 2020-2035
  • Figure 84: Latin America Market Value Share (%) and BPS Analysis by End-Use Industry, 2025-2035
  • Figure 85: Latin America Market Y-o-Y Growth (%) Projections by End-Use Industry, 2025-2035
  • Figure 86: Latin America Market Attractiveness by Material Type, 2025-2035
  • Figure 87: Latin America Market Attractiveness by Adhesive Type, 2025-2035
  • Figure 88: Latin America Market Attractiveness by Label Format, 2025-2035
  • Figure 89: Latin America Market Attractiveness by End-Use Industry, 2025-2035
  • Figure 90: Latin America Market Attractiveness by Country, 2025-2035
  • Figure 91: East Asia Market Value (USD Billion) by Material Type, 2025-2035
  • Figure 92: East Asia Market Value (USD Billion) by Adhesive Type, 2025-2035
  • Figure 93: East Asia Market Value (USD Billion) by Label Format, 2025-2035
  • Figure 94: East Asia Market Value (USD Billion) by End-Use Industry, 2025-2035
  • Figure 95: East Asia Market Value (USD Billion) by Country, 2025-2035
  • Figure 96: East Asia Market Value (USD Billion) Analysis by Country, 2020-2035
  • Figure 97: East Asia Market Volume (Units) Analysis by Country, 2020-2035
  • Figure 98: East Asia Market Value Share (%) and BPS Analysis by Country, 2025-2035
  • Figure 99: East Asia Market Y-o-Y Growth (%) Projections by Country, 2025-2035
  • Figure 100: East Asia Market Value (USD Billion) Analysis by Material Type, 2020-2035
  • Figure 101: East Asia Market Volume (Units) Analysis by Material Type, 2020-2035
  • Figure 102: East Asia Market Value Share (%) and BPS Analysis by Material Type, 2025-2035
  • Figure 103: East Asia Market Y-o-Y Growth (%) Projections by Material Type, 2025-2035
  • Figure 104: East Asia Market Value (USD Billion) Analysis by Adhesive Type, 2020-2035
  • Figure 105: East Asia Market Volume (Units) Analysis by Adhesive Type, 2020-2035
  • Figure 106: East Asia Market Value Share (%) and BPS Analysis by Adhesive Type, 2025-2035
  • Figure 107: East Asia Market Y-o-Y Growth (%) Projections by Adhesive Type, 2025-2035
  • Figure 108: East Asia Market Value (USD Billion) Analysis by Label Format, 2020-2035
  • Figure 109: East Asia Market Volume (Units) Analysis by Label Format, 2020-2035
  • Figure 110: East Asia Market Value Share (%) and BPS Analysis by Label Format, 2025-2035
  • Figure 111: East Asia Market Y-o-Y Growth (%) Projections by Label Format, 2025-2035
  • Figure 112: East Asia Market Value (USD Billion) Analysis by End-Use Industry, 2020-2035
  • Figure 113: East Asia Market Volume (Units) Analysis by End-Use Industry, 2020-2035
  • Figure 114: East Asia Market Value Share (%) and BPS Analysis by End-Use Industry, 2025-2035
  • Figure 115: East Asia Market Y-o-Y Growth (%) Projections by End-Use Industry, 2025-2035
  • Figure 116: East Asia Market Attractiveness by Material Type, 2025-2035
  • Figure 117: East Asia Market Attractiveness by Adhesive Type, 2025-2035
  • Figure 118: East Asia Market Attractiveness by Label Format, 2025-2035
  • Figure 119: East Asia Market Attractiveness by End-Use Industry, 2025-2035
  • Figure 120: East Asia Market Attractiveness by Country, 2025-2035
  • Figure 121: South Asia & Pacific Market Value (USD Billion) by Material Type, 2025-2035
  • Figure 122: South Asia & Pacific Market Value (USD Billion) by Adhesive Type, 2025-2035
  • Figure 123: South Asia & Pacific Market Value (USD Billion) by Label Format, 2025-2035
  • Figure 124: South Asia & Pacific Market Value (USD Billion) by End-Use Industry, 2025-2035
  • Figure 125: South Asia & Pacific Market Value (USD Billion) by Country, 2025-2035
  • Figure 126: South Asia & Pacific Market Value (USD Billion) Analysis by Country, 2020-2035
  • Figure 127: South Asia & Pacific Market Volume (Units) Analysis by Country, 2020-2035
  • Figure 128: South Asia & Pacific Market Value Share (%) and BPS Analysis by Country, 2025-2035
  • Figure 129: South Asia & Pacific Market Y-o-Y Growth (%) Projections by Country, 2025-2035
  • Figure 130: South Asia & Pacific Market Value (USD Billion) Analysis by Material Type, 2020-2035
  • Figure 131: South Asia & Pacific Market Volume (Units) Analysis by Material Type, 2020-2035
  • Figure 132: South Asia & Pacific Market Value Share (%) and BPS Analysis by Material Type, 2025-2035
  • Figure 133: South Asia & Pacific Market Y-o-Y Growth (%) Projections by Material Type, 2025-2035
  • Figure 134: South Asia & Pacific Market Value (USD Billion) Analysis by Adhesive Type, 2020-2035
  • Figure 135: South Asia & Pacific Market Volume (Units) Analysis by Adhesive Type, 2020-2035
  • Figure 136: South Asia & Pacific Market Value Share (%) and BPS Analysis by Adhesive Type, 2025-2035
  • Figure 137: South Asia & Pacific Market Y-o-Y Growth (%) Projections by Adhesive Type, 2025-2035
  • Figure 138: South Asia & Pacific Market Value (USD Billion) Analysis by Label Format, 2020-2035
  • Figure 139: South Asia & Pacific Market Volume (Units) Analysis by Label Format, 2020-2035
  • Figure 140: South Asia & Pacific Market Value Share (%) and BPS Analysis by Label Format, 2025-2035
  • Figure 141: South Asia & Pacific Market Y-o-Y Growth (%) Projections by Label Format, 2025-2035
  • Figure 142: South Asia & Pacific Market Value (USD Billion) Analysis by End-Use Industry, 2020-2035
  • Figure 143: South Asia & Pacific Market Volume (Units) Analysis by End-Use Industry, 2020-2035
  • Figure 144: South Asia & Pacific Market Value Share (%) and BPS Analysis by End-Use Industry, 2025-2035
  • Figure 145: South Asia & Pacific Market Y-o-Y Growth (%) Projections by End-Use Industry, 2025-2035
  • Figure 146: South Asia & Pacific Market Attractiveness by Material Type, 2025-2035
  • Figure 147: South Asia & Pacific Market Attractiveness by Adhesive Type, 2025-2035
  • Figure 148: South Asia & Pacific Market Attractiveness by Label Format, 2025-2035
  • Figure 149: South Asia & Pacific Market Attractiveness by End-Use Industry, 2025-2035
  • Figure 150: South Asia & Pacific Market Attractiveness by Country, 2025-2035
  • Figure 151: Europe Market Value (USD Billion) by Material Type, 2025-2035
  • Figure 152: Europe Market Value (USD Billion) by Adhesive Type, 2025-2035
  • Figure 153: Europe Market Value (USD Billion) by Label Format, 2025-2035
  • Figure 154: Europe Market Value (USD Billion) by End-Use Industry, 2025-2035
  • Figure 155: Europe Market Value (USD Billion) by Country, 2025-2035
  • Figure 156: Europe Market Value (USD Billion) Analysis by Country, 2020-2035
  • Figure 157: Europe Market Volume (Units) Analysis by Country, 2020-2035
  • Figure 158: Europe Market Value Share (%) and BPS Analysis by Country, 2025-2035
  • Figure 159: Europe Market Y-o-Y Growth (%) Projections by Country, 2025-2035
  • Figure 160: Europe Market Value (USD Billion) Analysis by Material Type, 2020-2035
  • Figure 161: Europe Market Volume (Units) Analysis by Material Type, 2020-2035
  • Figure 162: Europe Market Value Share (%) and BPS Analysis by Material Type, 2025-2035
  • Figure 163: Europe Market Y-o-Y Growth (%) Projections by Material Type, 2025-2035
  • Figure 164: Europe Market Value (USD Billion) Analysis by Adhesive Type, 2020-2035
  • Figure 165: Europe Market Volume (Units) Analysis by Adhesive Type, 2020-2035
  • Figure 166: Europe Market Value Share (%) and BPS Analysis by Adhesive Type, 2025-2035
  • Figure 167: Europe Market Y-o-Y Growth (%) Projections by Adhesive Type, 2025-2035
  • Figure 168: Europe Market Value (USD Billion) Analysis by Label Format, 2020-2035
  • Figure 169: Europe Market Volume (Units) Analysis by Label Format, 2020-2035
  • Figure 170: Europe Market Value Share (%) and BPS Analysis by Label Format, 2025-2035
  • Figure 171: Europe Market Y-o-Y Growth (%) Projections by Label Format, 2025-2035
  • Figure 172: Europe Market Value (USD Billion) Analysis by End-Use Industry, 2020-2035
  • Figure 173: Europe Market Volume (Units) Analysis by End-Use Industry, 2020-2035
  • Figure 174: Europe Market Value Share (%) and BPS Analysis by End-Use Industry, 2025-2035
  • Figure 175: Europe Market Y-o-Y Growth (%) Projections by End-Use Industry, 2025-2035
  • Figure 176: Europe Market Attractiveness by Material Type, 2025-2035
  • Figure 177: Europe Market Attractiveness by Adhesive Type, 2025-2035
  • Figure 178: Europe Market Attractiveness by Label Format, 2025-2035
  • Figure 179: Europe Market Attractiveness by End-Use Industry, 2025-2035
  • Figure 180: Europe Market Attractiveness by Country, 2025-2035
  • Figure 181: Middle East & Africa Market Value (USD Billion) by Material Type, 2025-2035
  • Figure 182: Middle East & Africa Market Value (USD Billion) by Adhesive Type, 2025-2035
  • Figure 183: Middle East & Africa Market Value (USD Billion) by Label Format, 2025-2035
  • Figure 184: Middle East & Africa Market Value (USD Billion) by End-Use Industry, 2025-2035
  • Figure 185: Middle East & Africa Market Value (USD Billion) by Country, 2025-2035
  • Figure 186: Middle East & Africa Market Value (USD Billion) Analysis by Country, 2020-2035
  • Figure 187: Middle East & Africa Market Volume (Units) Analysis by Country, 2020-2035
  • Figure 188: Middle East & Africa Market Value Share (%) and BPS Analysis by Country, 2025-2035
  • Figure 189: Middle East & Africa Market Y-o-Y Growth (%) Projections by Country, 2025-2035
  • Figure 190: Middle East & Africa Market Value (USD Billion) Analysis by Material Type, 2020-2035
  • Figure 191: Middle East & Africa Market Volume (Units) Analysis by Material Type, 2020-2035
  • Figure 192: Middle East & Africa Market Value Share (%) and BPS Analysis by Material Type, 2025-2035
  • Figure 193: Middle East & Africa Market Y-o-Y Growth (%) Projections by Material Type, 2025-2035
  • Figure 194: Middle East & Africa Market Value (USD Billion) Analysis by Adhesive Type, 2020-2035
  • Figure 195: Middle East & Africa Market Volume (Units) Analysis by Adhesive Type, 2020-2035
  • Figure 196: Middle East & Africa Market Value Share (%) and BPS Analysis by Adhesive Type, 2025-2035
  • Figure 197: Middle East & Africa Market Y-o-Y Growth (%) Projections by Adhesive Type, 2025-2035
  • Figure 198: Middle East & Africa Market Value (USD Billion) Analysis by Label Format, 2020-2035
  • Figure 199: Middle East & Africa Market Volume (Units) Analysis by Label Format, 2020-2035
  • Figure 200: Middle East & Africa Market Value Share (%) and BPS Analysis by Label Format, 2025-2035
  • Figure 201: Middle East & Africa Market Y-o-Y Growth (%) Projections by Label Format, 2025-2035
  • Figure 202: Middle East & Africa Market Value (USD Billion) Analysis by End-Use Industry, 2020-2035
  • Figure 203: Middle East & Africa Market Volume (Units) Analysis by End-Use Industry, 2020-2035
  • Figure 204: Middle East & Africa Market Value Share (%) and BPS Analysis by End-Use Industry, 2025-2035
  • Figure 205: Middle East & Africa Market Y-o-Y Growth (%) Projections by End-Use Industry, 2025-2035
  • Figure 206: Middle East & Africa Market Attractiveness by Material Type, 2025-2035
  • Figure 207: Middle East & Africa Market Attractiveness by Adhesive Type, 2025-2035
  • Figure 208: Middle East & Africa Market Attractiveness by Label Format, 2025-2035
  • Figure 209: Middle East & Africa Market Attractiveness by End-Use Industry, 2025-2035
  • Figure 210: Middle East & Africa Market Attractiveness by Country, 2025-2035

Frequently Asked Questions

How big is the recyclability certified labels and adhesives market in 2025?

The global recyclability certified labels and adhesives market is estimated to be valued at USD 1.3 billion in 2025.

What will be the size of the recyclability certified labels and adhesives market in 2035?

The market size for the recyclability certified labels and adhesives market is projected to reach USD 2.6 billion by 2035.

How much will be the recyclability certified labels and adhesives market growth between 2025 and 2035?

The recyclability certified labels and adhesives market is expected to grow at a CAGR of 7.2% between 2025 and 2035.

What are the key adhesive types in the recyclability certified labels and adhesives market?

The key adhesive types in the recyclability certified labels and adhesives market include water-based adhesives, hot-melt adhesives, solvent-based adhesives, acrylic adhesives, and bio-based adhesives.

Which adhesive type segment is expected to contribute significant share in the recyclability certified labels and adhesives market in 2025?

The water-based adhesives segment is projected to account for the highest share of 42.3% in the recyclability certified labels and adhesives market in 2025.

Explore Similar Insights

Future Market Insights

Recyclability Certified Labels and Adhesives Market

Chat With

MaRIA

Hi There, I am MaRIA, Your Market Research Intelligence Assistant. How may I help you?