

- Market Size (2026)
- USD 1700.0 Mn
- Forecast (2036)
- USD 3500.0 Mn
- CAGR (2026 to 2036)
- 7.5%
How big is the Reduced-Sugar Guilt-Free Confectionery Ingredients Market in 2026?
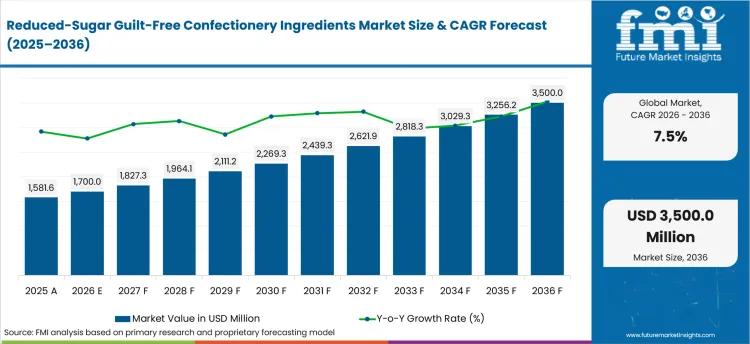
USD 1700.0 million in 2026 and USD 3500.0 million by 2036 at a 7.5% CAGR.
Sales of reduced-sugar guilt-free confectionery ingredients are estimated to rise at 7.5% CAGR through 2036. Valuation is projected to increase from USD 1700.0 million in 2026 to USD 3500.0 million by 2036. Brands need ingredient systems that replace sweetness and rebuild bulk after sucrose removal changes texture. The International Food Information Council reported in December 2025 that 75% of Americans were actively trying to limit or avoid sugar. That preference keeps confectionery ingredient demand tied to sensory proof and repeatable plant trials before recipes move into routine production.
Gulf accounts are anticipated to emphasize label clarity and premium eating quality during sugar-reduction work. North American accounts are projected to place more weight on scale-up support because production runs expose texture drift quickly. Formulators must evaluate sweetness onset and cooling effect before replacing sugar in chocolate or gummies. The National Confectioners Association reported in March 2025 that United States confectionery sales exceeded USD 54 billion during 2024. That commercial base increases the cost of weak reformulation because established brands cannot accept avoidable changes in bite or flavor release. Ingredient companies serving low-calorie sweetener adoption are expected to compete on application testing and factory transfer support.
| Metric | Value |
|---|---|
| 2025 Market Size | USD 1581.6 million |
| 2026 Market Size | USD 1700.0 million |
| 2036 Market Size | USD 3500.0 million |
| Forecast CAGR (2026-2036) | 7.5% |
| Solution Focus | Polyol Blends |
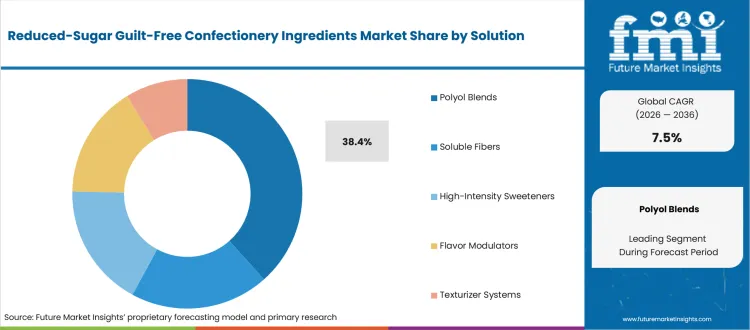
| Polyol Blends Share (2026) | 38.4% |
| Confectionery Type Focus | Chocolate |
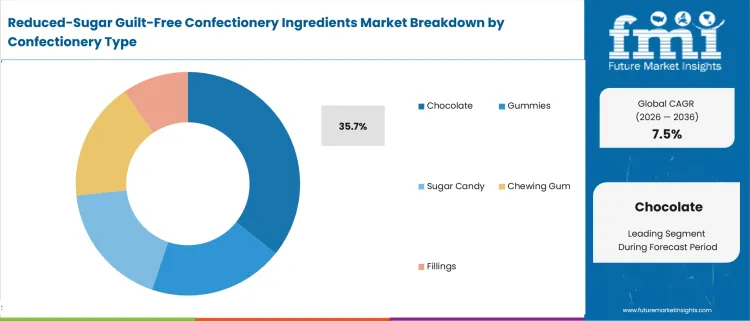
| Chocolate Share (2026) | 35.7% |
| Label Driver Focus | Sugar-Free |
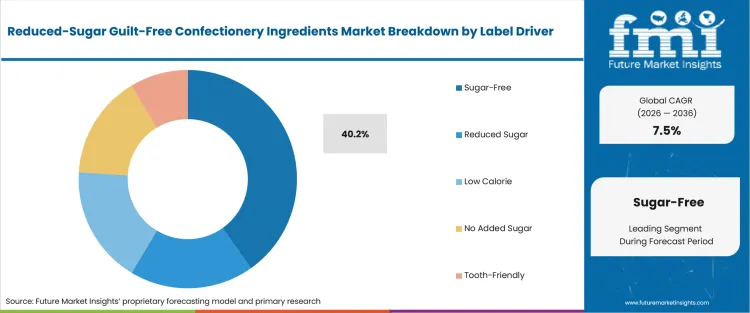
| Sugar-Free Share (2026) | 40.2% |
| Fastest-growing Country | United Arab Emirates |
| United Arab Emirates CAGR by 2036 | 8.0% |
Summary of the Reduced-Sugar Guilt-Free Confectionery Ingredients Market
| Market Signal | Commercial Impact |
|---|---|
| Demand and Growth Drivers | Reformulation spending is expected to center on sweetness repair and texture rebuilding across established confectionery lines.
|
| Product and Segment View | Disclosed shares point to industrial recipes that favor dry handling and familiar claim language during commercial scale-up.
|
| Geography and Growth Outlook | Country demand is expected to diverge according to tax design, retail structure, and local processing scale.
|
| Competitive Landscape | Competition is expected to depend on how well suppliers connect sweetness with texture and sensory troubleshooting.
|
| Analyst Perspective | Recipe approval depends on rebuilding the sweetness and bulk functions that sugar provides across each confectionery format. Plant-scale evidence is the practical bottleneck because bench sweetness does not prove chew or melt stability.
|
Source: FMI's proprietary forecasting model and primary research
How is the reduced-sugar guilt-free confectionery ingredients market segmented?
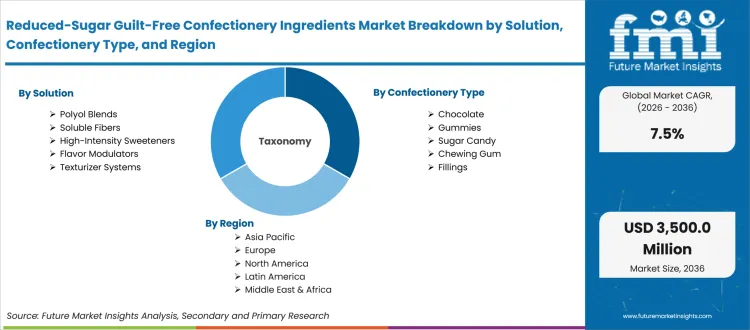
The reduced-sugar guilt-free confectionery ingredients industry is segmented by Solution, Confectionery Type, Label Driver, Form, End Use, and Region.
By Solution, the market covers Polyol Blends, Soluble Fibers, High-Intensity Sweeteners, Flavor Modulators, and Texturizer Systems. Confectionery Type includes Chocolate, Gummies, Sugar Candy, Chewing Gum, and Fillings. Label Driver covers Sugar-Free, Reduced Sugar, Low Calorie, No Added Sugar, and Tooth-Friendly positioning. Form spans Powder Systems, Liquid Blends, Granules, Premixes, and Syrups. End Use includes Industrial Confectioners, Artisanal Brands, Private Label, and Foodservice accounts. The FDA stated in January 2025 that a sample mixed-product Healthy claim limit includes 5 grams of added sugar. Regional coverage follows how these choices affect sugar confectionery formulation across North America, Latin America, Europe, Asia Pacific, the Middle East, and Africa.
What supports polyol blend demand within the Solution category?
Polyol systems solve a physical recipe problem because sucrose contributes bulk before it contributes sweetness. BENEO listed an Isomalt crystal concept for sugar-free confectionery manufacturing in May 2025 for product developers testing hard candy formats. The application evidence keeps crystallization behavior and cooling effect inside the supplier review before a recipe reaches commercial scale. Confectioners compare blend ratios against process temperature and target bite before commercial approval for repeat production runs.
- By Solution, Polyol Blends are estimated to hold 38.4% share in 2026 because confectioners need bulk replacement and moisture control alongside sweetness. Formulators are expected to adjust ratios for hardness and cooling effect before line approval so the blend supports both sensory targets and repeat processing across commercial batches.
- Candy formulators are projected to compare polyol combinations across hard candy and filled products because digestive tolerance and cooling effect vary by recipe. Technical teams are expected to first test crystallization behavior and sweetness release before scale-up so sugar-free candy development remains connected to claim planning and finished-product sensory acceptance.
How does chocolate shape purchasing within the Confectionery Type category?
Reduced-sugar chocolate requires a different balance of sweetness and cocoa flavor because sucrose removal changes melt and flavor release. The National Confectioners Association reported in March 2026 that United States confectionery sales reached USD 55 billion in 2025. Scale across the category raises the commercial value of formulations that protect familiar texture during line transfer and repeat production across factory sites.
- In 2026, chocolate is projected to account for 35.7% of confectionery type demand due to controlled sweetness and stable melt requirements. Chocolate makers are expected to test viscosity and flavor release before approving reduced-sugar systems so production transfer does not create a brittle bite or delayed sweetness across batches.
- Chocolate manufacturers are expected to assess viscosity and cooling effect before approving polyol or fiber combinations for molded products. Supplier teams are anticipated to support tempering and filling checks because process shifts often alter texture. Flow or sweetness changes after molding are expected to delay internal approval across commercial batches.
What drives sugar-free positioning within the Label Driver category?
Sugar-free positioning starts with regulatory fit before marketing teams finalize front-of-pack language for national retail channels. Tate & Lyle announced in July 2025 that four IFT FIRST prototypes would demonstrate sugar reduction and fiber fortification. The development shows why claim goals are tested beside mouthfeel and texture before launch approval.
- Sugar-Free is forecast to represent 40.2% of label driver demand in 2026 because the claim gives shoppers a direct description of the recipe change. Regulatory teams are expected to confirm permitted sweetener uses before planned launch so the finished formula and pack language stay aligned across national retail channels.
- Brand and regulatory teams are anticipated to verify claim conditions before purchasing decisions and production planning begin. Review of gummy formulation trends is expected to continue because sweetener choice often alters chew and flavor release. Formulators need claim checks and sensory trials to move together before commercial scale-up begins.
How are powder systems positioned within the Form category?
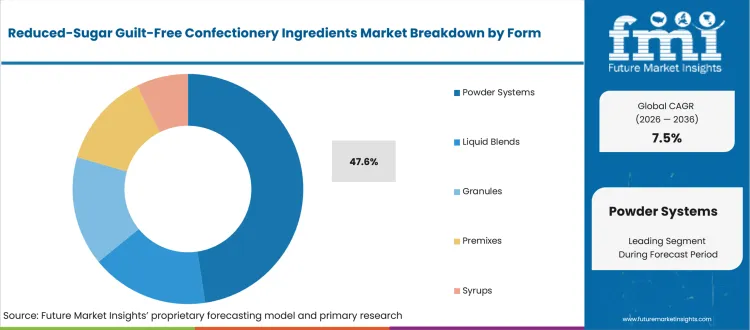
Powder systems fit plants that want measured additions without managing extra liquid during dry preblending. Jungbunzlauer described in December 2025 that ERYLITE grades include granular and powder options for formulation and scale-up. Grade choice affects flow behavior and dissolution during line trials across different mixing and dosing systems. Operations teams compare handling needs before approving a premix format for routine production across repeated commercial batches.
- The form category is anticipated to be led by powder systems at 47.6% share in 2026 owing to storage simplicity and controlled plant dosing. Operations teams are expected to compare flow and dissolution before approval so dry premixes disperse predictably during cocoa mixing or gummy preparation across commercial production.
- Plant operators are projected to favor powders for cocoa mixes and gummy premixes when layout supports staged addition. Liquid blends are expected to remain relevant for fillings or syrups where direct dispersion reduces extra mixing.
What keeps industrial confectioners relevant within the End Use category?
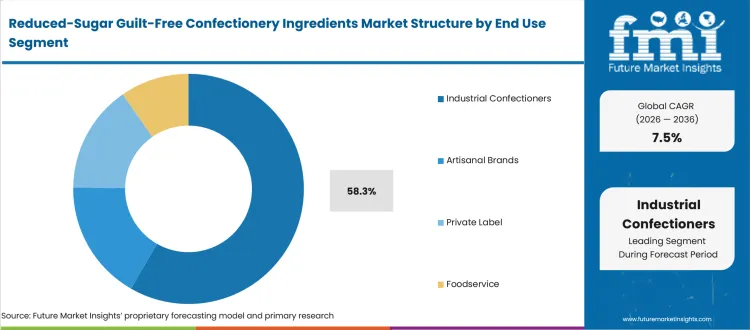
Large confectionery plants expose ingredient systems to repeated batches and tighter change control than small pilot kitchens. Cargill reported in November 2025 that its APAC IngredienTracker covered 2,000 respondents across chocolate and sweetener research. Regional consumer evidence helps ingredient companies build sensory insight into support for commercial formulation teams. Industrial accounts need recipe transfer data before a formulation reaches multiple lines and repeat production schedules across facilities.
- Industrial Confectioners are estimated to account for 58.3% share in 2026 because repeat production requires controlled dosing and documented trial support. Large processing plants are expected to demand transfer data across batches so sweetness and texture remain consistent after a formula moves from pilot work into routine commercial production.
- Factory formulation teams are expected to assess batch consistency and service response before replacing an approved sweetener system. Private-label developers are projected to value faster support because calendars compress time for sensory and packaging review.
What are the drivers, restraints, and opportunities in the reduced-sugar guilt-free confectionery ingredients market?
Sugar reduction targets support reformulation demand while sensory gaps slow approval and integrated recipe systems create account expansion routes.
- Driver: Consumer efforts to reduce added sugar are expected to keep confectionery reformulation active across chocolate and candy portfolios.
- Restraint: Sweetener replacement is anticipated to slow when cooling effect or bitterness and texture loss remain unresolved during plant trials.
- Opportunity: Ingredient companies are projected to expand account value by combining sweetness repair with bulk replacement and application support.
Health guidance and shopper behavior are expected to keep sugar reduction inside product renovation programs. The World Health Organization stated in August 2025 that free sugars should remain below 10% of total energy intake. Confectionery makers need formulations that lower sugar without turning a treat into an unfamiliar product. The pressure is expected to sustain industrial sweetener sourcing across polyols and fibers alongside high-intensity sweeteners because manufacturers need different functional roles from one recipe system.
Sensory failure is expected to remain the main brake on commercial conversion because sugar controls more than sweetness. Ingredion reported in November 2025 that 64% of consumers are actively trying to reduce sugar intake. The same company guidance identifies taste and texture preservation as scale-up constraints during commercial recipe conversion work. Formulators comparing stevia formulation options are projected to test sweetness timing and aftertaste beside bulk replacement before approving a production recipe.
Integrated systems are projected to create a practical route around the restraint because one supplier coordinates sweetness and mouthfeel trials. The FDA explained in June 2026 that Nutrition Facts information and updated claim policies are designed to help consumers evaluate food choices. That policy direction raises the value of recipes that connect label goals with credible eating quality. Application teams are expected to package sweetener blends with texture support and dosage guidance to shorten reformulation loops for confectioners.
Which country CAGRs are profiled in the reduced-sugar guilt-free confectionery ingredients market?
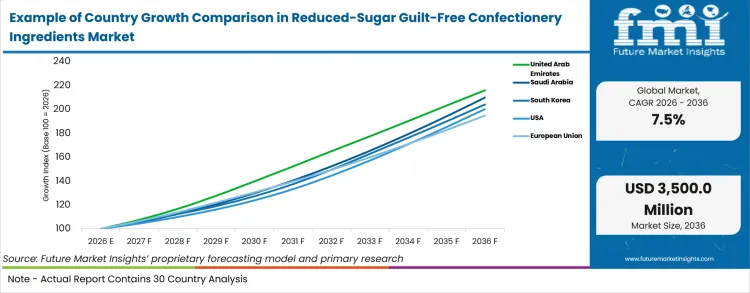
| Country | CAGR |
|---|---|
| United Arab Emirates | 8.0% |
| Saudi Arabia | 7.7% |
| South Korea | 7.4% |
| United States | 7.2% |
| European Union | 6.9% |
| Japan | 6.6% |
| Canada | 6.4% |
Source: FMI's proprietary forecasting model and primary research
How do country-level CAGRs compare in the reduced-sugar guilt-free confectionery ingredients market?
Country demand is expected to differ according to tax rules and label controls alongside retail channels and local processing scale. Gulf markets are projected to connect sugar reduction with excise treatment and premium retail positioning. South Korea and Japan are anticipated to reward quick sensory adaptation across frequent product refreshes. North American and European accounts are expected to emphasize regulatory files and plant-scale evidence during supplier approval. The National Confectioners Association reported in October 2025 that Gen Z candy spending increased 47% year over year. That purchasing shift keeps sugar alcohol systems relevant across country portfolios that serve different texture and sweetness preferences.
- Premium retail and imported confectionery make the United Arab Emirates a practical Gulf test market for sugar-free recipes. The market is projected to expand at 8.0% CAGR through 2036 under continued premium retail testing and regional reformulation activity. In October 2025 the Federal Tax Authority defined a high-sugar drink category at 8 grams or more per 100 ml under its tiered model. Although the rule covers drinks the compliance direction keeps sugar-content documentation visible for regional formulation teams. The Federal Tax Authority remains a central local reference for excise compliance and product classification across regulated categories. Importers are expected to favor suppliers that provide stable specifications and application guidance suited to premium chocolate or gummy launches.
- Saudi Arabia is moving sweetened product taxation toward a formula that responds to sugar content instead of one fixed retail-price rate. The Saudi market is anticipated to rise at 7.7% CAGR through 2036 as local portfolios adapt to revised excise treatment. The Saudi Press Agency reported in December 2025 that amended excise rules would take effect on January 1 2026. That timing gives confectionery groups a nearby policy signal when regional portfolios share recipes with sweetened beverage lines. ZATCA is expected to shape compliance interpretation alongside local importers and distributors that manage regional confectionery portfolios. Suppliers are projected to gain approval more easily when sweetness systems include clear technical files and predictable landed-cost support.
- South Korean confectionery launches often compete on texture and format novelty within a dense retail environment. The market is projected to record 7.4% CAGR through 2036 as short launch cycles keep formulation support commercially relevant. USDA Foreign Agricultural Service reported in May 2025 that Korean retail food sales reached USD 132 billion in 2024. The scale of packaged food retail supports short product cycles and frequent recipe screening across national confectionery channels. Local processors and large retail groups are expected to value suppliers that respond quickly during gummy texture trials. Formulation support is projected to focus on chew stability and sweetness release before wider channel rollout.
- United States accounts combine large confectionery production with detailed nutrition labeling requirements and national retail scale. Formulators must connect ingredient choice with declared added sugar on the finished pack before national retail distribution begins. The market is expected to expand at 7.2% CAGR through 2036 as formulation teams balance label compliance with sensory targets. The FDA stated in March 2026 that the Daily Value for added sugars is 50 grams. FDA guidance remains a practical checkpoint for brand and regulatory teams during recipe approval and pack review.
- European confectionery groups operate under additive approvals that affect sweetener selection and heat-processing decisions during recipe development. Technical review starts before a supplier reaches plant-scale trials or commits resources to wider customer qualification work. EFSA confirmed in February 2026 that the acceptable daily intake for sucralose remained 15 mg/kg of body weight per day. The European Union market is forecast to advance at 6.9% CAGR through 2036 under continued regulatory scrutiny and recipe reformulation. The assessment keeps EFSA evidence central to regulatory review across sugar-free product programs that use high-intensity sweeteners. .
- Japan rewards compact formats and careful sensory balance across convenience stores and supermarket confectionery shelves. Retail channel structure affects pack size and the speed of recipe refreshes across national product portfolios. USDA Foreign Agricultural Service reported in November 2025 that Japanese retail food sales totaled USD 193 billion in 2024. The market is estimated to grow at 6.6% CAGR through 2036 as product refreshes reward precise sensory balance and dosage control. Manufacturers and importers are expected to compare sweetness quality against familiar chocolate and gum expectations.
- Canada combines a concentrated processing base with national sweetener permissions and bilingual packaging requirements for broad retail distribution. Formula teams align ingredient records with packaging review before products move into national channels. The market is projected to register 6.4% CAGR through 2036 as industrial accounts balance regulatory fit with supply continuity. USDA Foreign Agricultural Service reported in April 2025 that Canadian food and beverage processing sales reached USD 116 billion in 2024. That processing base gives ingredient companies access to industrial accounts that require stable recipe transfer across facilities.
Who are the notable companies in the reduced-sugar guilt-free confectionery ingredients market?
Cargill, dsm-firmenich, Tate & Lyle, Ingredion, Kerry, Roquette, BENEO, ADM, and Jungbunzlauer are the notable companies shaping this market.
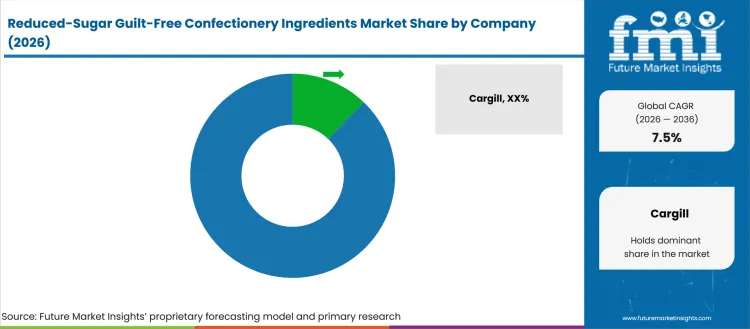
Competition centers on a supplier’s ability to replace several sugar functions without forcing confectioners to manage separate trials. Broader portfolio coverage creates value when application teams explain cooling effect alongside bulk loss during confectionery formulation trials. Application teams must also address sweetness timing and process fit before a formulation receives commercial approval. Tate & Lyle described its June 2025 reformulation focus across sweetness and texture alongside fiber solutions. Portfolio overlap explains why dietary fiber ingredients enter the same technical review as polyols and taste modulators.
- Cargill and ADM focus on broad sweetener toolkits that support multi-ingredient reformulation across chocolate and candy portfolios. Their account advantage is expected to depend on how quickly technical teams connect sweetness replacement with process conditions and repeat sensory proof.
- Taste repair gives dsm-firmenich and Kerry a distinct competitive basis in recipes that use high-intensity sweeteners. Both companies serve accounts where high-intensity sweeteners need masking or sweetness timing correction before a lower-sugar confectionery recipe gains internal approval.
- Bulk replacement places Roquette and BENEO close to recipes that need polyols or fibers after sucrose removal. Their commercial fit is projected to depend on application guidance across hard candy and gummies as well as chocolate systems.
- Ingredient specialists such as Jungbunzlauer and Ingredion are expected to compete where precise sweetener behavior determines recipe acceptance. Soluble corn fiber applications broaden the formulation options when teams need bulk and texture alongside sweetness control.
Competitive Benchmarking: Reduced-Sugar Guilt-Free Confectionery Ingredients Market
| Company | Portfolio Relevance | Taste and Texture Support | Account Access | Footprint or Service Reach |
|---|---|---|---|---|
| Cargill | High | High | High | Global |
| dsm-firmenich | High | High | High | Global |
| Tate & Lyle | High | High | High | Global |
| Ingredion | High | High | High | Global |
| Kerry | High | High | High | Global |
| Roquette | High | High | High | Global |
| BENEO | High | High | High | Global |
| ADM | High | High | High | Global |
| Jungbunzlauer | Medium | Medium | High | Global |
Source: Future Market Insights competitive analysis, 2026. Ratings reflect relative portfolio relevance and workflow fit. Service capability and geographic reach shape the remaining comparison.
Key Developments in the Reduced-Sugar Guilt-Free Confectionery Ingredients Market
- In September 2025, Cargill announced that EverSweet stevia sweetener had been named a finalist in the Global Good Awards. The company stated that the product had approvals in several markets and adoption among food and beverage brands.
- In July 2025, Ingredion showcased sugar-reduced and fiber-fortified prototypes during IFT FIRST 2025 for food and beverage product developers. The presentation linked sweetener choice with texture design and scale-up support across health-focused food development.
- In March 2025, dsm-firmenich published its sugar-reduction approach around TastePRINT and related taste tools for food and beverage formulation teams. The company described sweetness timing and off-note control as formulation tasks when sugar is reduced.
- In June 2026, BENEO launched its Sweets Box collection for sugar-free confectionery concepts aimed at product developers and manufacturers. The collection used Isomalt across hard candy prototypes and paired product samples with application information for manufacturers.
Key Players in the Reduced-Sugar Guilt-Free Confectionery Ingredients Market
Integrated Sweetener and Texture Systems
- Cargill
- ADM
- Tate & Lyle
- Ingredion
Taste Modulation and Sensory Support
- dsm-firmenich
- Kerry
Polyol and Functional Carbohydrate Specialists
- Roquette
- BENEO
- Jungbunzlauer
Reduced-Sugar Guilt-Free Confectionery Ingredients Market - Report Scope
| Coverage field | Report scope |
|---|---|
| Market breakdown | Solution, Confectionery Type, Label Driver, Form, and End Use. |
| Quantitative Units | Revenue in USD Million and CAGR in %. |
| Market Definition | Ingredients used to reduce sugar in confectionery while supporting sweetness, bulk, texture, and flavor performance. |
| Regions Covered | North America, Latin America, Europe, Asia Pacific, the Middle East, and Africa. |
| Countries Covered | United Arab Emirates, Saudi Arabia, South Korea, United States, European Union, Japan, and Canada. |
| Key Companies Profiled | Cargill, dsm-firmenich, Tate & Lyle, Ingredion, Kerry, Roquette, BENEO, ADM, and Jungbunzlauer. |
| Forecast Period | 2026 to 2036. |
| Approach | Primary interviews and desk research support bottom-up sizing and validation against supply and demand indicators. |
Source: Future Market Insights - analysis driven by proprietary forecasting models and primary research
Reduced-Sugar Guilt-Free Confectionery Ingredients Market - Research Methodology
| Method | Approach |
|---|---|
| Primary Research | Structured interviews with ingredient suppliers, confectionery manufacturers, distributors, and technical formulation teams test commercial assumptions. |
| Desk Research | Official regulators, government sources, trade associations, and company disclosures establish market context and verify external evidence. |
| Market Sizing and Forecasting | A bottom-up model estimates demand by segment and geography then reconciles totals against production and channel evidence. |
| Data Validation | Triangulation compares primary interview findings with official data and company evidence before the forecast assumptions are finalized. |
Source: Future Market Insights (FMI) analysis, based on proprietary forecasting model and primary research
Reduced-Sugar Guilt-Free Confectionery Ingredients Market by Segments
Reduced-Sugar Guilt-Free Confectionery Ingredients Market segmented by Solution:
- Polyol Blends
- Soluble Fibers
- High-Intensity Sweeteners
- Flavor Modulators
- Texturizer Systems
Reduced-Sugar Guilt-Free Confectionery Ingredients Market segmented by Confectionery Type:
- Chocolate
- Gummies
- Sugar Candy
- Chewing Gum
- Fillings
Reduced-Sugar Guilt-Free Confectionery Ingredients Market segmented by Label Driver:
- Sugar-Free
- Reduced Sugar
- Low Calorie
- No Added Sugar
- Tooth-Friendly
Reduced-Sugar Guilt-Free Confectionery Ingredients Market segmented by Form:
- Powder Systems
- Liquid Blends
- Granules
- Premixes
- Syrups
Reduced-Sugar Guilt-Free Confectionery Ingredients Market segmented by End Use:
- Industrial Confectioners
- Artisanal Brands
- Private Label
- Foodservice
Reduced-Sugar Guilt-Free Confectionery Ingredients Market by Region:
- North America
- United States
- Canada
- Europe
- Germany
- United Kingdom
- France
- Italy
- Spain
- Asia Pacific
- India
- China
- Japan
- South Korea
- Australia
- Latin America
- Brazil
- Argentina
- Mexico
- Chile
- Middle East & Africa
- UAE
- Saudi Arabia
- South Africa
Research Sources and Bibliography
- International Food Information Council. (2025, December). Americans Scrutinize Sugar Consumption As Holiday Season Begins, New IFIC Research Finds. International Food Information Council.
- National Confectioners Association. (2025, March). Confectionery Sales Break Records, Surpass $54 Billion in 2024. National Confectioners Association.
- USA Food and Drug Administration. (2025, January). Use of the “Healthy” Claim on Food Labeling. USA Food and Drug Administration.
- BENEO. (2025, May). A breathtaking escape - Double the flavour, double the fun! BENEO.
- National Confectioners Association. (2026, March). Confectionery Sales Climb to $55 Billion in 2025. National Confectioners Association.
- Tate & Lyle. (2025, July). Tate & Lyle debuts expanded portfolio and mouthfeel leadership at IFT FIRST 2025. Tate & Lyle.
- Jungbunzlauer. (2025, December). ERYLITE® Erythritol for Manufacturers. Jungbunzlauer.
- Ingredion. (2025, November). Solutions for reduced-sugar products: Meeting consumer trends at scale. Ingredion.
- Cargill. (2025, November). Cargill APAC IngredienTracker™ 2025 assessed consumer attitudes towards 91 ingredients across four groups: Chocolate & Cocoa, Sweeteners, Texturizers, and Fats & Oils. Cargill.
- World Health Organization. (2025, August). Sugars and dental caries. World Health Organization.
- USA Food and Drug Administration. (2026, June). Know Your Nutrition: Empowering Women to Make Informed Food Choices. USA Food and Drug Administration.
- USA Food and Drug Administration. (2026, March). Added Sugars on the Nutrition Facts Label. USA Food and Drug Administration.
- National Confectioners Association. (2025, October). Candy Sales to Hit $27.8 Billion by 2030. National Confectioners Association.
- Federal Tax Authority. (2025, October). Federal Tax Authority Clarifies New Tiered Volumetric Model for Applying Excise Tax on Sweetened Drinks. Federal Tax Authority.
- Saudi Press Agency. (2025, December). Amendments to Executive Regulations of Excise Tax to Take Effect January 1, 2026. Saudi Press Agency.
- USA Department of Agriculture Foreign Agricultural Service. (2025, May). South Korea: Food Processing Ingredients Annual. USA Department of Agriculture.
- European Food Safety Authority. (2026, February). EFSA finds sucralose safe when used as currently authorised; cannot confirm safety of extending its use. European Food Safety Authority.
- USA Department of Agriculture Foreign Agricultural Service. (2025, November). Japan: Retail Foods Annual. USA Department of Agriculture.
- USA Department of Agriculture Foreign Agricultural Service. (2025, April). Canada: Food Processing Ingredients Annual. USA Department of Agriculture.
- Tate & Lyle. (2025, June). Tate & Lyle PLC Annual Report 2025. Tate & Lyle.
- Cargill. (2025, September). Cargill’s EverSweet stevia sweetener named a finalist in the 2025 Global Good Awards Game Changing Innovation of the Year. Cargill.
- Ingredion. (2025, July). Ingredion at IFT FIRST 2025 - Connecting texture, health and innovation. Ingredion.
- dsm-firmenich. (2025, March). How we’re making less sugar a sweeter deal. dsm-firmenich.
- BENEO. (2026, June). BENEO launches collection of inspirational sugar-free confectionery concepts to boost category innovation. BENEO.
This bibliography is provided for reader reference and uses primary government sources and standards-body references. Official trade bodies and company sources support the remaining market evidence.
This Report Answers
- What is the estimated market value in 2026 and the projected value by 2036?
- What CAGR is the market projected to record across the forecast period?
- How is the market structured across its five parent categories and their subsegments?
- Which formulation problems are expected to sustain demand for reduced-sugar confectionery ingredient systems?
- How do regulation and processing scale influence country CAGR differences across different retail channel structures?
- Which technical capabilities are expected to separate suppliers during confectionery reformulation work?
- How does FMI validate market size and forecast assumptions across primary and desk research?
- What should formulation and product development teams assess before approving a sweetener or texture system?
- How do labeling and additive rules affect recipe design and supplier qualification in major markets?
Frequently Asked Questions
What is driving growth in the Reduced-Sugar Guilt-Free Confectionery Ingredients Market?
Confectionery brands are reformulating recipes to lower sugar while preserving sweetness and texture across established chocolate and candy portfolios. Demand is expected to favor ingredient systems that combine bulk replacement with taste correction and practical plant support.
Who are the key players in the Reduced-Sugar Guilt-Free Confectionery Ingredients Market?
Notable participants include Cargill, dsm-firmenich, Tate & Lyle, Ingredion, Kerry, Roquette, BENEO, ADM, and Jungbunzlauer. Competition centers on formulation breadth, sensory troubleshooting, application support, and specification control during commercial scale-up work.
What is a significant restraint in the Reduced-Sugar Guilt-Free Confectionery Ingredients Market?
Sugar removal often creates cooling effects and bitterness while weakening body or changing chew during commercial processing trials. Commercial approval is expected to slow when a formulation performs well at bench scale but changes during factory processing.
Why should executives track the Reduced-Sugar Guilt-Free Confectionery Ingredients Market?
The market connects product renovation with labeling pressure and changing sweetness preferences across confectionery portfolios. Executives need visibility because recipe decisions affect ingredient cost and brand positioning together with production risk.
What business problem does the Reduced-Sugar Guilt-Free Confectionery Ingredients Market address?
The market helps confectioners lower sugar without losing the physical and sensory functions that sucrose provides. Ingredient systems rebuild sweetness and bulk while correcting texture or flavor balance for confectionery products at commercial production scale.
What should procurement leaders evaluate before selecting suppliers?
Procurement leaders should compare specification consistency and sensory proof alongside dosage guidance and plant trial support. Regulatory documentation and regional service access are expected to shape approval where recipes move across several production sites.
What limits return on investment for purchasers?
Returns weaken when repeated trials fail to resolve texture drift or aftertaste before a recipe reaches commercial scale. Extra line work and delayed commercialization are expected to extend payback periods when supplier support does not transfer from laboratory recipes to factory conditions.
How do suppliers build long-term account confidence?
Suppliers build confidence by proving repeatable recipe performance and maintaining clear technical files alongside responsive troubleshooting. Repeat purchasing is expected to favor partners that support scale-up and regulatory review without changing agreed specifications.
Preview the report firsthand - request a free sample
Get SampleGet the brochure for pricing and purchase details.
Get PDFTable of Content
- Key Takeaways
- Market Size and CAGR
- Top Growth Driver
- Fastest Growing Segment
- Leading Region
- Key Companies
- Emerging Opportunities
- Executive Summary
- Global Market Outlook
- Demand-side Trends
- Supply-side Trends
- Technology Roadmap Analysis
- Analysis and Recommendations
- Analyst Perspective (What is happening? Why now? What should investors know?)
- Key Questions Answered
- How large is the market?
- What is the CAGR?
- What are key trends?
- Which region dominates?
- Who are the leaders?
- Market Overview
- Market Coverage / Taxonomy
- Market Definition / Scope / Limitations
- Research Methodology
- Chapter Orientation
- Analytical Lens and Working Hypotheses
- Market Structure, Signals, and Trend Drivers
- Benchmarking and Cross-market Comparability
- Market Sizing, Forecasting, and Opportunity Mapping
- Research Design and Evidence Framework
- Desk Research Programme (Secondary Evidence)
- Expert Input and Fieldwork (Primary Evidence)
- Tooling, Models, and Reference Databases
- Data Engineering and Model Build
- Quality Assurance and Audit Trail
- Market Background
- Market Dynamics (Drivers, Restraints, Opportunity, Trends)
- Scenario Forecast (Optimistic, Likely, Conservative)
- Impact Analysis
- AI Impact
- Sustainability Impact
- Regulatory Impact
- Technology Impact
- Consumer / Buyer Analysis
- Purchase Drivers
- Adoption Barriers
- Buyer Journey
- Opportunity Map Analysis
- Product Life Cycle Analysis
- Supply Chain Analysis
- Investment Feasibility Matrix
- Value Chain Analysis
- PESTLE and Porter's Analysis
- Regulatory Landscape
- Regional Parent Market Outlook
- Production and Consumption Statistics
- Import and Export Statistics
- Global Market Analysis and Forecast, 2021 to 2036
- Historical Market Size Value (USD Million) Analysis, 2021 to 2025
- Current and Future Market Size Value (USD Million) Projections, 2026 to 2036
- Y-o-Y Growth Trend Analysis
- Absolute $ Opportunity Analysis
- Global Market Pricing Analysis, 2021 to 2036
- Global Market Analysis and Forecast, By Solution, 2021 to 2036
- Introduction / Key Findings
- Historical Market Size Value (USD Million) Analysis By Solution, 2021 to 2025
- Current and Future Market Size Value (USD Million) Analysis and Forecast By Solution, 2026 to 2036
- Polyol Blends
- Soluble Fibers
- High-Intensity Sweeteners
- Flavor Modulators
- Texturizer Systems
- Polyol Blends
- Y-o-Y Growth Trend Analysis By Solution, 2021 to 2025
- Absolute $ Opportunity Analysis By Solution, 2026 to 2036
- Global Market Analysis and Forecast, By Confectionery Type, 2021 to 2036
- Introduction / Key Findings
- Historical Market Size Value (USD Million) Analysis By Confectionery Type, 2021 to 2025
- Current and Future Market Size Value (USD Million) Analysis and Forecast By Confectionery Type, 2026 to 2036
- Chocolate
- Gummies
- Sugar Candy
- Chewing Gum
- Fillings
- Chocolate
- Y-o-Y Growth Trend Analysis By Confectionery Type, 2021 to 2025
- Absolute $ Opportunity Analysis By Confectionery Type, 2026 to 2036
- Global Market Analysis and Forecast, By Label Driver, 2021 to 2036
- Introduction / Key Findings
- Historical Market Size Value (USD Million) Analysis By Label Driver, 2021 to 2025
- Current and Future Market Size Value (USD Million) Analysis and Forecast By Label Driver, 2026 to 2036
- Sugar-Free
- Reduced Sugar
- Low Calorie
- No Added Sugar
- Tooth-Friendly
- Sugar-Free
- Y-o-Y Growth Trend Analysis By Label Driver, 2021 to 2025
- Absolute $ Opportunity Analysis By Label Driver, 2026 to 2036
- Global Market Analysis and Forecast, By Form, 2021 to 2036
- Introduction / Key Findings
- Historical Market Size Value (USD Million) Analysis By Form, 2021 to 2025
- Current and Future Market Size Value (USD Million) Analysis and Forecast By Form, 2026 to 2036
- Powder Systems
- Liquid Blends
- Granules
- Premixes
- Syrups
- Powder Systems
- Y-o-Y Growth Trend Analysis By Form, 2021 to 2025
- Absolute $ Opportunity Analysis By Form, 2026 to 2036
- Global Market Analysis and Forecast, By End Use, 2021 to 2036
- Introduction / Key Findings
- Historical Market Size Value (USD Million) Analysis By End Use, 2021 to 2025
- Current and Future Market Size Value (USD Million) Analysis and Forecast By End Use, 2026 to 2036
- Industrial Confectioners
- Artisanal Brands
- Private Label
- Foodservice
- Industrial Confectioners
- Y-o-Y Growth Trend Analysis By End Use, 2021 to 2025
- Absolute $ Opportunity Analysis By End Use, 2026 to 2036
- Global Market Analysis and Forecast, By Region, 2021 to 2036
- Introduction
- Historical Market Size Value (USD Million) Analysis By Region, 2021 to 2025
- Current Market Size Value (USD Million) Analysis and Forecast By Region, 2026 to 2036
- North America
- Latin America
- Western Europe
- Eastern Europe
- East Asia
- South Asia and Pacific
- Middle East & Africa
- Market Attractiveness Analysis By Region
- North America Market Analysis and Forecast, By Country, 2021 to 2036
- Historical Market Size Value (USD Million) Trend Analysis By Market Taxonomy, 2021 to 2025
- Market Size Value (USD Million) Forecast By Market Taxonomy, 2026 to 2036
- By Country
- USA
- Canada
- By Solution
- By Confectionery Type
- By Label Driver
- By Form
- By End Use
- By Country
- Market Attractiveness Analysis
- By Country
- By Solution
- By Confectionery Type
- By Label Driver
- By Form
- By End Use
- Key Takeaways
- Latin America Market Analysis and Forecast, By Country
- Historical Market Size Value (USD Million) Trend Analysis By Market Taxonomy, 2021 to 2025
- Market Size Value (USD Million) Forecast By Market Taxonomy, 2026 to 2036
- By Country
- Brazil
- Mexico
- Chile
- Rest of Latin America
- By Solution
- By Confectionery Type
- By Label Driver
- By Form
- By End Use
- By Country
- Market Attractiveness Analysis
- By Country
- By Solution
- By Confectionery Type
- By Label Driver
- By Form
- By End Use
- Key Takeaways
- Western Europe Market Analysis and Forecast, By Country
- Historical Market Size Value (USD Million) Trend Analysis By Market Taxonomy, 2021 to 2025
- Market Size Value (USD Million) Forecast By Market Taxonomy, 2026 to 2036
- By Country
- Germany
- UK
- Italy
- Spain
- France
- Nordic
- BENELUX
- Rest of Western Europe
- By Solution
- By Confectionery Type
- By Label Driver
- By Form
- By End Use
- By Country
- Market Attractiveness Analysis
- By Country
- By Solution
- By Confectionery Type
- By Label Driver
- By Form
- By End Use
- Key Takeaways
- Eastern Europe Market Analysis and Forecast, By Country
- Historical Market Size Value (USD Million) Trend Analysis By Market Taxonomy, 2021 to 2025
- Market Size Value (USD Million) Forecast By Market Taxonomy, 2026 to 2036
- By Country
- Russia
- Poland
- Hungary
- Balkan & Baltic
- Rest of Eastern Europe
- By Solution
- By Confectionery Type
- By Label Driver
- By Form
- By End Use
- By Country
- Market Attractiveness Analysis
- By Country
- By Solution
- By Confectionery Type
- By Label Driver
- By Form
- By End Use
- Key Takeaways
- East Asia Market Analysis and Forecast, By Country
- Historical Market Size Value (USD Million) Trend Analysis By Market Taxonomy, 2021 to 2025
- Market Size Value (USD Million) Forecast By Market Taxonomy, 2026 to 2036
- By Country
- China
- Japan
- South Korea
- By Solution
- By Confectionery Type
- By Label Driver
- By Form
- By End Use
- By Country
- Market Attractiveness Analysis
- By Country
- By Solution
- By Confectionery Type
- By Label Driver
- By Form
- By End Use
- Key Takeaways
- South Asia and Pacific Market Analysis and Forecast, By Country
- Historical Market Size Value (USD Million) Trend Analysis By Market Taxonomy, 2021 to 2025
- Market Size Value (USD Million) Forecast By Market Taxonomy, 2026 to 2036
- By Country
- India
- ASEAN
- Australia & New Zealand
- Rest of South Asia and Pacific
- By Solution
- By Confectionery Type
- By Label Driver
- By Form
- By End Use
- By Country
- Market Attractiveness Analysis
- By Country
- By Solution
- By Confectionery Type
- By Label Driver
- By Form
- By End Use
- Key Takeaways
- Middle East & Africa Market Analysis and Forecast, By Country
- Historical Market Size Value (USD Million) Trend Analysis By Market Taxonomy, 2021 to 2025
- Market Size Value (USD Million) Forecast By Market Taxonomy, 2026 to 2036
- By Country
- Kingdom of Saudi Arabia
- Other GCC Countries
- Türkiye
- South Africa
- Other African Union
- Rest of Middle East & Africa
- By Solution
- By Confectionery Type
- By Label Driver
- By Form
- By End Use
- By Country
- Market Attractiveness Analysis
- By Country
- By Solution
- By Confectionery Type
- By Label Driver
- By Form
- By End Use
- Key Takeaways
- Key Countries Market Analysis
- USA
- Pricing Analysis
- Market Share Analysis, 2025
- By Solution
- By Confectionery Type
- By Label Driver
- By Form
- By End Use
- Canada
- Pricing Analysis
- Market Share Analysis, 2025
- By Solution
- By Confectionery Type
- By Label Driver
- By Form
- By End Use
- Mexico
- Pricing Analysis
- Market Share Analysis, 2025
- By Solution
- By Confectionery Type
- By Label Driver
- By Form
- By End Use
- Brazil
- Pricing Analysis
- Market Share Analysis, 2025
- By Solution
- By Confectionery Type
- By Label Driver
- By Form
- By End Use
- Chile
- Pricing Analysis
- Market Share Analysis, 2025
- By Solution
- By Confectionery Type
- By Label Driver
- By Form
- By End Use
- Germany
- Pricing Analysis
- Market Share Analysis, 2025
- By Solution
- By Confectionery Type
- By Label Driver
- By Form
- By End Use
- UK
- Pricing Analysis
- Market Share Analysis, 2025
- By Solution
- By Confectionery Type
- By Label Driver
- By Form
- By End Use
- Italy
- Pricing Analysis
- Market Share Analysis, 2025
- By Solution
- By Confectionery Type
- By Label Driver
- By Form
- By End Use
- Spain
- Pricing Analysis
- Market Share Analysis, 2025
- By Solution
- By Confectionery Type
- By Label Driver
- By Form
- By End Use
- France
- Pricing Analysis
- Market Share Analysis, 2025
- By Solution
- By Confectionery Type
- By Label Driver
- By Form
- By End Use
- India
- Pricing Analysis
- Market Share Analysis, 2025
- By Solution
- By Confectionery Type
- By Label Driver
- By Form
- By End Use
- ASEAN
- Pricing Analysis
- Market Share Analysis, 2025
- By Solution
- By Confectionery Type
- By Label Driver
- By Form
- By End Use
- Australia & New Zealand
- Pricing Analysis
- Market Share Analysis, 2025
- By Solution
- By Confectionery Type
- By Label Driver
- By Form
- By End Use
- China
- Pricing Analysis
- Market Share Analysis, 2025
- By Solution
- By Confectionery Type
- By Label Driver
- By Form
- By End Use
- Japan
- Pricing Analysis
- Market Share Analysis, 2025
- By Solution
- By Confectionery Type
- By Label Driver
- By Form
- By End Use
- South Korea
- Pricing Analysis
- Market Share Analysis, 2025
- By Solution
- By Confectionery Type
- By Label Driver
- By Form
- By End Use
- Russia
- Pricing Analysis
- Market Share Analysis, 2025
- By Solution
- By Confectionery Type
- By Label Driver
- By Form
- By End Use
- Poland
- Pricing Analysis
- Market Share Analysis, 2025
- By Solution
- By Confectionery Type
- By Label Driver
- By Form
- By End Use
- Hungary
- Pricing Analysis
- Market Share Analysis, 2025
- By Solution
- By Confectionery Type
- By Label Driver
- By Form
- By End Use
- Kingdom of Saudi Arabia
- Pricing Analysis
- Market Share Analysis, 2025
- By Solution
- By Confectionery Type
- By Label Driver
- By Form
- By End Use
- Türkiye
- Pricing Analysis
- Market Share Analysis, 2025
- By Solution
- By Confectionery Type
- By Label Driver
- By Form
- By End Use
- South Africa
- Pricing Analysis
- Market Share Analysis, 2025
- By Solution
- By Confectionery Type
- By Label Driver
- By Form
- By End Use
- USA
- Market Structure Analysis
- Competition Dashboard
- Competition Benchmarking
- Market Share Analysis of Top Players
- By Regional
- By Solution
- By Confectionery Type
- By Label Driver
- By Form
- By End Use
- Emerging Startups
- Innovation Benchmarking
- Competition Analysis
- Competition Deep Dive
- Cargill
- Overview
- Product Portfolio
- Profitability by Market Segments
- Sales Footprint
- Strategy Overview
- Marketing Strategy
- Product Strategy
- Channel Strategy
- dsm-firmenich
- Tate & Lyle
- Ingredion
- Kerry
- Roquette
- BENEO
- ADM
- Jungbunzlauer
- Cargill
- Case Studies
- Success Stories
- Recent Developments
- Competition Deep Dive
- Assumptions & Acronyms Used


