Rigid Sleeve Boxes Market
Market Insights on Rigid Sleeve Boxes covering sales outlook, demand forecast & up-to-date key trends
Rigid Sleeve Boxes Market by Product Type, Process, Material, Application, End Use & Region - Forecast 2022 - 2032
Rigid Sleeve Boxes Market Outlook (2022-2032)
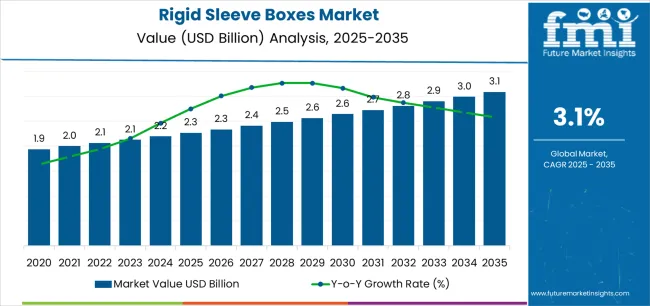
[250 Pages Report] The global rigid sleeve boxes market is poised to reach US$ 4 Bn by 2022. The sales of rigid sleeve boxes are estimated to create an incremental opportunity of more than 5.5 Bn by the end of 2032. Driven by increasing customer inclination towards adoption of luxury packaging solutions, the demand for rigid sleeve boxes is expected to expand at a CAGR of 4% to 5% during the forecast period 2022-2032.
Report Attribute |
Details |
Rigid Sleeve Boxes Market Value (2021) |
US$ 3.7 Billion |
Rigid Sleeve Boxes Market Estimated Value (2022) |
US$ 4 Billion |
Rigid Sleeve Boxes Market Anticipated Value (2032) |
US$ 5.5 Billion |
Rigid Sleeve Boxes Market Projected Growth Rate (2022-2032) |
4% to 5% CAGR |
Rigid sleeve boxes, also known as belly band boxes or set up boxes, are high-end luxury packaging boxes that side out of their covers and add uniqueness to the product. There are a wide variety of rigid sleeve boxes available in the market such as hinged lids, slipcases, drawer boxes, detachable lids, and others.
These boxes are non-collapsible or foldable and sturdier, hence they help in protecting delicate consumable, electronic, and retail products.
Let us know your requirement to get
100% FREE customization
Which are Some Key Drivers Augmenting the Rigid Sleeve Boxes Market Growth?
There is a swift rise in customer inclination towards adoption of paper-based packaging solutions such as rigid sleeve boxes across various industries such as personal care & cosmetics, consumer electronics, food & beverages, and others. This is anticipated to facilitate the growth in the global market.
In addition to this, increasing leading player emphasis on providing customizable and multi-purpose paper-based packaging solutions is anticipated to augment the growth in the rigid sleeve boxes market.
What are the Major Constraints Creating Difficult Roads for the Rigid Sleeve Boxes Market Growth?
High cost of rigid sleeve boxes, availability of low-cost substitutes such as corrugated boxes, and increasing adoption of moister-resistant & flexible packaging solutions for multiple products are factors hampering the sales in the global market.
Also, a number of governmental and environmental protection organizations across several countries are emphasizing on implementing a set of stringent regulations and standards regarding plastic packaging, due to the growing concerns pertaining to environmental sustainability. This is hinder the sales across the plastics segment.
Find your sweet spots for generating winning opportunities in this market.
Talk to AnalystWhy is North America Accounting for the Leading Share in the Global Rigid Sleeve Boxes Market?
As per Future Market Insights, North America is projected to emerge as the high remunerative rigid sleeve boxes market between 2022 and 2032.
There is a significant rise in sales of consumer electronics such as smartphones, laptops, tablets, and others, especially in the countries such as the U.S. and Canada, owing to the growing disposable income and rising tech-savvy population.
For instance, according to a study by the GSM Association, around 323 million people, or approximately 81% of the total population across North America were reported to be using smartphones in the year 2020. As rigid sleeve boxes are extensively used for packaging smartphones, increasing sales of these products are anticipated to favor the growth in the North America market.
What are the Sales Prospects of Rigid Sleeve Boxes in the Europe Market?
Europe is forecast to emerge as the project the growth at a robust CAGR in the global rigid sleeve boxes market during the forecast period 2022-2032.
With growing customer inclination towards adopting products with innovative & luxurious packaging, industry players across the countries such as the U.K., Germany, Switzerland, and others are increasingly adopting high-end luxury packaging boxes.
For instance, a number of players in the market are increasingly emphasizing on launching new customized luxury rigid sleeve boxes with different coatings and lamination – glossy, matt, and metallic. This is anticipated to drive the growth of the rigid sleeve boxes market in Europe.

An unified Market Research Subscription Platform, built for today’s disparate research needs.
Market Competition
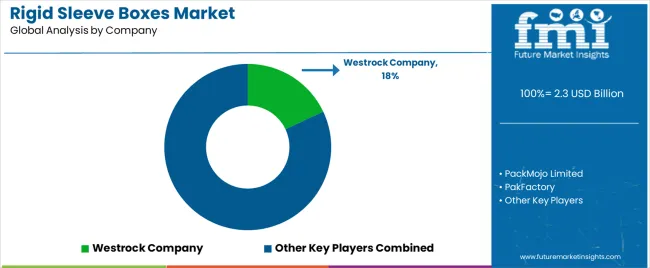
Some of the leading players in the rigid sleeve boxes market are Bleubird packaging, Pak Factory, BlueBox Packaging, Brimar Packaging, Napco, Furong Box, and others.
Leading players in the global rigid sleeve boxes market are aiming at adopting strategies such as new product launches, collaboration, agreement, merger, and acquisition to increasing their share in the highly competitive market.
Report Scope
Report Attribute |
Details |
Growth Rate |
CAGR of 4% to 5% from 2022 to 2032 |
Base Year for Estimation |
2021 |
Historical Data |
2015-2020 |
Forecast Period |
2022-2032 |
Quantitative Units |
Revenue in USD Billion, Volume in Kilotons and CAGR from 2022-2032 |
Report Coverage |
Revenue Forecast, Volume Forecast, Company Ranking, Competitive Landscape, Growth Factors, Trends and Pricing Analysis |
Segments Covered |
|
Countries Covered |
|
Key Companies Profiled |
|
Customization |
Available Upon Request |
Key Segments Profiled in the Rigid Sleeve Boxes Market Survey
By Product Type:
- Hinged lid
- Detachable lid
- Slide / Slipcases
- Partial cover
- Magnetic Lock
- Others (Angle Boxes, and Drawer Boxes)
By Process:
- Embossing
- Debossing
- Foil Stamping
- Window Patching
By Material:
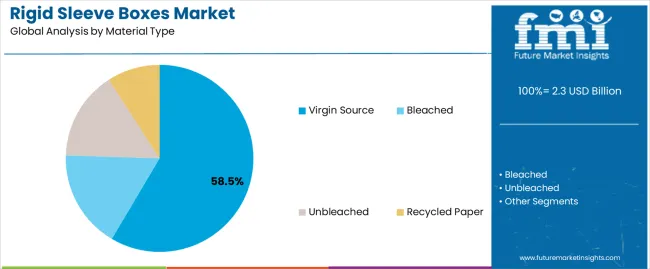
- Paper and Cardboard
- Plastic
- Metal
By Application:
- Retail Boxes
- Die Cut Boxes
- Display Boxes
- Others
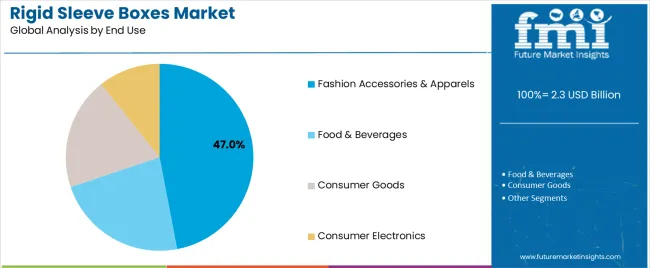
By End Use:
- Food and Beverages
- Electric and Electronics
- Cosmetics and Personal Care
- Manufacturing
- Pharmaceuticals and Health cares
- Others ( Jewelry)
By Region:
- North America
- Latin America
- Europe
- East Asia
- South Asia
- Oceania
- Middle East and Africa
Frequently Asked Questions
FMI projects the sales of rigid sleeve boxes in the market is expected to rise at 4% to 5% value CAGR by 2032.
The global rigid sleeve boxes market is anticipated to be dominated by North America over the forecast period 2022-2032.
Bleubird packaging, Pak Factory, BlueBox Packaging, Brimar Packaging, Napco, Furong Box, and others some of the leading players in the global rigid sleeve boxes market.
1. Executive Summary
1.1. Global Market Outlook
1.2. Demand-side Trends
1.3. Supply-side Trends
1.4. Technology Roadmap Analysis
1.5. Analysis and Recommendations
2. Market Overview
2.1. Market Coverage / Taxonomy
2.2. Market Definition / Scope / Limitations
3. Market Background
3.1. Market Dynamics
3.1.1. Drivers
3.1.2. Restraints
3.1.3. Opportunity
3.1.4. Trends
3.2. Scenario Forecast
3.2.1. Demand in Optimistic Scenario
3.2.2. Demand in Likely Scenario
3.2.3. Demand in Conservative Scenario
3.3. Opportunity Map Analysis
3.4. Product Life Cycle Analysis
3.5. Supply Chain Analysis
3.5.1. Supply Side Participants and their Roles
3.5.1.1. Producers
3.5.1.2. Mid-Level Participants (Traders/ Agents/ Brokers)
3.5.1.3. Wholesalers and Distributors
3.5.2. Value Added and Value Created at Node in the Supply Chain
3.5.3. List of Raw Material Suppliers
3.5.4. List of Existing and Potential Buyer’s
3.6. Investment Feasibility Matrix
3.7. Value Chain Analysis
3.7.1. Profit Margin Analysis
3.7.2. Wholesalers and Distributors
3.7.3. Retailers
3.8. PESTLE and Porter’s Analysis
3.9. Regulatory Landscape
3.9.1. By Key Regions
3.9.2. By Key Countries
3.10. Regional Parent Market Outlook
3.11. Production and Consumption Statistics
3.12. Import and Export Statistics
4. Global Rigid Sleeves Boxes Market Analysis 2017-2021 and Forecast, 2022-2032
4.1. Historical Market Size Value (US$ Mn) & Volume (Units) Analysis, 2017-2021
4.2. Current and Future Market Size Value (US$ Mn) & Volume (Units) Projections, 2022-2032
4.2.1. Y-o-Y Growth Trend Analysis
4.2.2. Absolute $ Opportunity Analysis
5. Global Rigid Sleeves Boxes Market Analysis 2017-2021 and Forecast 2022-2032, By Product Type
5.1. Introduction / Key Findings
5.2. Historical Market Size Value (US$ Mn) & Volume (Units) Analysis By Product Type, 2017-2021
5.3. Current and Future Market Size Value (US$ Mn) & Volume (Units) Analysis and Forecast By Product Type, 2022-2032
5.3.1. Hinged Lid
5.3.2. Detachable Lid
5.3.3. Slide / Slipcases
5.3.4. Partial Cover
5.3.5. Magnetic Lock
5.3.6. Other Product Types
5.4. Y-o-Y Growth Trend Analysis By Product Type, 2017-2021
5.5. Absolute $ Opportunity Analysis By Product Type, 2022-2032
6. Global Rigid Sleeves Boxes Market Analysis 2017-2021 and Forecast 2022-2032, By Process
6.1. Introduction / Key Findings
6.2. Historical Market Size Value (US$ Mn) & Volume (Units) Analysis By Process, 2017-2021
6.3. Current and Future Market Size Value (US$ Mn) & Volume (Units) Analysis and Forecast By Process, 2022-2032
6.3.1. Embossing
6.3.2. Debossing
6.3.3. Foil Stamping
6.3.4. Window Patching
6.4. Y-o-Y Growth Trend Analysis By Process, 2017-2021
6.5. Absolute $ Opportunity Analysis By Process, 2022-2032
7. Global Rigid Sleeves Boxes Market Analysis 2017-2021 and Forecast 2022-2032, By Material
7.1. Introduction / Key Findings
7.2. Historical Market Size Value (US$ Mn) & Volume (Units) Analysis By Material, 2017-2021
7.3. Current and Future Market Size Value (US$ Mn) & Volume (Units) Analysis and Forecast By Material, 2022-2032
7.3.1. Paper and Cardboard
7.3.2. Plastic
7.3.3. Metal
7.4. Y-o-Y Growth Trend Analysis By Material, 2017-2021
7.5. Absolute $ Opportunity Analysis By Material, 2022-2032
8. Global Rigid Sleeves Boxes Market Analysis 2017-2021 and Forecast 2022-2032, By Application
8.1. Introduction / Key Findings
8.2. Historical Market Size Value (US$ Mn) & Volume (Units) Analysis By Application , 2017-2021
8.3. Current and Future Market Size Value (US$ Mn) & Volume (Units) Analysis and Forecast By Application , 2022-2032
8.3.1. Retail Boxes
8.3.2. Die Cut Boxes
8.3.3. Display Boxes
8.3.4. Other Applications
8.4. Y-o-Y Growth Trend Analysis By Application , 2017-2021
8.5. Absolute $ Opportunity Analysis By Application , 2022-2032
9. Global Rigid Sleeves Boxes Market Analysis 2017-2021 and Forecast 2022-2032, By End Use
9.1. Introduction / Key Findings
9.2. Historical Market Size Value (US$ Mn) & Volume (Units) Analysis By End Use, 2017-2021
9.3. Current and Future Market Size Value (US$ Mn) & Volume (Units) Analysis and Forecast By End Use, 2022-2032
9.3.1. Food and Beverages
9.3.2. Electric and Electronics
9.3.3. Cosmetics and Personal Care
9.3.4. Manufacturing
9.3.5. Pharmaceuticals and Healthcare
9.3.6. Others
9.4. Y-o-Y Growth Trend Analysis By End Use, 2017-2021
9.5. Absolute $ Opportunity Analysis By End Use, 2022-2032
10. Global Rigid Sleeves Boxes Market Analysis 2017-2021 and Forecast 2022-2032, By Region
10.1. Introduction
10.2. Historical Market Size Value (US$ Mn) & Volume (Units) Analysis By Region, 2017-2021
10.3. Current Market Size Value (US$ Mn) & Volume (Units) Analysis and Forecast By Region, 2022-2032
10.3.1. North America
10.3.2. Latin America
10.3.3. Europe
10.3.4. East Asia
10.3.5. South Asia & Pacific
10.3.6. MEA
10.4. Market Attractiveness Analysis By Region
11. North America Rigid Sleeves Boxes Market Analysis 2017-2021 and Forecast 2022-2032, By Country
11.1. Historical Market Size Value (US$ Mn) & Volume (Units) Trend Analysis By Market Taxonomy, 2017-2021
11.2. Market Size Value (US$ Mn) & Volume (Units) Forecast By Market Taxonomy, 2022-2032
11.2.1. By Country
11.2.1.1. U.S.
11.2.1.2. Canada
11.2.2. By Product Type
11.2.3. By Process
11.2.4. By Material
11.2.5. By Application
11.2.6. By End Use
11.3. Market Attractiveness Analysis
11.3.1. By Country
11.3.2. By Product Type
11.3.3. By Process
11.3.4. By Material
11.3.5. By Application
11.3.6. By End Use
11.4. Key Takeaways
12. Latin America Rigid Sleeves Boxes Market Analysis 2017-2021 and Forecast 2022-2032, By Country
12.1. Historical Market Size Value (US$ Mn) & Volume (Units) Trend Analysis By Market Taxonomy, 2017-2021
12.2. Market Size Value (US$ Mn) & Volume (Units) Forecast By Market Taxonomy, 2022-2032
12.2.1. By Country
12.2.1.1. Mexico
12.2.1.2. Brazil
12.2.1.3. Rest of Latin America
12.2.2. By Product Type
12.2.3. By Process
12.2.4. By Material
12.2.5. By Application
12.2.6. By End Use
12.3. Market Attractiveness Analysis
12.3.1. By Country
12.3.2. By Product Type
12.3.3. By Process
12.3.4. By Material
12.3.5. By Application
12.3.6. By End Use
12.4. Key Takeaways
13. Europe Rigid Sleeves Boxes Market Analysis 2017-2021 and Forecast 2022-2032, By Country
13.1. Historical Market Size Value (US$ Mn) & Volume (Units) Trend Analysis By Market Taxonomy, 2017-2021
13.2. Market Size Value (US$ Mn) & Volume (Units) Forecast By Market Taxonomy, 2022-2032
13.2.1. By Country
13.2.1.1. Germany
13.2.1.2. Italy
13.2.1.3. France
13.2.1.4. U.K.
13.2.1.5. Spain
13.2.1.6. BENELUX
13.2.1.7. Russia
13.2.1.8. Rest of Europe
13.2.2. By Product Type
13.2.3. By Process
13.2.4. By Material
13.2.5. By Application
13.2.6. By End Use
13.3. Market Attractiveness Analysis
13.3.1. By Country
13.3.2. By Product Type
13.3.3. By Process
13.3.4. By Material
13.3.5. By Application
13.3.6. By End Use
13.4. Key Takeaways
14. East Asia Rigid Sleeves Boxes Market Analysis 2017-2021 and Forecast 2022-2032, By Country
14.1. Historical Market Size Value (US$ Mn) & Volume (Units) Trend Analysis By Market Taxonomy, 2017-2021
14.2. Market Size Value (US$ Mn) & Volume (Units) Forecast By Market Taxonomy, 2022-2032
14.2.1. By Country
14.2.1.1. China
14.2.1.2. Japan
14.2.1.3. South Korea
14.2.2. By Product Type
14.2.3. By Process
14.2.4. By Material
14.2.5. By Application
14.2.6. By End Use
14.3. Market Attractiveness Analysis
14.3.1. By Country
14.3.2. By Product Type
14.3.3. By Process
14.3.4. By Material
14.3.5. By Application
14.3.6. By End Use
14.4. Key Takeaways
15. South Asia & Pacific Rigid Sleeves Boxes Market Analysis 2017-2021 and Forecast 2022-2032, By Country
15.1. Historical Market Size Value (US$ Mn) & Volume (Units) Trend Analysis By Market Taxonomy, 2017-2021
15.2. Market Size Value (US$ Mn) & Volume (Units) Forecast By Market Taxonomy, 2022-2032
15.2.1. By Country
15.2.1.1. India
15.2.1.2. ASEAN
15.2.1.3. Australia and New Zealand
15.2.1.4. Rest of South Asia & Pacific
15.2.2. By Product Type
15.2.3. By Process
15.2.4. By Material
15.2.5. By Application
15.2.6. By End Use
15.3. Market Attractiveness Analysis
15.3.1. By Country
15.3.2. By Product Type
15.3.3. By Process
15.3.4. By Material
15.3.5. By Application
15.3.6. By End Use
15.4. Key Takeaways
16. MEA Rigid Sleeves Boxes Market Analysis 2017-2021 and Forecast 2022-2032, By Country
16.1. Historical Market Size Value (US$ Mn) & Volume (Units) Trend Analysis By Market Taxonomy, 2017-2021
16.2. Market Size Value (US$ Mn) & Volume (Units) Forecast By Market Taxonomy, 2022-2032
16.2.1. By Country
16.2.1.1. GCC Countries
16.2.1.2. Turkey
16.2.1.3. South Africa
16.2.1.4. Rest of MEA
16.2.2. By Product Type
16.2.3. By Process
16.2.4. By Material
16.2.5. By Application
16.2.6. By End Use
16.3. Market Attractiveness Analysis
16.3.1. By Country
16.3.2. By Product Type
16.3.3. By Process
16.3.4. By Material
16.3.5. By Application
16.3.6. By End Use
16.4. Key Takeaways
17. Key Countries Rigid Sleeves Boxes Market Analysis
17.1. U.S.
17.1.1. Pricing Analysis
17.1.2. Market Share Analysis, 2021
17.1.2.1. By Product Type
17.1.2.2. By Process
17.1.2.3. By Material
17.1.2.4. By Application
17.1.2.5. By End Use
17.2. Canada
17.2.1. Pricing Analysis
17.2.2. Market Share Analysis, 2021
17.2.2.1. By Product Type
17.2.2.2. By Process
17.2.2.3. By Material
17.2.2.4. By Application
17.2.2.5. By End Use
17.3. Mexico
17.3.1. Pricing Analysis
17.3.2. Market Share Analysis, 2021
17.3.2.1. By Product Type
17.3.2.2. By Process
17.3.2.3. By Material
17.3.2.4. By Application
17.3.2.5. By End Use
17.4. Brazil
17.4.1. Pricing Analysis
17.4.2. Market Share Analysis, 2021
17.4.2.1. By Product Type
17.4.2.2. By Process
17.4.2.3. By Material
17.4.2.4. By Application
17.4.2.5. By End Use
17.5. Germany
17.5.1. Pricing Analysis
17.5.2. Market Share Analysis, 2021
17.5.2.1. By Product Type
17.5.2.2. By Process
17.5.2.3. By Material
17.5.2.4. By Application
17.5.2.5. By End Use
17.6. Italy
17.6.1. Pricing Analysis
17.6.2. Market Share Analysis, 2021
17.6.2.1. By Product Type
17.6.2.2. By Process
17.6.2.3. By Material
17.6.2.4. By Application
17.6.2.5. By End Use
17.7. France
17.7.1. Pricing Analysis
17.7.2. Market Share Analysis, 2021
17.7.2.1. By Product Type
17.7.2.2. By Process
17.7.2.3. By Material
17.7.2.4. By Application
17.7.2.5. By End Use
17.8. U.K.
17.8.1. Pricing Analysis
17.8.2. Market Share Analysis, 2021
17.8.2.1. By Product Type
17.8.2.2. By Process
17.8.2.3. By Material
17.8.2.4. By Application
17.8.2.5. By End Use
17.9. Spain
17.9.1. Pricing Analysis
17.9.2. Market Share Analysis, 2021
17.9.2.1. By Product Type
17.9.2.2. By Process
17.9.2.3. By Material
17.9.2.4. By Application
17.9.2.5. By End Use
17.10. BENELUX
17.10.1. Pricing Analysis
17.10.2. Market Share Analysis, 2021
17.10.2.1. By Product Type
17.10.2.2. By Process
17.10.2.3. By Material
17.10.2.4. By Application
17.10.2.5. By End Use
17.11. Russia
17.11.1. Pricing Analysis
17.11.2. Market Share Analysis, 2021
17.11.2.1. By Product Type
17.11.2.2. By Process
17.11.2.3. By Material
17.11.2.4. By Application
17.11.2.5. By End Use
17.12. China
17.12.1. Pricing Analysis
17.12.2. Market Share Analysis, 2021
17.12.2.1. By Product Type
17.12.2.2. By Process
17.12.2.3. By Material
17.12.2.4. By Application
17.12.2.5. By End Use
17.13. Japan
17.13.1. Pricing Analysis
17.13.2. Market Share Analysis, 2021
17.13.2.1. By Product Type
17.13.2.2. By Process
17.13.2.3. By Material
17.13.2.4. By Application
17.13.2.5. By End Use
17.14. South Korea
17.14.1. Pricing Analysis
17.14.2. Market Share Analysis, 2021
17.14.2.1. By Product Type
17.14.2.2. By Process
17.14.2.3. By Material
17.14.2.4. By Application
17.14.2.5. By End Use
17.15. India
17.15.1. Pricing Analysis
17.15.2. Market Share Analysis, 2021
17.15.2.1. By Product Type
17.15.2.2. By Process
17.15.2.3. By Material
17.15.2.4. By Application
17.15.2.5. By End Use
17.16. ASEAN
17.16.1. Pricing Analysis
17.16.2. Market Share Analysis, 2021
17.16.2.1. By Product Type
17.16.2.2. By Process
17.16.2.3. By Material
17.16.2.4. By Application
17.16.2.5. By End Use
17.17. Australia and New Zealand
17.17.1. Pricing Analysis
17.17.2. Market Share Analysis, 2021
17.17.2.1. By Product Type
17.17.2.2. By Process
17.17.2.3. By Material
17.17.2.4. By Application
17.17.2.5. By End Use
17.18. GCC Countries
17.18.1. Pricing Analysis
17.18.2. Market Share Analysis, 2021
17.18.2.1. By Product Type
17.18.2.2. By Process
17.18.2.3. By Material
17.18.2.4. By Application
17.18.2.5. By End Use
17.19. Turkey
17.19.1. Pricing Analysis
17.19.2. Market Share Analysis, 2021
17.19.2.1. By Product Type
17.19.2.2. By Process
17.19.2.3. By Material
17.19.2.4. By Application
17.19.2.5. By End Use
17.20. South Africa
17.20.1. Pricing Analysis
17.20.2. Market Share Analysis, 2021
17.20.2.1. By Product Type
17.20.2.2. By Process
17.20.2.3. By Material
17.20.2.4. By Application
17.20.2.5. By End Use
18. Market Structure Analysis
18.1. Competition Dashboard
18.2. Competition Benchmarking
18.3. Market Share Analysis of Top Players
18.3.1. By Regional
18.3.2. By Product Type
18.3.3. By Process
18.3.4. By Material
18.3.5. By Application
18.3.6. By End Use
19. Competition Analysis
19.1. Competition Deep Dive
19.1.1. Bluebird packaging
19.1.1.1. Overview
19.1.1.2. Product Portfolio
19.1.1.3. Profitability by Market Segments
19.1.1.4. Sales Footprint
19.1.1.5. Strategy Overview
19.1.1.5.1. Marketing Strategy
19.1.1.5.2. Product Strategy
19.1.1.5.3. Channel Strategy
19.1.2. Pak Factory
19.1.2.1. Overview
19.1.2.2. Product Portfolio
19.1.2.3. Profitability by Market Segments
19.1.2.4. Sales Footprint
19.1.2.5. Strategy Overview
19.1.2.5.1. Marketing Strategy
19.1.2.5.2. Product Strategy
19.1.2.5.3. Channel Strategy
19.1.3. BlueBox Packaging
19.1.3.1. Overview
19.1.3.2. Product Portfolio
19.1.3.3. Profitability by Market Segments
19.1.3.4. Sales Footprint
19.1.3.5. Strategy Overview
19.1.3.5.1. Marketing Strategy
19.1.3.5.2. Product Strategy
19.1.3.5.3. Channel Strategy
19.1.4. Brimar Packaging
19.1.4.1. Overview
19.1.4.2. Product Portfolio
19.1.4.3. Profitability by Market Segments
19.1.4.4. Sales Footprint
19.1.4.5. Strategy Overview
19.1.4.5.1. Marketing Strategy
19.1.4.5.2. Product Strategy
19.1.4.5.3. Channel Strategy
19.1.5. Napco
19.1.5.1. Overview
19.1.5.2. Product Portfolio
19.1.5.3. Profitability by Market Segments
19.1.5.4. Sales Footprint
19.1.5.5. Strategy Overview
19.1.5.5.1. Marketing Strategy
19.1.5.5.2. Product Strategy
19.1.5.5.3. Channel Strategy
19.1.6. Furong Box
19.1.6.1. Overview
19.1.6.2. Product Portfolio
19.1.6.3. Profitability by Market Segments
19.1.6.4. Sales Footprint
19.1.6.5. Strategy Overview
19.1.6.5.1. Marketing Strategy
19.1.6.5.2. Product Strategy
19.1.6.5.3. Channel Strategy
20. Assumptions & Acronyms Used
21. Research Methodology
Let us know your requirement to get
100% FREE customization
Table 1: Global Rigid Sleeves Boxes Market Value (US$ Mn) Forecast by Region, 2017-2032
Table 2: Global Rigid Sleeves Boxes Market Volume (Units) Forecast by Region, 2017-2032
Table 3: Global Rigid Sleeves Boxes Market Value (US$ Mn) Forecast by Product Type, 2017-2032
Table 4: Global Rigid Sleeves Boxes Market Volume (Units) Forecast by Product Type, 2017-2032
Table 5: Global Rigid Sleeves Boxes Market Value (US$ Mn) Forecast by Process, 2017-2032
Table 6: Global Rigid Sleeves Boxes Market Volume (Units) Forecast by Process, 2017-2032
Table 7: Global Rigid Sleeves Boxes Market Value (US$ Mn) Forecast by Material, 2017-2032
Table 8: Global Rigid Sleeves Boxes Market Volume (Units) Forecast by Material, 2017-2032
Table 9: Global Rigid Sleeves Boxes Market Value (US$ Mn) Forecast by Application , 2017-2032
Table 10: Global Rigid Sleeves Boxes Market Volume (Units) Forecast by Application , 2017-2032
Table 11: Global Rigid Sleeves Boxes Market Value (US$ Mn) Forecast by End Use, 2017-2032
Table 12: Global Rigid Sleeves Boxes Market Volume (Units) Forecast by End Use, 2017-2032
Table 13: North America Rigid Sleeves Boxes Market Value (US$ Mn) Forecast by Country, 2017-2032
Table 14: North America Rigid Sleeves Boxes Market Volume (Units) Forecast by Country, 2017-2032
Table 15: North America Rigid Sleeves Boxes Market Value (US$ Mn) Forecast by Product Type, 2017-2032
Table 16: North America Rigid Sleeves Boxes Market Volume (Units) Forecast by Product Type, 2017-2032
Table 17: North America Rigid Sleeves Boxes Market Value (US$ Mn) Forecast by Process, 2017-2032
Table 18: North America Rigid Sleeves Boxes Market Volume (Units) Forecast by Process, 2017-2032
Table 19: North America Rigid Sleeves Boxes Market Value (US$ Mn) Forecast by Material, 2017-2032
Table 20: North America Rigid Sleeves Boxes Market Volume (Units) Forecast by Material, 2017-2032
Table 21: North America Rigid Sleeves Boxes Market Value (US$ Mn) Forecast by Application , 2017-2032
Table 22: North America Rigid Sleeves Boxes Market Volume (Units) Forecast by Application , 2017-2032
Table 23: North America Rigid Sleeves Boxes Market Value (US$ Mn) Forecast by End Use, 2017-2032
Table 24: North America Rigid Sleeves Boxes Market Volume (Units) Forecast by End Use, 2017-2032
Table 25: Latin America Rigid Sleeves Boxes Market Value (US$ Mn) Forecast by Country, 2017-2032
Table 26: Latin America Rigid Sleeves Boxes Market Volume (Units) Forecast by Country, 2017-2032
Table 27: Latin America Rigid Sleeves Boxes Market Value (US$ Mn) Forecast by Product Type, 2017-2032
Table 28: Latin America Rigid Sleeves Boxes Market Volume (Units) Forecast by Product Type, 2017-2032
Table 29: Latin America Rigid Sleeves Boxes Market Value (US$ Mn) Forecast by Process, 2017-2032
Table 30: Latin America Rigid Sleeves Boxes Market Volume (Units) Forecast by Process, 2017-2032
Table 31: Latin America Rigid Sleeves Boxes Market Value (US$ Mn) Forecast by Material, 2017-2032
Table 32: Latin America Rigid Sleeves Boxes Market Volume (Units) Forecast by Material, 2017-2032
Table 33: Latin America Rigid Sleeves Boxes Market Value (US$ Mn) Forecast by Application , 2017-2032
Table 34: Latin America Rigid Sleeves Boxes Market Volume (Units) Forecast by Application , 2017-2032
Table 35: Latin America Rigid Sleeves Boxes Market Value (US$ Mn) Forecast by End Use, 2017-2032
Table 36: Latin America Rigid Sleeves Boxes Market Volume (Units) Forecast by End Use, 2017-2032
Table 37: Europe Rigid Sleeves Boxes Market Value (US$ Mn) Forecast by Country, 2017-2032
Table 38: Europe Rigid Sleeves Boxes Market Volume (Units) Forecast by Country, 2017-2032
Table 39: Europe Rigid Sleeves Boxes Market Value (US$ Mn) Forecast by Product Type, 2017-2032
Table 40: Europe Rigid Sleeves Boxes Market Volume (Units) Forecast by Product Type, 2017-2032
Table 41: Europe Rigid Sleeves Boxes Market Value (US$ Mn) Forecast by Process, 2017-2032
Table 42: Europe Rigid Sleeves Boxes Market Volume (Units) Forecast by Process, 2017-2032
Table 43: Europe Rigid Sleeves Boxes Market Value (US$ Mn) Forecast by Material, 2017-2032
Table 44: Europe Rigid Sleeves Boxes Market Volume (Units) Forecast by Material, 2017-2032
Table 45: Europe Rigid Sleeves Boxes Market Value (US$ Mn) Forecast by Application , 2017-2032
Table 46: Europe Rigid Sleeves Boxes Market Volume (Units) Forecast by Application , 2017-2032
Table 47: Europe Rigid Sleeves Boxes Market Value (US$ Mn) Forecast by End Use, 2017-2032
Table 48: Europe Rigid Sleeves Boxes Market Volume (Units) Forecast by End Use, 2017-2032
Table 49: East Asia Rigid Sleeves Boxes Market Value (US$ Mn) Forecast by Country, 2017-2032
Table 50: East Asia Rigid Sleeves Boxes Market Volume (Units) Forecast by Country, 2017-2032
Table 51: East Asia Rigid Sleeves Boxes Market Value (US$ Mn) Forecast by Product Type, 2017-2032
Table 52: East Asia Rigid Sleeves Boxes Market Volume (Units) Forecast by Product Type, 2017-2032
Table 53: East Asia Rigid Sleeves Boxes Market Value (US$ Mn) Forecast by Process, 2017-2032
Table 54: East Asia Rigid Sleeves Boxes Market Volume (Units) Forecast by Process, 2017-2032
Table 55: East Asia Rigid Sleeves Boxes Market Value (US$ Mn) Forecast by Material, 2017-2032
Table 56: East Asia Rigid Sleeves Boxes Market Volume (Units) Forecast by Material, 2017-2032
Table 57: East Asia Rigid Sleeves Boxes Market Value (US$ Mn) Forecast by Application , 2017-2032
Table 58: East Asia Rigid Sleeves Boxes Market Volume (Units) Forecast by Application , 2017-2032
Table 59: East Asia Rigid Sleeves Boxes Market Value (US$ Mn) Forecast by End Use, 2017-2032
Table 60: East Asia Rigid Sleeves Boxes Market Volume (Units) Forecast by End Use, 2017-2032
Table 61: South Asia & Pacific Rigid Sleeves Boxes Market Value (US$ Mn) Forecast by Country, 2017-2032
Table 62: South Asia & Pacific Rigid Sleeves Boxes Market Volume (Units) Forecast by Country, 2017-2032
Table 63: South Asia & Pacific Rigid Sleeves Boxes Market Value (US$ Mn) Forecast by Product Type, 2017-2032
Table 64: South Asia & Pacific Rigid Sleeves Boxes Market Volume (Units) Forecast by Product Type, 2017-2032
Table 65: South Asia & Pacific Rigid Sleeves Boxes Market Value (US$ Mn) Forecast by Process, 2017-2032
Table 66: South Asia & Pacific Rigid Sleeves Boxes Market Volume (Units) Forecast by Process, 2017-2032
Table 67: South Asia & Pacific Rigid Sleeves Boxes Market Value (US$ Mn) Forecast by Material, 2017-2032
Table 68: South Asia & Pacific Rigid Sleeves Boxes Market Volume (Units) Forecast by Material, 2017-2032
Table 69: South Asia & Pacific Rigid Sleeves Boxes Market Value (US$ Mn) Forecast by Application , 2017-2032
Table 70: South Asia & Pacific Rigid Sleeves Boxes Market Volume (Units) Forecast by Application , 2017-2032
Table 71: South Asia & Pacific Rigid Sleeves Boxes Market Value (US$ Mn) Forecast by End Use, 2017-2032
Table 72: South Asia & Pacific Rigid Sleeves Boxes Market Volume (Units) Forecast by End Use, 2017-2032
Table 73: MEA Rigid Sleeves Boxes Market Value (US$ Mn) Forecast by Country, 2017-2032
Table 74: MEA Rigid Sleeves Boxes Market Volume (Units) Forecast by Country, 2017-2032
Table 75: MEA Rigid Sleeves Boxes Market Value (US$ Mn) Forecast by Product Type, 2017-2032
Table 76: MEA Rigid Sleeves Boxes Market Volume (Units) Forecast by Product Type, 2017-2032
Table 77: MEA Rigid Sleeves Boxes Market Value (US$ Mn) Forecast by Process, 2017-2032
Table 78: MEA Rigid Sleeves Boxes Market Volume (Units) Forecast by Process, 2017-2032
Table 79: MEA Rigid Sleeves Boxes Market Value (US$ Mn) Forecast by Material, 2017-2032
Table 80: MEA Rigid Sleeves Boxes Market Volume (Units) Forecast by Material, 2017-2032
Table 81: MEA Rigid Sleeves Boxes Market Value (US$ Mn) Forecast by Application , 2017-2032
Table 82: MEA Rigid Sleeves Boxes Market Volume (Units) Forecast by Application , 2017-2032
Table 83: MEA Rigid Sleeves Boxes Market Value (US$ Mn) Forecast by End Use, 2017-2032
Table 84: MEA Rigid Sleeves Boxes Market Volume (Units) Forecast by End Use, 2017-2032
Find your sweet spots for generating winning opportunities in this market.
Talk to AnalystFigure 1: Global Rigid Sleeves Boxes Market Value (US$ Mn) by Product Type, 2022-2032
Figure 2: Global Rigid Sleeves Boxes Market Value (US$ Mn) by Process, 2022-2032
Figure 3: Global Rigid Sleeves Boxes Market Value (US$ Mn) by Material, 2022-2032
Figure 4: Global Rigid Sleeves Boxes Market Value (US$ Mn) by Application , 2022-2032
Figure 5: Global Rigid Sleeves Boxes Market Value (US$ Mn) by End Use, 2022-2032
Figure 6: Global Rigid Sleeves Boxes Market Value (US$ Mn) by Region, 2022-2032
Figure 7: Global Rigid Sleeves Boxes Market Value (US$ Mn) Analysis by Region, 2017-2032
Figure 8: Global Rigid Sleeves Boxes Market Volume (Units) Analysis by Region, 2017-2032
Figure 9: Global Rigid Sleeves Boxes Market Value Share (%) and BPS Analysis by Region, 2022-2032
Figure 10: Global Rigid Sleeves Boxes Market Y-o-Y Growth (%) Projections by Region, 2022-2032
Figure 11: Global Rigid Sleeves Boxes Market Value (US$ Mn) Analysis by Product Type, 2017-2032
Figure 12: Global Rigid Sleeves Boxes Market Volume (Units) Analysis by Product Type, 2017-2032
Figure 13: Global Rigid Sleeves Boxes Market Value Share (%) and BPS Analysis by Product Type, 2022-2032
Figure 14: Global Rigid Sleeves Boxes Market Y-o-Y Growth (%) Projections by Product Type, 2022-2032
Figure 15: Global Rigid Sleeves Boxes Market Value (US$ Mn) Analysis by Process, 2017-2032
Figure 16: Global Rigid Sleeves Boxes Market Volume (Units) Analysis by Process, 2017-2032
Figure 17: Global Rigid Sleeves Boxes Market Value Share (%) and BPS Analysis by Process, 2022-2032
Figure 18: Global Rigid Sleeves Boxes Market Y-o-Y Growth (%) Projections by Process, 2022-2032
Figure 19: Global Rigid Sleeves Boxes Market Value (US$ Mn) Analysis by Material, 2017-2032
Figure 20: Global Rigid Sleeves Boxes Market Volume (Units) Analysis by Material, 2017-2032
Figure 21: Global Rigid Sleeves Boxes Market Value Share (%) and BPS Analysis by Material, 2022-2032
Figure 22: Global Rigid Sleeves Boxes Market Y-o-Y Growth (%) Projections by Material, 2022-2032
Figure 23: Global Rigid Sleeves Boxes Market Value (US$ Mn) Analysis by Application , 2017-2032
Figure 24: Global Rigid Sleeves Boxes Market Volume (Units) Analysis by Application , 2017-2032
Figure 25: Global Rigid Sleeves Boxes Market Value Share (%) and BPS Analysis by Application , 2022-2032
Figure 26: Global Rigid Sleeves Boxes Market Y-o-Y Growth (%) Projections by Application , 2022-2032
Figure 27: Global Rigid Sleeves Boxes Market Value (US$ Mn) Analysis by End Use, 2017-2032
Figure 28: Global Rigid Sleeves Boxes Market Volume (Units) Analysis by End Use, 2017-2032
Figure 29: Global Rigid Sleeves Boxes Market Value Share (%) and BPS Analysis by End Use, 2022-2032
Figure 30: Global Rigid Sleeves Boxes Market Y-o-Y Growth (%) Projections by End Use, 2022-2032
Figure 31: Global Rigid Sleeves Boxes Market Attractiveness by Product Type, 2022-2032
Figure 32: Global Rigid Sleeves Boxes Market Attractiveness by Process, 2022-2032
Figure 33: Global Rigid Sleeves Boxes Market Attractiveness by Material, 2022-2032
Figure 34: Global Rigid Sleeves Boxes Market Attractiveness by Application , 2022-2032
Figure 35: Global Rigid Sleeves Boxes Market Attractiveness by End Use, 2022-2032
Figure 36: Global Rigid Sleeves Boxes Market Attractiveness by Region, 2022-2032
Figure 37: North America Rigid Sleeves Boxes Market Value (US$ Mn) by Product Type, 2022-2032
Figure 38: North America Rigid Sleeves Boxes Market Value (US$ Mn) by Process, 2022-2032
Figure 39: North America Rigid Sleeves Boxes Market Value (US$ Mn) by Material, 2022-2032
Figure 40: North America Rigid Sleeves Boxes Market Value (US$ Mn) by Application , 2022-2032
Figure 41: North America Rigid Sleeves Boxes Market Value (US$ Mn) by End Use, 2022-2032
Figure 42: North America Rigid Sleeves Boxes Market Value (US$ Mn) by Country, 2022-2032
Figure 43: North America Rigid Sleeves Boxes Market Value (US$ Mn) Analysis by Country, 2017-2032
Figure 44: North America Rigid Sleeves Boxes Market Volume (Units) Analysis by Country, 2017-2032
Figure 45: North America Rigid Sleeves Boxes Market Value Share (%) and BPS Analysis by Country, 2022-2032
Figure 46: North America Rigid Sleeves Boxes Market Y-o-Y Growth (%) Projections by Country, 2022-2032
Figure 47: North America Rigid Sleeves Boxes Market Value (US$ Mn) Analysis by Product Type, 2017-2032
Figure 48: North America Rigid Sleeves Boxes Market Volume (Units) Analysis by Product Type, 2017-2032
Figure 49: North America Rigid Sleeves Boxes Market Value Share (%) and BPS Analysis by Product Type, 2022-2032
Figure 50: North America Rigid Sleeves Boxes Market Y-o-Y Growth (%) Projections by Product Type, 2022-2032
Figure 51: North America Rigid Sleeves Boxes Market Value (US$ Mn) Analysis by Process, 2017-2032
Figure 52: North America Rigid Sleeves Boxes Market Volume (Units) Analysis by Process, 2017-2032
Figure 53: North America Rigid Sleeves Boxes Market Value Share (%) and BPS Analysis by Process, 2022-2032
Figure 54: North America Rigid Sleeves Boxes Market Y-o-Y Growth (%) Projections by Process, 2022-2032
Figure 55: North America Rigid Sleeves Boxes Market Value (US$ Mn) Analysis by Material, 2017-2032
Figure 56: North America Rigid Sleeves Boxes Market Volume (Units) Analysis by Material, 2017-2032
Figure 57: North America Rigid Sleeves Boxes Market Value Share (%) and BPS Analysis by Material, 2022-2032
Figure 58: North America Rigid Sleeves Boxes Market Y-o-Y Growth (%) Projections by Material, 2022-2032
Figure 59: North America Rigid Sleeves Boxes Market Value (US$ Mn) Analysis by Application , 2017-2032
Figure 60: North America Rigid Sleeves Boxes Market Volume (Units) Analysis by Application , 2017-2032
Figure 61: North America Rigid Sleeves Boxes Market Value Share (%) and BPS Analysis by Application , 2022-2032
Figure 62: North America Rigid Sleeves Boxes Market Y-o-Y Growth (%) Projections by Application , 2022-2032
Figure 63: North America Rigid Sleeves Boxes Market Value (US$ Mn) Analysis by End Use, 2017-2032
Figure 64: North America Rigid Sleeves Boxes Market Volume (Units) Analysis by End Use, 2017-2032
Figure 65: North America Rigid Sleeves Boxes Market Value Share (%) and BPS Analysis by End Use, 2022-2032
Figure 66: North America Rigid Sleeves Boxes Market Y-o-Y Growth (%) Projections by End Use, 2022-2032
Figure 67: North America Rigid Sleeves Boxes Market Attractiveness by Product Type, 2022-2032
Figure 68: North America Rigid Sleeves Boxes Market Attractiveness by Process, 2022-2032
Figure 69: North America Rigid Sleeves Boxes Market Attractiveness by Material, 2022-2032
Figure 70: North America Rigid Sleeves Boxes Market Attractiveness by Application , 2022-2032
Figure 71: North America Rigid Sleeves Boxes Market Attractiveness by End Use, 2022-2032
Figure 72: North America Rigid Sleeves Boxes Market Attractiveness by Country, 2022-2032
Figure 73: Latin America Rigid Sleeves Boxes Market Value (US$ Mn) by Product Type, 2022-2032
Figure 74: Latin America Rigid Sleeves Boxes Market Value (US$ Mn) by Process, 2022-2032
Figure 75: Latin America Rigid Sleeves Boxes Market Value (US$ Mn) by Material, 2022-2032
Figure 76: Latin America Rigid Sleeves Boxes Market Value (US$ Mn) by Application , 2022-2032
Figure 77: Latin America Rigid Sleeves Boxes Market Value (US$ Mn) by End Use, 2022-2032
Figure 78: Latin America Rigid Sleeves Boxes Market Value (US$ Mn) by Country, 2022-2032
Figure 79: Latin America Rigid Sleeves Boxes Market Value (US$ Mn) Analysis by Country, 2017-2032
Figure 80: Latin America Rigid Sleeves Boxes Market Volume (Units) Analysis by Country, 2017-2032
Figure 81: Latin America Rigid Sleeves Boxes Market Value Share (%) and BPS Analysis by Country, 2022-2032
Figure 82: Latin America Rigid Sleeves Boxes Market Y-o-Y Growth (%) Projections by Country, 2022-2032
Figure 83: Latin America Rigid Sleeves Boxes Market Value (US$ Mn) Analysis by Product Type, 2017-2032
Figure 84: Latin America Rigid Sleeves Boxes Market Volume (Units) Analysis by Product Type, 2017-2032
Figure 85: Latin America Rigid Sleeves Boxes Market Value Share (%) and BPS Analysis by Product Type, 2022-2032
Figure 86: Latin America Rigid Sleeves Boxes Market Y-o-Y Growth (%) Projections by Product Type, 2022-2032
Figure 87: Latin America Rigid Sleeves Boxes Market Value (US$ Mn) Analysis by Process, 2017-2032
Figure 88: Latin America Rigid Sleeves Boxes Market Volume (Units) Analysis by Process, 2017-2032
Figure 89: Latin America Rigid Sleeves Boxes Market Value Share (%) and BPS Analysis by Process, 2022-2032
Figure 90: Latin America Rigid Sleeves Boxes Market Y-o-Y Growth (%) Projections by Process, 2022-2032
Figure 91: Latin America Rigid Sleeves Boxes Market Value (US$ Mn) Analysis by Material, 2017-2032
Figure 92: Latin America Rigid Sleeves Boxes Market Volume (Units) Analysis by Material, 2017-2032
Figure 93: Latin America Rigid Sleeves Boxes Market Value Share (%) and BPS Analysis by Material, 2022-2032
Figure 94: Latin America Rigid Sleeves Boxes Market Y-o-Y Growth (%) Projections by Material, 2022-2032
Figure 95: Latin America Rigid Sleeves Boxes Market Value (US$ Mn) Analysis by Application , 2017-2032
Figure 96: Latin America Rigid Sleeves Boxes Market Volume (Units) Analysis by Application , 2017-2032
Figure 97: Latin America Rigid Sleeves Boxes Market Value Share (%) and BPS Analysis by Application , 2022-2032
Figure 98: Latin America Rigid Sleeves Boxes Market Y-o-Y Growth (%) Projections by Application , 2022-2032
Figure 99: Latin America Rigid Sleeves Boxes Market Value (US$ Mn) Analysis by End Use, 2017-2032
Figure 100: Latin America Rigid Sleeves Boxes Market Volume (Units) Analysis by End Use, 2017-2032
Figure 101: Latin America Rigid Sleeves Boxes Market Value Share (%) and BPS Analysis by End Use, 2022-2032
Figure 102: Latin America Rigid Sleeves Boxes Market Y-o-Y Growth (%) Projections by End Use, 2022-2032
Figure 103: Latin America Rigid Sleeves Boxes Market Attractiveness by Product Type, 2022-2032
Figure 104: Latin America Rigid Sleeves Boxes Market Attractiveness by Process, 2022-2032
Figure 105: Latin America Rigid Sleeves Boxes Market Attractiveness by Material, 2022-2032
Figure 106: Latin America Rigid Sleeves Boxes Market Attractiveness by Application , 2022-2032
Figure 107: Latin America Rigid Sleeves Boxes Market Attractiveness by End Use, 2022-2032
Figure 108: Latin America Rigid Sleeves Boxes Market Attractiveness by Country, 2022-2032
Figure 109: Europe Rigid Sleeves Boxes Market Value (US$ Mn) by Product Type, 2022-2032
Figure 110: Europe Rigid Sleeves Boxes Market Value (US$ Mn) by Process, 2022-2032
Figure 111: Europe Rigid Sleeves Boxes Market Value (US$ Mn) by Material, 2022-2032
Figure 112: Europe Rigid Sleeves Boxes Market Value (US$ Mn) by Application , 2022-2032
Figure 113: Europe Rigid Sleeves Boxes Market Value (US$ Mn) by End Use, 2022-2032
Figure 114: Europe Rigid Sleeves Boxes Market Value (US$ Mn) by Country, 2022-2032
Figure 115: Europe Rigid Sleeves Boxes Market Value (US$ Mn) Analysis by Country, 2017-2032
Figure 116: Europe Rigid Sleeves Boxes Market Volume (Units) Analysis by Country, 2017-2032
Figure 117: Europe Rigid Sleeves Boxes Market Value Share (%) and BPS Analysis by Country, 2022-2032
Figure 118: Europe Rigid Sleeves Boxes Market Y-o-Y Growth (%) Projections by Country, 2022-2032
Figure 119: Europe Rigid Sleeves Boxes Market Value (US$ Mn) Analysis by Product Type, 2017-2032
Figure 120: Europe Rigid Sleeves Boxes Market Volume (Units) Analysis by Product Type, 2017-2032
Figure 121: Europe Rigid Sleeves Boxes Market Value Share (%) and BPS Analysis by Product Type, 2022-2032
Figure 122: Europe Rigid Sleeves Boxes Market Y-o-Y Growth (%) Projections by Product Type, 2022-2032
Figure 123: Europe Rigid Sleeves Boxes Market Value (US$ Mn) Analysis by Process, 2017-2032
Figure 124: Europe Rigid Sleeves Boxes Market Volume (Units) Analysis by Process, 2017-2032
Figure 125: Europe Rigid Sleeves Boxes Market Value Share (%) and BPS Analysis by Process, 2022-2032
Figure 126: Europe Rigid Sleeves Boxes Market Y-o-Y Growth (%) Projections by Process, 2022-2032
Figure 127: Europe Rigid Sleeves Boxes Market Value (US$ Mn) Analysis by Material, 2017-2032
Figure 128: Europe Rigid Sleeves Boxes Market Volume (Units) Analysis by Material, 2017-2032
Figure 129: Europe Rigid Sleeves Boxes Market Value Share (%) and BPS Analysis by Material, 2022-2032
Figure 130: Europe Rigid Sleeves Boxes Market Y-o-Y Growth (%) Projections by Material, 2022-2032
Figure 131: Europe Rigid Sleeves Boxes Market Value (US$ Mn) Analysis by Application , 2017-2032
Figure 132: Europe Rigid Sleeves Boxes Market Volume (Units) Analysis by Application , 2017-2032
Figure 133: Europe Rigid Sleeves Boxes Market Value Share (%) and BPS Analysis by Application , 2022-2032
Figure 134: Europe Rigid Sleeves Boxes Market Y-o-Y Growth (%) Projections by Application , 2022-2032
Figure 135: Europe Rigid Sleeves Boxes Market Value (US$ Mn) Analysis by End Use, 2017-2032
Figure 136: Europe Rigid Sleeves Boxes Market Volume (Units) Analysis by End Use, 2017-2032
Figure 137: Europe Rigid Sleeves Boxes Market Value Share (%) and BPS Analysis by End Use, 2022-2032
Figure 138: Europe Rigid Sleeves Boxes Market Y-o-Y Growth (%) Projections by End Use, 2022-2032
Figure 139: Europe Rigid Sleeves Boxes Market Attractiveness by Product Type, 2022-2032
Figure 140: Europe Rigid Sleeves Boxes Market Attractiveness by Process, 2022-2032
Figure 141: Europe Rigid Sleeves Boxes Market Attractiveness by Material, 2022-2032
Figure 142: Europe Rigid Sleeves Boxes Market Attractiveness by Application , 2022-2032
Figure 143: Europe Rigid Sleeves Boxes Market Attractiveness by End Use, 2022-2032
Figure 144: Europe Rigid Sleeves Boxes Market Attractiveness by Country, 2022-2032
Figure 145: East Asia Rigid Sleeves Boxes Market Value (US$ Mn) by Product Type, 2022-2032
Figure 146: East Asia Rigid Sleeves Boxes Market Value (US$ Mn) by Process, 2022-2032
Figure 147: East Asia Rigid Sleeves Boxes Market Value (US$ Mn) by Material, 2022-2032
Figure 148: East Asia Rigid Sleeves Boxes Market Value (US$ Mn) by Application , 2022-2032
Figure 149: East Asia Rigid Sleeves Boxes Market Value (US$ Mn) by End Use, 2022-2032
Figure 150: East Asia Rigid Sleeves Boxes Market Value (US$ Mn) by Country, 2022-2032
Figure 151: East Asia Rigid Sleeves Boxes Market Value (US$ Mn) Analysis by Country, 2017-2032
Figure 152: East Asia Rigid Sleeves Boxes Market Volume (Units) Analysis by Country, 2017-2032
Figure 153: East Asia Rigid Sleeves Boxes Market Value Share (%) and BPS Analysis by Country, 2022-2032
Figure 154: East Asia Rigid Sleeves Boxes Market Y-o-Y Growth (%) Projections by Country, 2022-2032
Figure 155: East Asia Rigid Sleeves Boxes Market Value (US$ Mn) Analysis by Product Type, 2017-2032
Figure 156: East Asia Rigid Sleeves Boxes Market Volume (Units) Analysis by Product Type, 2017-2032
Figure 157: East Asia Rigid Sleeves Boxes Market Value Share (%) and BPS Analysis by Product Type, 2022-2032
Figure 158: East Asia Rigid Sleeves Boxes Market Y-o-Y Growth (%) Projections by Product Type, 2022-2032
Figure 159: East Asia Rigid Sleeves Boxes Market Value (US$ Mn) Analysis by Process, 2017-2032
Figure 160: East Asia Rigid Sleeves Boxes Market Volume (Units) Analysis by Process, 2017-2032
Figure 161: East Asia Rigid Sleeves Boxes Market Value Share (%) and BPS Analysis by Process, 2022-2032
Figure 162: East Asia Rigid Sleeves Boxes Market Y-o-Y Growth (%) Projections by Process, 2022-2032
Figure 163: East Asia Rigid Sleeves Boxes Market Value (US$ Mn) Analysis by Material, 2017-2032
Figure 164: East Asia Rigid Sleeves Boxes Market Volume (Units) Analysis by Material, 2017-2032
Figure 165: East Asia Rigid Sleeves Boxes Market Value Share (%) and BPS Analysis by Material, 2022-2032
Figure 166: East Asia Rigid Sleeves Boxes Market Y-o-Y Growth (%) Projections by Material, 2022-2032
Figure 167: East Asia Rigid Sleeves Boxes Market Value (US$ Mn) Analysis by Application , 2017-2032
Figure 168: East Asia Rigid Sleeves Boxes Market Volume (Units) Analysis by Application , 2017-2032
Figure 169: East Asia Rigid Sleeves Boxes Market Value Share (%) and BPS Analysis by Application , 2022-2032
Figure 170: East Asia Rigid Sleeves Boxes Market Y-o-Y Growth (%) Projections by Application , 2022-2032
Figure 171: East Asia Rigid Sleeves Boxes Market Value (US$ Mn) Analysis by End Use, 2017-2032
Figure 172: East Asia Rigid Sleeves Boxes Market Volume (Units) Analysis by End Use, 2017-2032
Figure 173: East Asia Rigid Sleeves Boxes Market Value Share (%) and BPS Analysis by End Use, 2022-2032
Figure 174: East Asia Rigid Sleeves Boxes Market Y-o-Y Growth (%) Projections by End Use, 2022-2032
Figure 175: East Asia Rigid Sleeves Boxes Market Attractiveness by Product Type, 2022-2032
Figure 176: East Asia Rigid Sleeves Boxes Market Attractiveness by Process, 2022-2032
Figure 177: East Asia Rigid Sleeves Boxes Market Attractiveness by Material, 2022-2032
Figure 178: East Asia Rigid Sleeves Boxes Market Attractiveness by Application , 2022-2032
Figure 179: East Asia Rigid Sleeves Boxes Market Attractiveness by End Use, 2022-2032
Figure 180: East Asia Rigid Sleeves Boxes Market Attractiveness by Country, 2022-2032
Figure 181: South Asia & Pacific Rigid Sleeves Boxes Market Value (US$ Mn) by Product Type, 2022-2032
Figure 182: South Asia & Pacific Rigid Sleeves Boxes Market Value (US$ Mn) by Process, 2022-2032
Figure 183: South Asia & Pacific Rigid Sleeves Boxes Market Value (US$ Mn) by Material, 2022-2032
Figure 184: South Asia & Pacific Rigid Sleeves Boxes Market Value (US$ Mn) by Application , 2022-2032
Figure 185: South Asia & Pacific Rigid Sleeves Boxes Market Value (US$ Mn) by End Use, 2022-2032
Figure 186: South Asia & Pacific Rigid Sleeves Boxes Market Value (US$ Mn) by Country, 2022-2032
Figure 187: South Asia & Pacific Rigid Sleeves Boxes Market Value (US$ Mn) Analysis by Country, 2017-2032
Figure 188: South Asia & Pacific Rigid Sleeves Boxes Market Volume (Units) Analysis by Country, 2017-2032
Figure 189: South Asia & Pacific Rigid Sleeves Boxes Market Value Share (%) and BPS Analysis by Country, 2022-2032
Figure 190: South Asia & Pacific Rigid Sleeves Boxes Market Y-o-Y Growth (%) Projections by Country, 2022-2032
Figure 191: South Asia & Pacific Rigid Sleeves Boxes Market Value (US$ Mn) Analysis by Product Type, 2017-2032
Figure 192: South Asia & Pacific Rigid Sleeves Boxes Market Volume (Units) Analysis by Product Type, 2017-2032
Figure 193: South Asia & Pacific Rigid Sleeves Boxes Market Value Share (%) and BPS Analysis by Product Type, 2022-2032
Figure 194: South Asia & Pacific Rigid Sleeves Boxes Market Y-o-Y Growth (%) Projections by Product Type, 2022-2032
Figure 195: South Asia & Pacific Rigid Sleeves Boxes Market Value (US$ Mn) Analysis by Process, 2017-2032
Figure 196: South Asia & Pacific Rigid Sleeves Boxes Market Volume (Units) Analysis by Process, 2017-2032
Figure 197: South Asia & Pacific Rigid Sleeves Boxes Market Value Share (%) and BPS Analysis by Process, 2022-2032
Figure 198: South Asia & Pacific Rigid Sleeves Boxes Market Y-o-Y Growth (%) Projections by Process, 2022-2032
Figure 199: South Asia & Pacific Rigid Sleeves Boxes Market Value (US$ Mn) Analysis by Material, 2017-2032
Figure 200: South Asia & Pacific Rigid Sleeves Boxes Market Volume (Units) Analysis by Material, 2017-2032
Figure 201: South Asia & Pacific Rigid Sleeves Boxes Market Value Share (%) and BPS Analysis by Material, 2022-2032
Figure 202: South Asia & Pacific Rigid Sleeves Boxes Market Y-o-Y Growth (%) Projections by Material, 2022-2032
Figure 203: South Asia & Pacific Rigid Sleeves Boxes Market Value (US$ Mn) Analysis by Application , 2017-2032
Figure 204: South Asia & Pacific Rigid Sleeves Boxes Market Volume (Units) Analysis by Application , 2017-2032
Figure 205: South Asia & Pacific Rigid Sleeves Boxes Market Value Share (%) and BPS Analysis by Application , 2022-2032
Figure 206: South Asia & Pacific Rigid Sleeves Boxes Market Y-o-Y Growth (%) Projections by Application , 2022-2032
Figure 207: South Asia & Pacific Rigid Sleeves Boxes Market Value (US$ Mn) Analysis by End Use, 2017-2032
Figure 208: South Asia & Pacific Rigid Sleeves Boxes Market Volume (Units) Analysis by End Use, 2017-2032
Figure 209: South Asia & Pacific Rigid Sleeves Boxes Market Value Share (%) and BPS Analysis by End Use, 2022-2032
Figure 210: South Asia & Pacific Rigid Sleeves Boxes Market Y-o-Y Growth (%) Projections by End Use, 2022-2032
Figure 211: South Asia & Pacific Rigid Sleeves Boxes Market Attractiveness by Product Type, 2022-2032
Figure 212: South Asia & Pacific Rigid Sleeves Boxes Market Attractiveness by Process, 2022-2032
Figure 213: South Asia & Pacific Rigid Sleeves Boxes Market Attractiveness by Material, 2022-2032
Figure 214: South Asia & Pacific Rigid Sleeves Boxes Market Attractiveness by Application , 2022-2032
Figure 215: South Asia & Pacific Rigid Sleeves Boxes Market Attractiveness by End Use, 2022-2032
Figure 216: South Asia & Pacific Rigid Sleeves Boxes Market Attractiveness by Country, 2022-2032
Figure 217: MEA Rigid Sleeves Boxes Market Value (US$ Mn) by Product Type, 2022-2032
Figure 218: MEA Rigid Sleeves Boxes Market Value (US$ Mn) by Process, 2022-2032
Figure 219: MEA Rigid Sleeves Boxes Market Value (US$ Mn) by Material, 2022-2032
Figure 220: MEA Rigid Sleeves Boxes Market Value (US$ Mn) by Application , 2022-2032
Figure 221: MEA Rigid Sleeves Boxes Market Value (US$ Mn) by End Use, 2022-2032
Figure 222: MEA Rigid Sleeves Boxes Market Value (US$ Mn) by Country, 2022-2032
Figure 223: MEA Rigid Sleeves Boxes Market Value (US$ Mn) Analysis by Country, 2017-2032
Figure 224: MEA Rigid Sleeves Boxes Market Volume (Units) Analysis by Country, 2017-2032
Figure 225: MEA Rigid Sleeves Boxes Market Value Share (%) and BPS Analysis by Country, 2022-2032
Figure 226: MEA Rigid Sleeves Boxes Market Y-o-Y Growth (%) Projections by Country, 2022-2032
Figure 227: MEA Rigid Sleeves Boxes Market Value (US$ Mn) Analysis by Product Type, 2017-2032
Figure 228: MEA Rigid Sleeves Boxes Market Volume (Units) Analysis by Product Type, 2017-2032
Figure 229: MEA Rigid Sleeves Boxes Market Value Share (%) and BPS Analysis by Product Type, 2022-2032
Figure 230: MEA Rigid Sleeves Boxes Market Y-o-Y Growth (%) Projections by Product Type, 2022-2032
Figure 231: MEA Rigid Sleeves Boxes Market Value (US$ Mn) Analysis by Process, 2017-2032
Figure 232: MEA Rigid Sleeves Boxes Market Volume (Units) Analysis by Process, 2017-2032
Figure 233: MEA Rigid Sleeves Boxes Market Value Share (%) and BPS Analysis by Process, 2022-2032
Figure 234: MEA Rigid Sleeves Boxes Market Y-o-Y Growth (%) Projections by Process, 2022-2032
Figure 235: MEA Rigid Sleeves Boxes Market Value (US$ Mn) Analysis by Material, 2017-2032
Figure 236: MEA Rigid Sleeves Boxes Market Volume (Units) Analysis by Material, 2017-2032
Figure 237: MEA Rigid Sleeves Boxes Market Value Share (%) and BPS Analysis by Material, 2022-2032
Figure 238: MEA Rigid Sleeves Boxes Market Y-o-Y Growth (%) Projections by Material, 2022-2032
Figure 239: MEA Rigid Sleeves Boxes Market Value (US$ Mn) Analysis by Application , 2017-2032
Figure 240: MEA Rigid Sleeves Boxes Market Volume (Units) Analysis by Application , 2017-2032
Figure 241: MEA Rigid Sleeves Boxes Market Value Share (%) and BPS Analysis by Application , 2022-2032
Figure 242: MEA Rigid Sleeves Boxes Market Y-o-Y Growth (%) Projections by Application , 2022-2032
Figure 243: MEA Rigid Sleeves Boxes Market Value (US$ Mn) Analysis by End Use, 2017-2032
Figure 244: MEA Rigid Sleeves Boxes Market Volume (Units) Analysis by End Use, 2017-2032
Figure 245: MEA Rigid Sleeves Boxes Market Value Share (%) and BPS Analysis by End Use, 2022-2032
Figure 246: MEA Rigid Sleeves Boxes Market Y-o-Y Growth (%) Projections by End Use, 2022-2032
Figure 247: MEA Rigid Sleeves Boxes Market Attractiveness by Product Type, 2022-2032
Figure 248: MEA Rigid Sleeves Boxes Market Attractiveness by Process, 2022-2032
Figure 249: MEA Rigid Sleeves Boxes Market Attractiveness by Material, 2022-2032
Figure 250: MEA Rigid Sleeves Boxes Market Attractiveness by Application , 2022-2032
Figure 251: MEA Rigid Sleeves Boxes Market Attractiveness by End Use, 2022-2032
Figure 252: MEA Rigid Sleeves Boxes Market Attractiveness by Country, 2022-2032
Need specific information?
Request CustomizationExplore Packaging Insights
View Reports