Methodology

Rosacea-Targeting Skincare Market Size and Share Forecast Outlook 2025 to 2035

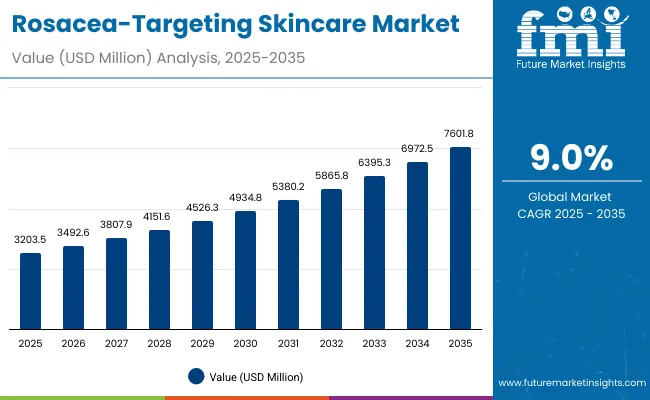
The Rosacea-Targeting Skincare Market is expected to record a valuation of USD 3,203.5 million in 2025 and USD 7,601.8 million in 2035, with an increase of USD 4,398.3 million, which equals a growth of 137% over the decade. The overall expansion represents a CAGR of 9.0% and a near 2.4X increase in market size.
Quick Stats for Rosacea-Targeting Skincare Market

  • Rosacea-Targeting Skincare Market Value (2025): USD 3,203.5 million
  • Rosacea-Targeting Skincare Market Forecast Value (2035): USD 7,601.8 million
  • Rosacea-Targeting Skincare Market Forecast CAGR (2025 to 2035): 9.0%
  • Leading Segment in 2025: Fragrance-free formulations (56.6% share)
  • Key Growth Regions: Asia-Pacific (notably China CAGR 19.4% and India CAGR 21.4%), North America, Europe
  • Top Key Players: La Roche-Posay, Eucerin, Aveeno, Avene, Cetaphil, Paula’s Choice, Bioderma, Clinique, Murad, Skinceuticals

Rosacea Targeting Skincare Market

Rosacea-Targeting Skincare Market Key Takeaways

Metric Value
Rosacea-Targeting Skincare Market Estimated Value in (2025E) USD 3,203.5 million
Rosacea-Targeting Skincare Market Forecast Value in (2035F) USD 7,601.8 million
Forecast CAGR (2025 to 2035) 9.0%

During the first five-year period from 2025 to 2030, the market increases from USD 3,203.5 million to USD 4,934.8 million, adding USD 1,731.3 million, which accounts for 39% of the total decade growth. This phase records steady adoption in pharmacies/drugstores and dermatology clinics, driven by growing awareness of clinical skincare and demand for fragrance-free and sensitive-skin-safe claims. Fragrance-free products dominate this period with over 56% share, and redness reduction formulations lead by function with more than 50% share in 2025.

The second half from 2030 to 2035 contributes USD 2,667.0 million, equal to 61% of total growth, as the market jumps from USD 4,934.8 million to USD 7,601.8 million. This acceleration is powered by rapid expansion in e-commerce and premium dermocosmetic lines, supported by strong growth in China (CAGR 19.4%) and India (CAGR 21.4%). By 2035, digital-first direct-to-consumer brands and AI-personalized skincare platforms strengthen recurring revenue streams, while organic-certified and cold-pressed formulations capture a larger share in the premium segment.

From 2020 to 2024, the Rosacea-Targeting Skincare Market steadily expanded as awareness of rosacea-related skin concerns increased. Growth was driven by dermatology-led recommendations, consumer preference for sensitive-skin-safe products, and early adoption of fragrance-free creams and serums. During this period, the competitive landscape was dominated by established dermocosmetic brands such as La Roche-Posay and Eucerin, which together captured a significant share of prescription-backed and OTC formulations. Differentiation relied heavily on clinical validation, dermatologist endorsements, and pricing accessibility, while niche entrants focused on botanical and anti-inflammatory actives had limited traction. Service-based digital skincare platforms accounted for less than 10% of the total market value.

Demand for Rosacea-Targeting Skincare is projected to reach USD 3,203.5 million in 2025, and the revenue mix will shift toward premium dermocosmetic lines and digital-first retail channels. Traditional leaders face rising competition from direct-to-consumer (D2C) brands offering AI-personalized routines, subscription-based models, and refillable packaging. Emerging entrants specializing in organic-certified, cold-pressed oils, and clean-label formulations are gaining share. The competitive advantage is moving away from legacy dermatologist-backed dominance toward ecosystem strength, digital scalability, and sustainability-driven brand equity.

Why the Rosacea-Targeting Skincare Market is growing?

Growing awareness of rosacea as a chronic skin condition has significantly increased diagnosis rates and treatment-seeking behavior. Dermatologists are recommending specialized formulations such as fragrance-free creams, serums with niacinamide, and colloidal oatmeal-based products, driving consumer trust. Clinical validation and dermatologist-tested claims are becoming strong purchase drivers, especially in North America and Europe. This emphasis on science-backed efficacy ensures continuous consumer adoption and positions rosacea-targeting products as essential dermocosmetic solutions.

The market is being propelled by the rapid growth of e-commerce platforms, D2C skincare brands, and AI-powered personalized routine builders. Consumers increasingly prefer digital platforms that offer subscription-based, refillable, and customized skincare options tailored to sensitive skin needs. Meanwhile, premium dermocosmetic lines in Asia-Pacific particularly in China and India are growing at double-digit CAGRs, supported by clean-label, vegan, and organic-certified claims. This blend of digital convenience and premium positioning is fueling sustained market growth globally.

Segmental Analysis

The Rosacea-Targeting Skincare Market is segmented by function, product type, active ingredient, claim, channel, and region. By function, the key categories are redness reduction, barrier repair, soothing/anti-irritation, and anti-inflammatory formulations. Product types include creams/lotions, serums, cleansers, and gels, catering to different consumer preferences and skin sensitivities. Active ingredient segmentation highlights niacinamide, azelaic acid, centellaasiatica, and colloidal oatmeal as leading actives.

Claims are dominated by fragrance-free, hypoallergenic, dermatologist-tested, and sensitive-skin-safe labels. Distribution channels comprise pharmacies/drugstores, dermatology clinics, e-commerce, and mass retail. Regionally, the market spans North America, Europe, Asia-Pacific, Latin America, and the Middle East & Africa, with China and India emerging as the fastest-growing markets.
Insights into the Claim Segment with Fragrance-Free Leading in Market Share

Rosacea Targeting Skincare Market By Claim

Claim Value Share% 2025
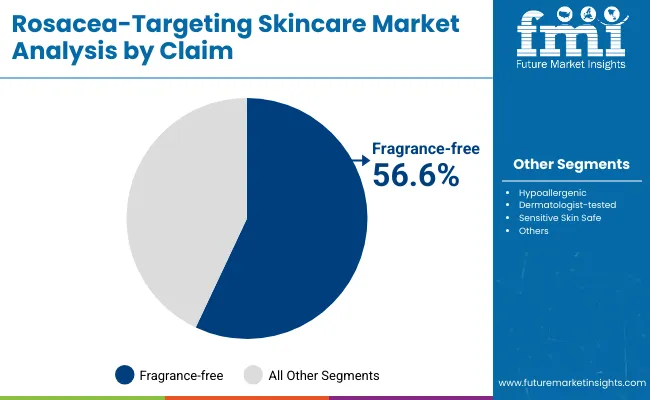
Fragrance-free 56.6%
Others 43.4%

The fragrance-free segment is projected to contribute 56.6% of the Rosacea-Targeting Skincare Market revenue in 2025, maintaining its lead as the dominant claim category. This is driven by rising consumer awareness of skin sensitivities and the strong preference for formulations free from artificial fragrances that may trigger irritation or flare-ups. Adoption is further accelerated by dermatologist endorsements and clinical validation, positioning fragrance-free products as safer and more trustworthy.

The segment’s growth is also reinforced by its overlap with hypoallergenic and sensitive-skin-safe claims, making it a cornerstone of rosacea-focused skincare portfolios. As clean-label and vegan claims gain traction, fragrance-free remains the backbone of trust and compliance in the global rosacea skincare landscape.
Insights into the Function Segment with Redness Reduction Dominating the Demand

Rosacea Targeting Skincare Market By Function

Function Value Share% 2025
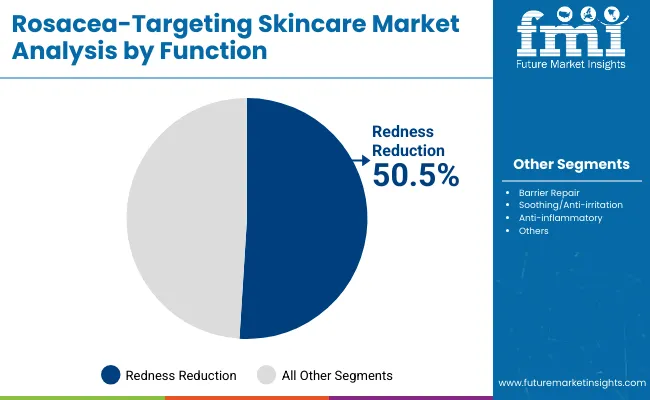
Redness reduction 50.5%
Others 49.5%

The redness reduction segment is forecasted to hold 50.5% of the market share in 2025, led by its strong application in addressing visible facial redness, a core concern for rosacea patients. These formulations are favored for their ability to calm inflamed skin, reduce flare-ups, and improve overall complexion, making them central to both prescription and over-the-counter products. Their widespread adoption in creams, serums, and cleansers reflects consumer demand for immediate soothing effects.

Growth is further supported by clinical validation and inclusion of active ingredients like azelaic acid and niacinamide, which enhance efficacy. As awareness of rosacea rises and consumers seek products with measurable improvements, redness reduction is expected to maintain its dominance in the global rosacea skincare landscape.
Insights into the Channel Segment with Pharmacies/Drugstores Leading in Market Share

Rosacea Targeting Skincare Market By Channel

Channel Value Share% 2025
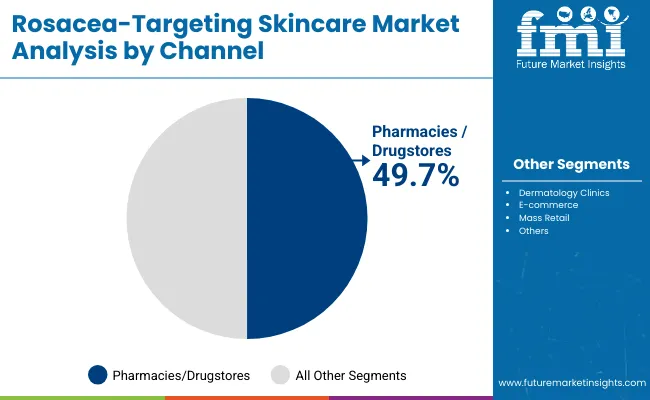
Pharmacies/drugstores 49.7%
Others 50.3%

The pharmacies/drugstores segment is projected to account for 49.7% of the Rosacea-Targeting Skincare Market revenue in 2025, establishing it as the leading distribution channel. This channel is preferred for its trusted environment, pharmacist guidance, and accessibility, which are critical for consumers managing a chronic condition like rosacea. Pharmacies provide a reliable platform for both over-the-counter dermocosmetic brands and dermatologist-recommended formulations.

Growth is further supported by the expansion of retail pharmacy chains, dedicated skincare sections, and hybrid pharmacy-e-commerce models that improve product availability. Given the balance of trust, accessibility, and professional validation, pharmacies/drugstores are expected to retain their leading role in the rosacea skincare market throughout the forecast period.

What are the Drivers, Restraints, and Key Trends of the Rosacea-Targeting Skincare Market?

Rising Dermatological Recommendations

One of the strongest growth drivers is the rising number of dermatologists recommending specialized rosacea skincare solutions. Clinical evidence supporting active ingredients like azelaic acid, niacinamide, and colloidal oatmeal has reinforced trust among patients and consumers. Prescription-backed endorsements, combined with OTC availability, are creating a bridge between medical treatment and cosmetic skincare. As awareness campaigns and dermatology consultations become more frequent, consumers are turning to products with proven efficacy. This trend ensures that clinically validated, dermatologist-tested products remain at the forefront of rosacea management, fueling steady market expansion worldwide.

Expansion of E-commerce and D2C Channels

The increasing role of e-commerce and direct-to-consumer (D2C) channels is a major driver of growth. Online platforms not only improve accessibility but also allow brands to leverage personalized recommendations, subscription models, and refill programs tailored to rosacea patients. D2C brands integrate AI-powered tools to customize skincare routines, further strengthening consumer engagement. This channel expansion is particularly strong in Asia-Pacific, where digital-first shopping behavior is surging. By removing barriers related to limited shelf space in traditional retail, e-commerce ensures wider product availability and accelerates adoption, especially among tech-savvy and younger demographics.

High Cost of Premium Dermocosmetics

A key restraint in the market is the high price of premium dermocosmetic products formulated for rosacea management. Specialized formulations often use organic-certified, cold-pressed oils or encapsulated actives, which raise manufacturing costs. This results in a pricing gap that restricts accessibility in emerging economies and among cost-sensitive consumers. While pharmacies and clinics offer credibility, they often stock higher-priced options, leaving budget-conscious buyers reliant on generic products. Such affordability challenges hinder market penetration across lower-income segments, slowing adoption despite growing demand. Addressing this cost barrier remains critical for unlocking untapped growth potential.

Clean Label and Sustainability Integration

A notable trend shaping the market is the integration of clean-label and sustainability claims in rosacea-targeting skincare. Consumers increasingly seek products that are not only effective but also safe, vegan, fragrance-free, and environmentally responsible. Brands are incorporating upcycled rice bran oil, biodegradable packaging, and refill models to enhance eco-credibility. At the same time, certification standards like COSMOS and NATRUE are gaining influence, reinforcing trust in ingredient sourcing and product safety. This alignment of skincare efficacy with sustainability values resonates with health-conscious and eco-aware consumers, positioning clean and green solutions as a key differentiator in competitive markets.
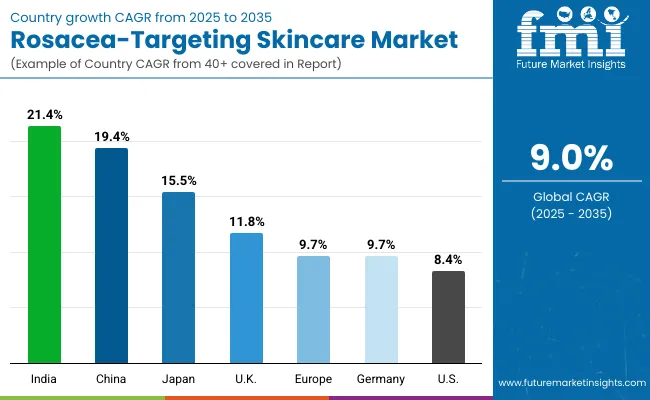
Analysis of Rosacea-Targeting Skincare Market By Key Countries

Rosacea Targeting Skincare Market By Country

Countries Estimated CAGR (2025 to 2035)
China 19.4%
USA 8.4%
India 21.4%
UK 11.8%
Germany 9.7%
Japan 15.5%

The global Rosacea-Targeting Skincare Market demonstrates notable disparities in adoption speed, influenced by consumer awareness, dermatological practices, and retail accessibility. Asia-Pacific emerges as the fastest-growing region, led by India (21.4% CAGR) and China (19.4% CAGR). India’s growth reflects increasing dermatology consultations, rising awareness of chronic skin conditions, and rapid e-commerce penetration.

China benefits from expanding dermocosmetic portfolios, digital-first skincare platforms, and premium consumer spending on sensitive-skin-safe products. Europe maintains a strong profile, anchored by Germany (9.7%) and the UK (11.8%), supported by clinical endorsement, regulatory standards, and demand for fragrance-free formulations. Japan (15.5%) shows strong uptake due to biotech-driven actives and consumer interest in microbiome-friendly skincare.

Meanwhile, North America, led by the USA (8.4%), records moderate but steady growth, reflecting market maturity and reliance on trusted pharmacy chains and established dermocosmetic brands.
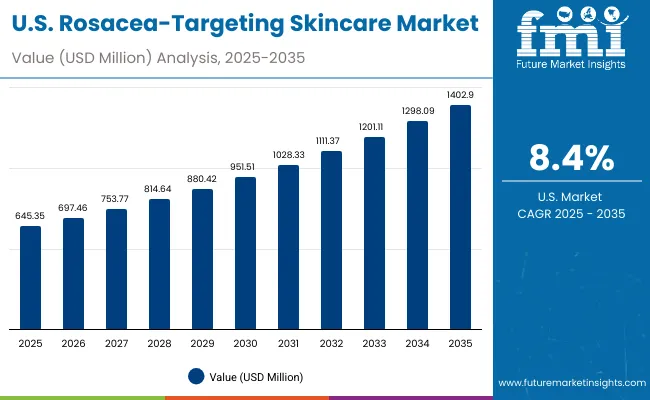
Sales Outlook for Rosacea-Targeting Skincare in the United States

Rosacea Targeting Skincare Market Usa

Year USA Rosacea-Targeting Skincare Market (USD Million)
2025 645.35
2026 697.46
2027 753.77
2028 814.64
2029 880.42
2030 951.51
2031 1,028.33
2032 1,111.37
2033 1,201.11
2034 1,298.09
2035 1,402.90

The Rosacea-Targeting Skincare Market in the United States is projected to grow at a CAGR of 8.4% from 2025 to 2035, driven by rising consumer awareness, dermatological recommendations, and increased availability of dermocosmetic formulations. Pharmacies and drugstores remain the dominant distribution channel, but e-commerce growth is accelerating, particularly through D2C brands offering fragrance-free and dermatologist-tested products. Demand for redness-reduction formulations and barrier-repair creams is high, supported by consumers seeking long-term solutions for sensitive skin. Premiumization trends, AI-personalized skincare routines, and subscription-based models are further boosting recurring revenues.

  • Pharmacies/drugstores remain the primary sales channel, capturing nearly half of the market in 2025.
  • Fragrance-free formulations are the leading claim, contributing 58.6% of USA revenue in 2025.
  • Redness-reduction products are the top function, addressing a core consumer need in rosacea management.

Growth and Expansion Outlook for Rosacea-Targeting Skincare Market in the United Kingdom

The Rosacea-Targeting Skincare Market in the United Kingdom is expected to grow at a CAGR of 11.8% from 2025 to 2035, supported by rising demand for dermatologist-tested and fragrance-free formulations. Consumers are increasingly turning to barrier-repair creams and redness-reduction serums as awareness of rosacea as a chronic skin condition grows. Pharmacies and drugstores dominate distribution, but online platforms are gaining traction, offering access to international dermocosmetic brands and subscription-based sensitive skin product lines. Government-backed health campaigns on skin conditions, combined with strong collaboration between dermatology clinics and research institutions, continue to drive adoption.

  • Barrier-repair and soothing formulations are gaining prominence as the UK consumer base prioritizes long-term skin health.
  • Pharmacies and online retail platforms remain the core sales channels, with hybrid models increasing product accessibility.
  • Premium dermocosmetic brands like La Roche-Posay and Avene maintain strong leadership, while local startups are entering with clean-label and vegan alternatives.

Growth and Expansion Outlook for Rosacea-Targeting Skincare Market in India

India is witnessing rapid growth in the Rosacea-Targeting Skincare Market, which is forecast to expand at a CAGR of 21.4% through 2035, the fastest among all major countries. This expansion is fueled by rising awareness of rosacea-related skin conditions, increasing dermatology consultations, and the availability of affordable formulations in tier-2 and tier-3 cities. Pharmacies and e-commerce platforms are broadening access, while international brands are entering the market with tailored solutions for sensitive Indian skin. Educational campaigns and dermatology-led outreach are further improving diagnosis and treatment adoption.

  • Tier-2 city adoption is accelerating as affordable OTC rosacea creams and cleansers gain traction.
  • Pharmacies and e-commerce platforms are bridging the access gap by expanding product reach beyond metros.
  • Premium dermocosmetic and clean-label brands are seeing strong uptake, particularly among urban millennial and Gen Z consumers.

Sales Outlook for Rosacea-Targeting Skincare in China

The Rosacea-Targeting Skincare Market in China is expected to grow at a CAGR of 19.4% from 2025 to 2035, the highest among leading economies. Growth is driven by rising prevalence of skin sensitivities, increasing consumer awareness of rosacea, and the rapid expansion of dermocosmetic brands through online-first and cross-border e-commerce platforms. Premium skincare adoption is accelerating in urban centers, while affordable OTC formulations are gaining traction in lower-tier cities. Local firms are innovating with clean-label and herbal-based formulations, while global brands are competing on premium dermatologist-tested claims.
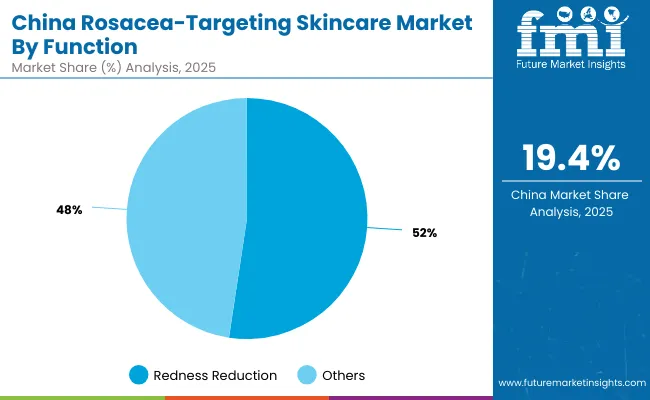
  • Redness-reduction products dominate demand, contributing 52.4% of China’s rosacea skincare revenue in 2025.
  • E-commerce platforms remain the strongest channel, fueling accessibility across urban and rural areas.
  • Domestic brands offering cost-effective solutions are expanding rapidly, challenging international incumbents.

In-depth Analysis of Rosacea-Targeting Skincare in Germany

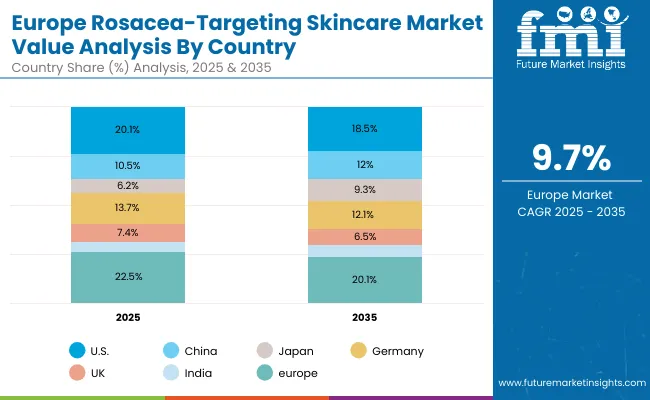
Rosacea Targeting Skincare Market Europe

Countries 2025 Share (%)
USA 20.1%
China 10.5%
Japan 6.2%
Germany 13.7%
UK 7.4%
India 4.6%
Countries 2035 Share (%)
USA 18.5%
China 12.0%
Japan 9.3%
Germany 12.1%
UK 6.5%
India 5.3%

The Rosacea-Targeting Skincare Market in Germany is projected to grow at a CAGR of 9.7% from 2025 to 2035, reflecting steady expansion in one of Europe’s most established dermocosmetic markets. Growth is underpinned by strong consumer demand for dermatologist-tested and fragrance-free formulations, along with high awareness of skin health and regulatory emphasis on product safety. German pharmacies remain a critical sales channel, supported by online distribution platforms catering to premium and niche skincare lines. Rising adoption of redness-reduction and barrier-repair products, combined with consumer preference for organic-certified and clean-label claims, reinforces the country’s leadership in Europe.
  • Pharmacies dominate distribution, with strong trust among German consumers.
  • Fragrance-free and hypoallergenic claims are driving brand differentiation.
  • Premium dermocosmetic brands such as Eucerin and Bioderma hold strong market positions, supported by EU-wide compliance standards.

Growth Outlook for Rosacea-Targeting Skincare Market in USA

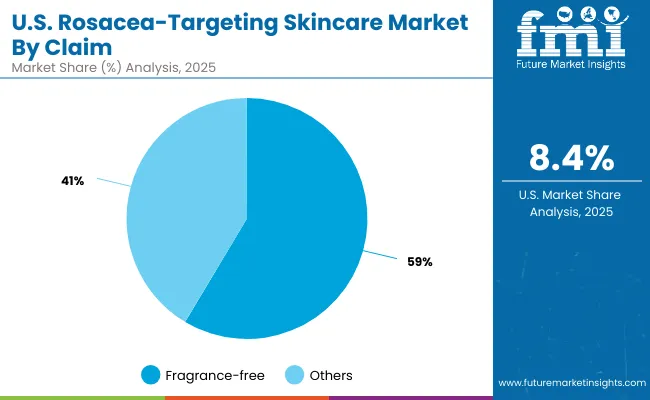
Rosacea Targeting Skincare Market Usa 2

USA by Claim Value Share% 2025
Fragrance-free 58.6%
Others 41.4%

The Rosacea-Targeting Skincare Market in the United States is projected to expand steadily at a CAGR of 8.4% from 2025 to 2035, with revenue increasing from USD 645.4 million in 2025 to USD 1,402.9 million by 2035. Growth is strongly driven by the dominance of fragrance-free formulations, which account for 58.6% of USA sales in 2025, reflecting consumer preference for sensitive-skin-safe products. Pharmacies/drugstores remain the leading sales channel, though e-commerce is rising rapidly as subscription-based and AI-personalized skincare routines become mainstream. Premium dermocosmetic brands such as La Roche-Posay, Cetaphil, and Aveeno continue to lead, while digital-first entrants are expanding through D2C strategies.
  • Fragrance-free products dominate, addressing core sensitivity and irritation concerns.
  • Pharmacies/drugstores remain the trusted hub for rosacea skincare purchases.
  • E-commerce and D2C platforms are accelerating growth with digital personalization.

Opportunity Analysis of China Rosacea-Targeting Skincare Market

Rosacea Targeting Skincare Market China

China by Function Value Share% 2025
Redness reduction 52.4%
Others 47.6%

The Rosacea-Targeting Skincare Market in China presents significant growth opportunities, with a forecast CAGR of 19.4% from 2025 to 2035, the highest among leading countries. The dominance of redness reduction formulations (52.4% share in 2025) reflects consumer demand for visible relief from rosacea flare-ups, particularly in urban areas where skin sensitivity concerns are increasing. Growth is supported by the rapid expansion of cross-border e-commerce platforms, K-beauty-inspired dermocosmetic routines, and local innovation in herbal-based formulations. Premium opportunities lie in organic-certified, fragrance-free, and sensitive-skin-safe lines, while affordable OTC products in tier-2 and tier-3 cities are expected to drive mass adoption.
  • Market size in 2025: USD 337.4 million, with double-digit CAGR through 2035.
  • Global share rising: from 10.5% in 2025 to 12.0% by 2035.
  • Redness reduction leads: as the dominant functional category in 2025.

Competitive Landscape of Rosacea-Targeting Skincare Market

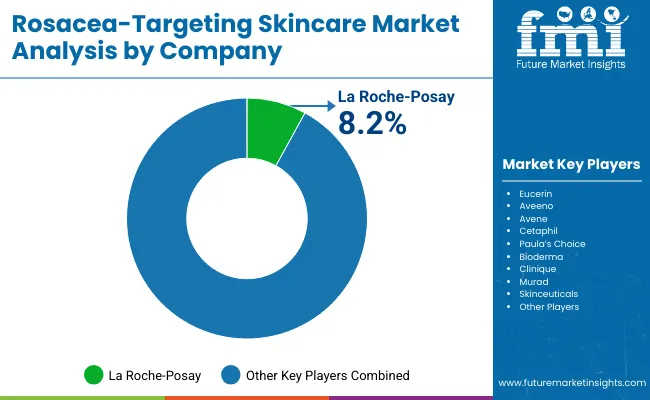
Rosacea Targeting Skincare Market By Company

The Rosacea-Targeting Skincare Market is moderately fragmented, with global dermocosmetic leaders, mid-sized innovators, and niche-focused brands competing across various claims and formulations. La Roche-Posay holds the largest single share (8.2%), supported by its dermatologist-recommended fragrance-free and sensitive-skin-safe product lines. Established global players such as Eucerin, Aveeno, Avene, Cetaphil, and Bioderma maintain strong positions through pharmacies, dermatology clinics, and e-commerce expansion, emphasizing dermatologist-tested claims and clinical validation.

Mid-sized innovators, including Paula’s Choice, Clinique, and Murad, are gaining traction with serums and targeted treatments, often leveraging AI-personalized skincare platforms and D2C subscription models. Specialized niche brands are focusing on clean-label, vegan, and organic-certified formulations, addressing growing demand for sustainability and natural actives such as centellaasiatica and colloidal oatmeal.

Competitive differentiation is shifting from traditional dermatologist endorsements alone toward integrated strategies that combine digital personalization, refillable packaging, eco-certifications, and omnichannel distribution models.

Key Developments in Rosacea-Targeting Skincare Market

  • On January 19, 2025, La Roche-Posay announced the launch of a new AI-personalized rosacea skincare routine builder on its D2C platform in China. The tool combines dermatologist input with consumer skin data to recommend tailored fragrance-free and redness-reduction formulations, strengthening the brand’s position in Asia-Pacific.
  • On June 14, 2025, Eucerin partnered with major European pharmacy chains to introduce its organic-certified rosacea relief cream featuring colloidal oatmeal and centellaasiatica. This expansion enhances accessibility across Germany and the UK, while reinforcing its clean-label and dermatologist-tested positioning in the European market.

Scope of the Report

Item Value
Quantitative Units USD 3,203.5 Million
Function Redness reduction, Barrier repair, Soothing/anti-irritation, Anti-inflammatory
Product Type Creams/lotions, Serums, Cleansers, Gels
Active Ingredient Niacinamide, Azelaic acid, Centella asiatica, Colloidal oatmeal
Claim Fragrance-free, Hypoallergenic, Dermatologist-tested, Sensitive skin safe
Channel Pharmacies/drugstores, Dermatology clinics, E-commerce, Mass retail
Regions Covered North America, Europe, Asia-Pacific, Latin America, Middle East & Africa
Country Covered United States, Canada, Germany, France, United Kingdom, China, Japan, India, Brazil, South Africa
Key Companies Profiled La Roche- Posay, Eucerin, Aveeno, Avene, Cetaphil, Paula’s Choice, Bioderma, Clinique, Murad, Skinceuticals
Additional Attributes Dollar sales by claim, function, product type, and channel, alongside adoption trends in dermatologist-tested and fragrance-free formulations. Rising demand for serums, creams, and barrier-repair solutions highlights consumer preference for multifunctional products. Growth is sector-specific, with strong uptake in dermatology clinics, pharmacies, and e-commerce platforms, while premium lines expand through AI-personalized routines and subscription models. Regional trends are shaped by rapid adoption in Asia-Pacific and steady expansion in Europe and North America, supported by innovations in clean-label, organic-certified, and sensitive-skin-safe formulations.

Key Segments

By Function:

  • Redness reduction
  • Barrier repair
  • Soothing/anti-irritation
  • Anti-inflammatory

By Product Type:

  • Serums
  • Cleansers
  • Creams/lotions
  • Gels

By Active Ingredient:

  • Niacinamide
  • Azelaic acid
  • Centella asiatica
  • Colloidal oatmeal

By Channel:

  • E-commerce
  • Dermatology clinics
  • Pharmacies/drugstores
  • Mass retail

By Claim:

  • Hypoallergenic
  • Fragrance-free
  • Dermatologist-tested
  • Sensitive skin safe

By Region:

  • North America
  • Latin America
  • Europe
  • East Asia
  • South Asia & Pacific
  • Middle East and Africa

Frequently Asked Questions

How big is the Rosacea-Targeting Skincare Market in 2025?

The global Rosacea-Targeting Skincare Market is estimated to be valued at USD 3,203.5 million in 2025.

What will be the size of Rosacea-Targeting Skincare Market in 2035?

The market size for the Rosacea-Targeting Skincare Market is projected to reach USD 7,601.8 million by 2035.

How much will be the Rosacea-Targeting Skincare Market growth between 2025 and 2035?

The Rosacea-Targeting Skincare Market is expected to grow at a 9.0% CAGR between 2025 and 2035.

What are the key product types in the Rosacea-Targeting Skincare Market?

The key product types in Rosacea-Targeting Skincare Market are Creams/lotions, Serums, Cleansers, Gels

Which range segment to contribute significant share in the Rosacea-Targeting Skincare Market in 2025?

In terms of range, Fragrance-free from Claim segment to command 56.6% share in the Rosacea-Targeting Skincare Market in 2025.

Table of Content

  1. Executive Summary
    • Global Market Outlook
    • Demand-side Trends
    • Supply-side Trends
    • Technology Roadmap Analysis
    • Analysis and Recommendations
  2. Market Overview
    • Market Coverage / Taxonomy
    • Market Definition / Scope / Limitations
  3. Market Background
    • Market Dynamics
      • Drivers
      • Restraints
      • Opportunity
      • Trends
    • Scenario Forecast
      • Demand in Optimistic Scenario
      • Demand in Likely Scenario
      • Demand in Conservative Scenario
    • Opportunity Map Analysis
    • Product Life Cycle Analysis
    • Supply Chain Analysis
      • Supply Side Participants and their Roles
        • Producers
        • Mid-Level Participants (Traders/ Agents/ Brokers)
        • Wholesalers and Distributors
      • Value Added and Value Created at Node in the Supply Chain
      • List of Raw Material Suppliers
      • List of Existing and Potential Buyer’s
    • Investment Feasibility Matrix
    • Value Chain Analysis
      • Profit Margin Analysis
      • Wholesalers and Distributors
      • Retailers
    • PESTLE and Porter’s Analysis
    • Regulatory Landscape
      • By Key Regions
      • By Key Countries
    • Regional Parent Market Outlook
    • Production and Consumption Statistics
    • Import and Export Statistics
  4. Global Market Analysis 2020 to 2024 and Forecast, 2025 to 2035
    • Historical Market Size Value (USD Million) & Volume (Units) Analysis, 2020 to 2024
    • Current and Future Market Size Value (USD Million) & Volume (Units) Projections, 2025 to 2035
      • Y-o-Y Growth Trend Analysis
      • Absolute $ Opportunity Analysis
  5. Global Market Analysis 2020 to 2024 and Forecast 2025 to 2035, By Function
    • Introduction / Key Findings
    • Historical Market Size Value (USD Million) & Volume (Units) Analysis By Function, 2020 to 2024
    • Current and Future Market Size Value (USD Million) & Volume (Units) Analysis and Forecast By Function, 2025 to 2035
      • Redness reduction
      • Barrier repair
      • Soothing/anti-irritation
      • Anti-inflammatory
    • Y-o-Y Growth Trend Analysis By Function, 2020 to 2024
    • Absolute $ Opportunity Analysis By Function, 2025 to 2035
  6. Global Market Analysis 2020 to 2024 and Forecast 2025 to 2035, By Product Type
    • Introduction / Key Findings
    • Historical Market Size Value (USD Million) & Volume (Units) Analysis By Product Type, 2020 to 2024
    • Current and Future Market Size Value (USD Million) & Volume (Units) Analysis and Forecast By Product Type, 2025 to 2035
      • Serums
      • Cleansers
      • Creams/lotions
      • Gels
    • Y-o-Y Growth Trend Analysis By Product Type, 2020 to 2024
    • Absolute $ Opportunity Analysis By Product Type, 2025 to 2035
  7. Global Market Analysis 2020 to 2024 and Forecast 2025 to 2035, By Active Ingredient
    • Introduction / Key Findings
    • Historical Market Size Value (USD Million) & Volume (Units) Analysis By Active Ingredient, 2020 to 2024
    • Current and Future Market Size Value (USD Million) & Volume (Units) Analysis and Forecast By Active Ingredient, 2025 to 2035
      • Niacinamide
      • Azelaic acid
      • Centella asiatica
      • Colloidal oatmeal
    • Y-o-Y Growth Trend Analysis By Active Ingredient, 2020 to 2024
    • Absolute $ Opportunity Analysis By Active Ingredient, 2025 to 2035
  8. Global Market Analysis 2020 to 2024 and Forecast 2025 to 2035, By Channel
    • Introduction / Key Findings
    • Historical Market Size Value (USD Million) & Volume (Units) Analysis By Channel, 2020 to 2024
    • Current and Future Market Size Value (USD Million) & Volume (Units) Analysis and Forecast By Channel, 2025 to 2035
      • E-commerce
      • Dermatology clinics
      • Pharmacies/drugstores
      • Mass retail
    • Y-o-Y Growth Trend Analysis By Channel, 2020 to 2024
    • Absolute $ Opportunity Analysis By Channel, 2025 to 2035
  9. Global Market Analysis 2020 to 2024 and Forecast 2025 to 2035, By Claim
    • Introduction / Key Findings
    • Historical Market Size Value (USD Million) & Volume (Units) Analysis By Claim, 2020 to 2024
    • Current and Future Market Size Value (USD Million) & Volume (Units) Analysis and Forecast By Claim, 2025 to 2035
      • Hypoallergenic
      • Fragrance-free
      • Dermatologist-tested
      • Sensitive skin safe
    • Y-o-Y Growth Trend Analysis By Claim, 2020 to 2024
    • Absolute $ Opportunity Analysis By Claim, 2025 to 2035
  10. Global Market Analysis 2020 to 2024 and Forecast 2025 to 2035, By Region
    • Introduction
    • Historical Market Size Value (USD Million) & Volume (Units) Analysis By Region, 2020 to 2024
    • Current Market Size Value (USD Million) & Volume (Units) Analysis and Forecast By Region, 2025 to 2035
      • North America
      • Latin America
      • Europe
      • East Asia
      • South Asia & Pacific
      • Middle East and Africa
    • Market Attractiveness Analysis By Region
  11. North America Market Analysis 2020 to 2024 and Forecast 2025 to 2035, By Country
    • Historical Market Size Value (USD Million) & Volume (Units) Trend Analysis By Market Taxonomy, 2020 to 2024
    • Market Size Value (USD Million) & Volume (Units) Forecast By Market Taxonomy, 2025 to 2035
      • By Country
        • USA
        • Canada
      • By Function
      • By Product Type
      • By Active Ingredient
      • By Channel
      • By Claim
    • Market Attractiveness Analysis
      • By Country
      • By Function
      • By Product Type
      • By Active Ingredient
      • By Channel
      • By Claim
    • Key Takeaways
  12. Latin America Market Analysis 2020 to 2024 and Forecast 2025 to 2035, By Country
    • Historical Market Size Value (USD Million) & Volume (Units) Trend Analysis By Market Taxonomy, 2020 to 2024
    • Market Size Value (USD Million) & Volume (Units) Forecast By Market Taxonomy, 2025 to 2035
      • By Country
        • Brazil
        • Mexico
        • Colombia
        • Rest of Latin America
      • By Function
      • By Product Type
      • By Active Ingredient
      • By Channel
      • By Claim
    • Market Attractiveness Analysis
      • By Country
      • By Function
      • By Product Type
      • By Active Ingredient
      • By Channel
      • By Claim
    • Key Takeaways
  13. Europe Market Analysis 2020 to 2024 and Forecast 2025 to 2035, By Country
    • Historical Market Size Value (USD Million) & Volume (Units) Trend Analysis By Market Taxonomy, 2020 to 2024
    • Market Size Value (USD Million) & Volume (Units) Forecast By Market Taxonomy, 2025 to 2035
      • By Country
        • Germany
        • UK
        • France
        • Italy
        • Spain
        • Belgium
        • Netherlands
        • Nordic
        • Switzerland
        • Russia
        • Poland
        • Rest of Europe
      • By Function
      • By Product Type
      • By Active Ingredient
      • By Channel
      • By Claim
    • Market Attractiveness Analysis
      • By Country
      • By Function
      • By Product Type
      • By Active Ingredient
      • By Channel
      • By Claim
    • Key Takeaways
  14. East Asia Market Analysis 2020 to 2024 and Forecast 2025 to 2035, By Country
    • Historical Market Size Value (USD Million) & Volume (Units) Trend Analysis By Market Taxonomy, 2020 to 2024
    • Market Size Value (USD Million) & Volume (Units) Forecast By Market Taxonomy, 2025 to 2035
      • By Country
        • China
        • Japan
        • South Korea
      • By Function
      • By Product Type
      • By Active Ingredient
      • By Channel
      • By Claim
    • Market Attractiveness Analysis
      • By Country
      • By Function
      • By Product Type
      • By Active Ingredient
      • By Channel
      • By Claim
    • Key Takeaways
  15. South Asia & Pacific Market Analysis 2020 to 2024 and Forecast 2025 to 2035, By Country
    • Historical Market Size Value (USD Million) & Volume (Units) Trend Analysis By Market Taxonomy, 2020 to 2024
    • Market Size Value (USD Million) & Volume (Units) Forecast By Market Taxonomy, 2025 to 2035
      • By Country
        • India
        • Thailand
        • Malaysia
        • Indonesia
        • Singapore
        • Vietnam
        • Australia
        • New Zealand
        • Rest of South Asia
      • By Function
      • By Product Type
      • By Active Ingredient
      • By Channel
      • By Claim
    • Market Attractiveness Analysis
      • By Country
      • By Function
      • By Product Type
      • By Active Ingredient
      • By Channel
      • By Claim
    • Key Takeaways
  16. Middle East and Africa Market Analysis 2020 to 2024 and Forecast 2025 to 2035, By Country
    • Historical Market Size Value (USD Million) & Volume (Units) Trend Analysis By Market Taxonomy, 2020 to 2024
    • Market Size Value (USD Million) & Volume (Units) Forecast By Market Taxonomy, 2025 to 2035
      • By Country
        • Turkey
        • UAE
        • Saudi Arabia
        • Israel
        • Other GCC Countries
        • North Africa
        • South Africa
      • By Function
      • By Product Type
      • By Active Ingredient
      • By Channel
      • By Claim
    • Market Attractiveness Analysis
      • By Country
      • By Function
      • By Product Type
      • By Active Ingredient
      • By Channel
      • By Claim
    • Key Takeaways
  17. Key Countries Market Analysis
    • USA
      • Pricing Analysis
      • Market Share Analysis, 2024
        • By Function
        • By Product Type
        • By Active Ingredient
        • By Channel
        • By Claim
    • Canada
      • Pricing Analysis
      • Market Share Analysis, 2024
        • By Function
        • By Product Type
        • By Active Ingredient
        • By Channel
        • By Claim
    • Brazil
      • Pricing Analysis
      • Market Share Analysis, 2024
        • By Function
        • By Product Type
        • By Active Ingredient
        • By Channel
        • By Claim
    • Mexico
      • Pricing Analysis
      • Market Share Analysis, 2024
        • By Function
        • By Product Type
        • By Active Ingredient
        • By Channel
        • By Claim
    • Colombia
      • Pricing Analysis
      • Market Share Analysis, 2024
        • By Function
        • By Product Type
        • By Active Ingredient
        • By Channel
        • By Claim
    • Germany
      • Pricing Analysis
      • Market Share Analysis, 2024
        • By Function
        • By Product Type
        • By Active Ingredient
        • By Channel
        • By Claim
    • UK
      • Pricing Analysis
      • Market Share Analysis, 2024
        • By Function
        • By Product Type
        • By Active Ingredient
        • By Channel
        • By Claim
    • France
      • Pricing Analysis
      • Market Share Analysis, 2024
        • By Function
        • By Product Type
        • By Active Ingredient
        • By Channel
        • By Claim
    • Italy
      • Pricing Analysis
      • Market Share Analysis, 2024
        • By Function
        • By Product Type
        • By Active Ingredient
        • By Channel
        • By Claim
    • Spain
      • Pricing Analysis
      • Market Share Analysis, 2024
        • By Function
        • By Product Type
        • By Active Ingredient
        • By Channel
        • By Claim
    • Belgium
      • Pricing Analysis
      • Market Share Analysis, 2024
        • By Function
        • By Product Type
        • By Active Ingredient
        • By Channel
        • By Claim
    • Netherlands
      • Pricing Analysis
      • Market Share Analysis, 2024
        • By Function
        • By Product Type
        • By Active Ingredient
        • By Channel
        • By Claim
    • Nordic
      • Pricing Analysis
      • Market Share Analysis, 2024
        • By Function
        • By Product Type
        • By Active Ingredient
        • By Channel
        • By Claim
    • Switzerland
      • Pricing Analysis
      • Market Share Analysis, 2024
        • By Function
        • By Product Type
        • By Active Ingredient
        • By Channel
        • By Claim
    • Russia
      • Pricing Analysis
      • Market Share Analysis, 2024
        • By Function
        • By Product Type
        • By Active Ingredient
        • By Channel
        • By Claim
    • Poland
      • Pricing Analysis
      • Market Share Analysis, 2024
        • By Function
        • By Product Type
        • By Active Ingredient
        • By Channel
        • By Claim
    • China
      • Pricing Analysis
      • Market Share Analysis, 2024
        • By Function
        • By Product Type
        • By Active Ingredient
        • By Channel
        • By Claim
    • Japan
      • Pricing Analysis
      • Market Share Analysis, 2024
        • By Function
        • By Product Type
        • By Active Ingredient
        • By Channel
        • By Claim
    • South Korea
      • Pricing Analysis
      • Market Share Analysis, 2024
        • By Function
        • By Product Type
        • By Active Ingredient
        • By Channel
        • By Claim
    • India
      • Pricing Analysis
      • Market Share Analysis, 2024
        • By Function
        • By Product Type
        • By Active Ingredient
        • By Channel
        • By Claim
    • Thailand
      • Pricing Analysis
      • Market Share Analysis, 2024
        • By Function
        • By Product Type
        • By Active Ingredient
        • By Channel
        • By Claim
    • Indonesia
      • Pricing Analysis
      • Market Share Analysis, 2024
        • By Function
        • By Product Type
        • By Active Ingredient
        • By Channel
        • By Claim
    • Australia
      • Pricing Analysis
      • Market Share Analysis, 2024
        • By Function
        • By Product Type
        • By Active Ingredient
        • By Channel
        • By Claim
    • New Zealand
      • Pricing Analysis
      • Market Share Analysis, 2024
        • By Function
        • By Product Type
        • By Active Ingredient
        • By Channel
        • By Claim
    • Turkey
      • Pricing Analysis
      • Market Share Analysis, 2024
        • By Function
        • By Product Type
        • By Active Ingredient
        • By Channel
        • By Claim
    • UAE
      • Pricing Analysis
      • Market Share Analysis, 2024
        • By Function
        • By Product Type
        • By Active Ingredient
        • By Channel
        • By Claim
    • Saudi Arabia
      • Pricing Analysis
      • Market Share Analysis, 2024
        • By Function
        • By Product Type
        • By Active Ingredient
        • By Channel
        • By Claim
    • Israel
      • Pricing Analysis
      • Market Share Analysis, 2024
        • By Function
        • By Product Type
        • By Active Ingredient
        • By Channel
        • By Claim
    • North Africa
      • Pricing Analysis
      • Market Share Analysis, 2024
        • By Function
        • By Product Type
        • By Active Ingredient
        • By Channel
        • By Claim
    • South Africa
      • Pricing Analysis
      • Market Share Analysis, 2024
        • By Function
        • By Product Type
        • By Active Ingredient
        • By Channel
        • By Claim
  18. Market Structure Analysis
    • Competition Dashboard
    • Competition Benchmarking
    • Market Share Analysis of Top Players
      • By Regional
      • By Function
      • By Product Type
      • By Active Ingredient
      • By Channel
      • By Claim
  19. Competition Analysis
    • Competition Deep Dive
      • La Roche-Posay
        • Overview
        • Product Portfolio
        • Profitability by Market Segments (Product/Age /Sales Channel/Region)
        • Sales Footprint
        • Strategy Overview
          • Marketing Strategy
          • Product Strategy
          • Channel Strategy
      • Eucerin
        • Overview
        • Product Portfolio
        • Profitability by Market Segments (Product/Age /Sales Channel/Region)
        • Sales Footprint
        • Strategy Overview
          • Marketing Strategy
          • Product Strategy
          • Channel Strategy
      • Aveeno
        • Overview
        • Product Portfolio
        • Profitability by Market Segments (Product/Age /Sales Channel/Region)
        • Sales Footprint
        • Strategy Overview
          • Marketing Strategy
          • Product Strategy
          • Channel Strategy
      • Avene
        • Overview
        • Product Portfolio
        • Profitability by Market Segments (Product/Age /Sales Channel/Region)
        • Sales Footprint
        • Strategy Overview
          • Marketing Strategy
          • Product Strategy
          • Channel Strategy
      • Cetaphil
        • Overview
        • Product Portfolio
        • Profitability by Market Segments (Product/Age /Sales Channel/Region)
        • Sales Footprint
        • Strategy Overview
          • Marketing Strategy
          • Product Strategy
          • Channel Strategy
      • Paula’s Choice
        • Overview
        • Product Portfolio
        • Profitability by Market Segments (Product/Age /Sales Channel/Region)
        • Sales Footprint
        • Strategy Overview
          • Marketing Strategy
          • Product Strategy
          • Channel Strategy
      • Bioderma
        • Overview
        • Product Portfolio
        • Profitability by Market Segments (Product/Age /Sales Channel/Region)
        • Sales Footprint
        • Strategy Overview
          • Marketing Strategy
          • Product Strategy
          • Channel Strategy
      • Clinique
        • Overview
        • Product Portfolio
        • Profitability by Market Segments (Product/Age /Sales Channel/Region)
        • Sales Footprint
        • Strategy Overview
          • Marketing Strategy
          • Product Strategy
          • Channel Strategy
      • Murad
        • Overview
        • Product Portfolio
        • Profitability by Market Segments (Product/Age /Sales Channel/Region)
        • Sales Footprint
        • Strategy Overview
          • Marketing Strategy
          • Product Strategy
          • Channel Strategy
      • Skinceuticals
        • Overview
        • Product Portfolio
        • Profitability by Market Segments (Product/Age /Sales Channel/Region)
        • Sales Footprint
        • Strategy Overview
          • Marketing Strategy
          • Product Strategy
          • Channel Strategy
      • Others
        • Overview
        • Product Portfolio
        • Profitability by Market Segments (Product/Age /Sales Channel/Region)
        • Sales Footprint
        • Strategy Overview
          • Marketing Strategy
          • Product Strategy
          • Channel Strategy
  20. Assumptions & Acronyms Used
  21. Research Methodology

List of Tables

  • Table 1: Global Market Value (USD Million) Forecast by Region, 2020-2035
  • Table 2: Global Market Volume (Units) Forecast by Region, 2020-2035
  • Table 3: Global Market Value (USD Million) Forecast by Function, 2020-2035
  • Table 4: Global Market Volume (Units) Forecast by Function, 2020-2035
  • Table 5: Global Market Value (USD Million) Forecast by Product Type, 2020-2035
  • Table 6: Global Market Volume (Units) Forecast by Product Type, 2020-2035
  • Table 7: Global Market Value (USD Million) Forecast by Active Ingredient, 2020-2035
  • Table 8: Global Market Volume (Units) Forecast by Active Ingredient, 2020-2035
  • Table 9: Global Market Value (USD Million) Forecast by Channel, 2020-2035
  • Table 10: Global Market Volume (Units) Forecast by Channel, 2020-2035
  • Table 11: Global Market Value (USD Million) Forecast by Claim, 2020-2035
  • Table 12: Global Market Volume (Units) Forecast by Claim, 2020-2035
  • Table 13: North America Market Value (USD Million) Forecast by Country, 2020-2035
  • Table 14: North America Market Volume (Units) Forecast by Country, 2020-2035
  • Table 15: North America Market Value (USD Million) Forecast by Function, 2020-2035
  • Table 16: North America Market Volume (Units) Forecast by Function, 2020-2035
  • Table 17: North America Market Value (USD Million) Forecast by Product Type, 2020-2035
  • Table 18: North America Market Volume (Units) Forecast by Product Type, 2020-2035
  • Table 19: North America Market Value (USD Million) Forecast by Active Ingredient, 2020-2035
  • Table 20: North America Market Volume (Units) Forecast by Active Ingredient, 2020-2035
  • Table 21: North America Market Value (USD Million) Forecast by Channel, 2020-2035
  • Table 22: North America Market Volume (Units) Forecast by Channel, 2020-2035
  • Table 23: North America Market Value (USD Million) Forecast by Claim, 2020-2035
  • Table 24: North America Market Volume (Units) Forecast by Claim, 2020-2035
  • Table 25: Latin America Market Value (USD Million) Forecast by Country, 2020-2035
  • Table 26: Latin America Market Volume (Units) Forecast by Country, 2020-2035
  • Table 27: Latin America Market Value (USD Million) Forecast by Function, 2020-2035
  • Table 28: Latin America Market Volume (Units) Forecast by Function, 2020-2035
  • Table 29: Latin America Market Value (USD Million) Forecast by Product Type, 2020-2035
  • Table 30: Latin America Market Volume (Units) Forecast by Product Type, 2020-2035
  • Table 31: Latin America Market Value (USD Million) Forecast by Active Ingredient, 2020-2035
  • Table 32: Latin America Market Volume (Units) Forecast by Active Ingredient, 2020-2035
  • Table 33: Latin America Market Value (USD Million) Forecast by Channel, 2020-2035
  • Table 34: Latin America Market Volume (Units) Forecast by Channel, 2020-2035
  • Table 35: Latin America Market Value (USD Million) Forecast by Claim, 2020-2035
  • Table 36: Latin America Market Volume (Units) Forecast by Claim, 2020-2035
  • Table 37: Europe Market Value (USD Million) Forecast by Country, 2020-2035
  • Table 38: Europe Market Volume (Units) Forecast by Country, 2020-2035
  • Table 39: Europe Market Value (USD Million) Forecast by Function, 2020-2035
  • Table 40: Europe Market Volume (Units) Forecast by Function, 2020-2035
  • Table 41: Europe Market Value (USD Million) Forecast by Product Type, 2020-2035
  • Table 42: Europe Market Volume (Units) Forecast by Product Type, 2020-2035
  • Table 43: Europe Market Value (USD Million) Forecast by Active Ingredient, 2020-2035
  • Table 44: Europe Market Volume (Units) Forecast by Active Ingredient, 2020-2035
  • Table 45: Europe Market Value (USD Million) Forecast by Channel, 2020-2035
  • Table 46: Europe Market Volume (Units) Forecast by Channel, 2020-2035
  • Table 47: Europe Market Value (USD Million) Forecast by Claim, 2020-2035
  • Table 48: Europe Market Volume (Units) Forecast by Claim, 2020-2035
  • Table 49: East Asia Market Value (USD Million) Forecast by Country, 2020-2035
  • Table 50: East Asia Market Volume (Units) Forecast by Country, 2020-2035
  • Table 51: East Asia Market Value (USD Million) Forecast by Function, 2020-2035
  • Table 52: East Asia Market Volume (Units) Forecast by Function, 2020-2035
  • Table 53: East Asia Market Value (USD Million) Forecast by Product Type, 2020-2035
  • Table 54: East Asia Market Volume (Units) Forecast by Product Type, 2020-2035
  • Table 55: East Asia Market Value (USD Million) Forecast by Active Ingredient, 2020-2035
  • Table 56: East Asia Market Volume (Units) Forecast by Active Ingredient, 2020-2035
  • Table 57: East Asia Market Value (USD Million) Forecast by Channel, 2020-2035
  • Table 58: East Asia Market Volume (Units) Forecast by Channel, 2020-2035
  • Table 59: East Asia Market Value (USD Million) Forecast by Claim, 2020-2035
  • Table 60: East Asia Market Volume (Units) Forecast by Claim, 2020-2035
  • Table 61: South Asia & Pacific Market Value (USD Million) Forecast by Country, 2020-2035
  • Table 62: South Asia & Pacific Market Volume (Units) Forecast by Country, 2020-2035
  • Table 63: South Asia & Pacific Market Value (USD Million) Forecast by Function, 2020-2035
  • Table 64: South Asia & Pacific Market Volume (Units) Forecast by Function, 2020-2035
  • Table 65: South Asia & Pacific Market Value (USD Million) Forecast by Product Type, 2020-2035
  • Table 66: South Asia & Pacific Market Volume (Units) Forecast by Product Type, 2020-2035
  • Table 67: South Asia & Pacific Market Value (USD Million) Forecast by Active Ingredient, 2020-2035
  • Table 68: South Asia & Pacific Market Volume (Units) Forecast by Active Ingredient, 2020-2035
  • Table 69: South Asia & Pacific Market Value (USD Million) Forecast by Channel, 2020-2035
  • Table 70: South Asia & Pacific Market Volume (Units) Forecast by Channel, 2020-2035
  • Table 71: South Asia & Pacific Market Value (USD Million) Forecast by Claim, 2020-2035
  • Table 72: South Asia & Pacific Market Volume (Units) Forecast by Claim, 2020-2035
  • Table 73: Middle East and Africa Market Value (USD Million) Forecast by Country, 2020-2035
  • Table 74: Middle East and Africa Market Volume (Units) Forecast by Country, 2020-2035
  • Table 75: Middle East and Africa Market Value (USD Million) Forecast by Function, 2020-2035
  • Table 76: Middle East and Africa Market Volume (Units) Forecast by Function, 2020-2035
  • Table 77: Middle East and Africa Market Value (USD Million) Forecast by Product Type, 2020-2035
  • Table 78: Middle East and Africa Market Volume (Units) Forecast by Product Type, 2020-2035
  • Table 79: Middle East and Africa Market Value (USD Million) Forecast by Active Ingredient, 2020-2035
  • Table 80: Middle East and Africa Market Volume (Units) Forecast by Active Ingredient, 2020-2035
  • Table 81: Middle East and Africa Market Value (USD Million) Forecast by Channel, 2020-2035
  • Table 82: Middle East and Africa Market Volume (Units) Forecast by Channel, 2020-2035
  • Table 83: Middle East and Africa Market Value (USD Million) Forecast by Claim, 2020-2035
  • Table 84: Middle East and Africa Market Volume (Units) Forecast by Claim, 2020-2035

List of Figures

  • Figure 1: Global Market Value (USD Million) by Function, 2025-2035
  • Figure 2: Global Market Value (USD Million) by Product Type, 2025-2035
  • Figure 3: Global Market Value (USD Million) by Active Ingredient, 2025-2035
  • Figure 4: Global Market Value (USD Million) by Channel, 2025-2035
  • Figure 5: Global Market Value (USD Million) by Claim, 2025-2035
  • Figure 6: Global Market Value (USD Million) by Region, 2025-2035
  • Figure 7: Global Market Value (USD Million) Analysis by Region, 2020-2035
  • Figure 8: Global Market Volume (Units) Analysis by Region, 2020-2035
  • Figure 9: Global Market Value Share (%) and BPS Analysis by Region, 2025-2035
  • Figure 10: Global Market Y-o-Y Growth (%) Projections by Region, 2025-2035
  • Figure 11: Global Market Value (USD Million) Analysis by Function, 2020-2035
  • Figure 12: Global Market Volume (Units) Analysis by Function, 2020-2035
  • Figure 13: Global Market Value Share (%) and BPS Analysis by Function, 2025-2035
  • Figure 14: Global Market Y-o-Y Growth (%) Projections by Function, 2025-2035
  • Figure 15: Global Market Value (USD Million) Analysis by Product Type, 2020-2035
  • Figure 16: Global Market Volume (Units) Analysis by Product Type, 2020-2035
  • Figure 17: Global Market Value Share (%) and BPS Analysis by Product Type, 2025-2035
  • Figure 18: Global Market Y-o-Y Growth (%) Projections by Product Type, 2025-2035
  • Figure 19: Global Market Value (USD Million) Analysis by Active Ingredient, 2020-2035
  • Figure 20: Global Market Volume (Units) Analysis by Active Ingredient, 2020-2035
  • Figure 21: Global Market Value Share (%) and BPS Analysis by Active Ingredient, 2025-2035
  • Figure 22: Global Market Y-o-Y Growth (%) Projections by Active Ingredient, 2025-2035
  • Figure 23: Global Market Value (USD Million) Analysis by Channel, 2020-2035
  • Figure 24: Global Market Volume (Units) Analysis by Channel, 2020-2035
  • Figure 25: Global Market Value Share (%) and BPS Analysis by Channel, 2025-2035
  • Figure 26: Global Market Y-o-Y Growth (%) Projections by Channel, 2025-2035
  • Figure 27: Global Market Value (USD Million) Analysis by Claim, 2020-2035
  • Figure 28: Global Market Volume (Units) Analysis by Claim, 2020-2035
  • Figure 29: Global Market Value Share (%) and BPS Analysis by Claim, 2025-2035
  • Figure 30: Global Market Y-o-Y Growth (%) Projections by Claim, 2025-2035
  • Figure 31: Global Market Attractiveness by Function, 2025-2035
  • Figure 32: Global Market Attractiveness by Product Type, 2025-2035
  • Figure 33: Global Market Attractiveness by Active Ingredient, 2025-2035
  • Figure 34: Global Market Attractiveness by Channel, 2025-2035
  • Figure 35: Global Market Attractiveness by Claim, 2025-2035
  • Figure 36: Global Market Attractiveness by Region, 2025-2035
  • Figure 37: North America Market Value (USD Million) by Function, 2025-2035
  • Figure 38: North America Market Value (USD Million) by Product Type, 2025-2035
  • Figure 39: North America Market Value (USD Million) by Active Ingredient, 2025-2035
  • Figure 40: North America Market Value (USD Million) by Channel, 2025-2035
  • Figure 41: North America Market Value (USD Million) by Claim, 2025-2035
  • Figure 42: North America Market Value (USD Million) by Country, 2025-2035
  • Figure 43: North America Market Value (USD Million) Analysis by Country, 2020-2035
  • Figure 44: North America Market Volume (Units) Analysis by Country, 2020-2035
  • Figure 45: North America Market Value Share (%) and BPS Analysis by Country, 2025-2035
  • Figure 46: North America Market Y-o-Y Growth (%) Projections by Country, 2025-2035
  • Figure 47: North America Market Value (USD Million) Analysis by Function, 2020-2035
  • Figure 48: North America Market Volume (Units) Analysis by Function, 2020-2035
  • Figure 49: North America Market Value Share (%) and BPS Analysis by Function, 2025-2035
  • Figure 50: North America Market Y-o-Y Growth (%) Projections by Function, 2025-2035
  • Figure 51: North America Market Value (USD Million) Analysis by Product Type, 2020-2035
  • Figure 52: North America Market Volume (Units) Analysis by Product Type, 2020-2035
  • Figure 53: North America Market Value Share (%) and BPS Analysis by Product Type, 2025-2035
  • Figure 54: North America Market Y-o-Y Growth (%) Projections by Product Type, 2025-2035
  • Figure 55: North America Market Value (USD Million) Analysis by Active Ingredient, 2020-2035
  • Figure 56: North America Market Volume (Units) Analysis by Active Ingredient, 2020-2035
  • Figure 57: North America Market Value Share (%) and BPS Analysis by Active Ingredient, 2025-2035
  • Figure 58: North America Market Y-o-Y Growth (%) Projections by Active Ingredient, 2025-2035
  • Figure 59: North America Market Value (USD Million) Analysis by Channel, 2020-2035
  • Figure 60: North America Market Volume (Units) Analysis by Channel, 2020-2035
  • Figure 61: North America Market Value Share (%) and BPS Analysis by Channel, 2025-2035
  • Figure 62: North America Market Y-o-Y Growth (%) Projections by Channel, 2025-2035
  • Figure 63: North America Market Value (USD Million) Analysis by Claim, 2020-2035
  • Figure 64: North America Market Volume (Units) Analysis by Claim, 2020-2035
  • Figure 65: North America Market Value Share (%) and BPS Analysis by Claim, 2025-2035
  • Figure 66: North America Market Y-o-Y Growth (%) Projections by Claim, 2025-2035
  • Figure 67: North America Market Attractiveness by Function, 2025-2035
  • Figure 68: North America Market Attractiveness by Product Type, 2025-2035
  • Figure 69: North America Market Attractiveness by Active Ingredient, 2025-2035
  • Figure 70: North America Market Attractiveness by Channel, 2025-2035
  • Figure 71: North America Market Attractiveness by Claim, 2025-2035
  • Figure 72: North America Market Attractiveness by Country, 2025-2035
  • Figure 73: Latin America Market Value (USD Million) by Function, 2025-2035
  • Figure 74: Latin America Market Value (USD Million) by Product Type, 2025-2035
  • Figure 75: Latin America Market Value (USD Million) by Active Ingredient, 2025-2035
  • Figure 76: Latin America Market Value (USD Million) by Channel, 2025-2035
  • Figure 77: Latin America Market Value (USD Million) by Claim, 2025-2035
  • Figure 78: Latin America Market Value (USD Million) by Country, 2025-2035
  • Figure 79: Latin America Market Value (USD Million) Analysis by Country, 2020-2035
  • Figure 80: Latin America Market Volume (Units) Analysis by Country, 2020-2035
  • Figure 81: Latin America Market Value Share (%) and BPS Analysis by Country, 2025-2035
  • Figure 82: Latin America Market Y-o-Y Growth (%) Projections by Country, 2025-2035
  • Figure 83: Latin America Market Value (USD Million) Analysis by Function, 2020-2035
  • Figure 84: Latin America Market Volume (Units) Analysis by Function, 2020-2035
  • Figure 85: Latin America Market Value Share (%) and BPS Analysis by Function, 2025-2035
  • Figure 86: Latin America Market Y-o-Y Growth (%) Projections by Function, 2025-2035
  • Figure 87: Latin America Market Value (USD Million) Analysis by Product Type, 2020-2035
  • Figure 88: Latin America Market Volume (Units) Analysis by Product Type, 2020-2035
  • Figure 89: Latin America Market Value Share (%) and BPS Analysis by Product Type, 2025-2035
  • Figure 90: Latin America Market Y-o-Y Growth (%) Projections by Product Type, 2025-2035
  • Figure 91: Latin America Market Value (USD Million) Analysis by Active Ingredient, 2020-2035
  • Figure 92: Latin America Market Volume (Units) Analysis by Active Ingredient, 2020-2035
  • Figure 93: Latin America Market Value Share (%) and BPS Analysis by Active Ingredient, 2025-2035
  • Figure 94: Latin America Market Y-o-Y Growth (%) Projections by Active Ingredient, 2025-2035
  • Figure 95: Latin America Market Value (USD Million) Analysis by Channel, 2020-2035
  • Figure 96: Latin America Market Volume (Units) Analysis by Channel, 2020-2035
  • Figure 97: Latin America Market Value Share (%) and BPS Analysis by Channel, 2025-2035
  • Figure 98: Latin America Market Y-o-Y Growth (%) Projections by Channel, 2025-2035
  • Figure 99: Latin America Market Value (USD Million) Analysis by Claim, 2020-2035
  • Figure 100: Latin America Market Volume (Units) Analysis by Claim, 2020-2035
  • Figure 101: Latin America Market Value Share (%) and BPS Analysis by Claim, 2025-2035
  • Figure 102: Latin America Market Y-o-Y Growth (%) Projections by Claim, 2025-2035
  • Figure 103: Latin America Market Attractiveness by Function, 2025-2035
  • Figure 104: Latin America Market Attractiveness by Product Type, 2025-2035
  • Figure 105: Latin America Market Attractiveness by Active Ingredient, 2025-2035
  • Figure 106: Latin America Market Attractiveness by Channel, 2025-2035
  • Figure 107: Latin America Market Attractiveness by Claim, 2025-2035
  • Figure 108: Latin America Market Attractiveness by Country, 2025-2035
  • Figure 109: Europe Market Value (USD Million) by Function, 2025-2035
  • Figure 110: Europe Market Value (USD Million) by Product Type, 2025-2035
  • Figure 111: Europe Market Value (USD Million) by Active Ingredient, 2025-2035
  • Figure 112: Europe Market Value (USD Million) by Channel, 2025-2035
  • Figure 113: Europe Market Value (USD Million) by Claim, 2025-2035
  • Figure 114: Europe Market Value (USD Million) by Country, 2025-2035
  • Figure 115: Europe Market Value (USD Million) Analysis by Country, 2020-2035
  • Figure 116: Europe Market Volume (Units) Analysis by Country, 2020-2035
  • Figure 117: Europe Market Value Share (%) and BPS Analysis by Country, 2025-2035
  • Figure 118: Europe Market Y-o-Y Growth (%) Projections by Country, 2025-2035
  • Figure 119: Europe Market Value (USD Million) Analysis by Function, 2020-2035
  • Figure 120: Europe Market Volume (Units) Analysis by Function, 2020-2035
  • Figure 121: Europe Market Value Share (%) and BPS Analysis by Function, 2025-2035
  • Figure 122: Europe Market Y-o-Y Growth (%) Projections by Function, 2025-2035
  • Figure 123: Europe Market Value (USD Million) Analysis by Product Type, 2020-2035
  • Figure 124: Europe Market Volume (Units) Analysis by Product Type, 2020-2035
  • Figure 125: Europe Market Value Share (%) and BPS Analysis by Product Type, 2025-2035
  • Figure 126: Europe Market Y-o-Y Growth (%) Projections by Product Type, 2025-2035
  • Figure 127: Europe Market Value (USD Million) Analysis by Active Ingredient, 2020-2035
  • Figure 128: Europe Market Volume (Units) Analysis by Active Ingredient, 2020-2035
  • Figure 129: Europe Market Value Share (%) and BPS Analysis by Active Ingredient, 2025-2035
  • Figure 130: Europe Market Y-o-Y Growth (%) Projections by Active Ingredient, 2025-2035
  • Figure 131: Europe Market Value (USD Million) Analysis by Channel, 2020-2035
  • Figure 132: Europe Market Volume (Units) Analysis by Channel, 2020-2035
  • Figure 133: Europe Market Value Share (%) and BPS Analysis by Channel, 2025-2035
  • Figure 134: Europe Market Y-o-Y Growth (%) Projections by Channel, 2025-2035
  • Figure 135: Europe Market Value (USD Million) Analysis by Claim, 2020-2035
  • Figure 136: Europe Market Volume (Units) Analysis by Claim, 2020-2035
  • Figure 137: Europe Market Value Share (%) and BPS Analysis by Claim, 2025-2035
  • Figure 138: Europe Market Y-o-Y Growth (%) Projections by Claim, 2025-2035
  • Figure 139: Europe Market Attractiveness by Function, 2025-2035
  • Figure 140: Europe Market Attractiveness by Product Type, 2025-2035
  • Figure 141: Europe Market Attractiveness by Active Ingredient, 2025-2035
  • Figure 142: Europe Market Attractiveness by Channel, 2025-2035
  • Figure 143: Europe Market Attractiveness by Claim, 2025-2035
  • Figure 144: Europe Market Attractiveness by Country, 2025-2035
  • Figure 145: East Asia Market Value (USD Million) by Function, 2025-2035
  • Figure 146: East Asia Market Value (USD Million) by Product Type, 2025-2035
  • Figure 147: East Asia Market Value (USD Million) by Active Ingredient, 2025-2035
  • Figure 148: East Asia Market Value (USD Million) by Channel, 2025-2035
  • Figure 149: East Asia Market Value (USD Million) by Claim, 2025-2035
  • Figure 150: East Asia Market Value (USD Million) by Country, 2025-2035
  • Figure 151: East Asia Market Value (USD Million) Analysis by Country, 2020-2035
  • Figure 152: East Asia Market Volume (Units) Analysis by Country, 2020-2035
  • Figure 153: East Asia Market Value Share (%) and BPS Analysis by Country, 2025-2035
  • Figure 154: East Asia Market Y-o-Y Growth (%) Projections by Country, 2025-2035
  • Figure 155: East Asia Market Value (USD Million) Analysis by Function, 2020-2035
  • Figure 156: East Asia Market Volume (Units) Analysis by Function, 2020-2035
  • Figure 157: East Asia Market Value Share (%) and BPS Analysis by Function, 2025-2035
  • Figure 158: East Asia Market Y-o-Y Growth (%) Projections by Function, 2025-2035
  • Figure 159: East Asia Market Value (USD Million) Analysis by Product Type, 2020-2035
  • Figure 160: East Asia Market Volume (Units) Analysis by Product Type, 2020-2035
  • Figure 161: East Asia Market Value Share (%) and BPS Analysis by Product Type, 2025-2035
  • Figure 162: East Asia Market Y-o-Y Growth (%) Projections by Product Type, 2025-2035
  • Figure 163: East Asia Market Value (USD Million) Analysis by Active Ingredient, 2020-2035
  • Figure 164: East Asia Market Volume (Units) Analysis by Active Ingredient, 2020-2035
  • Figure 165: East Asia Market Value Share (%) and BPS Analysis by Active Ingredient, 2025-2035
  • Figure 166: East Asia Market Y-o-Y Growth (%) Projections by Active Ingredient, 2025-2035
  • Figure 167: East Asia Market Value (USD Million) Analysis by Channel, 2020-2035
  • Figure 168: East Asia Market Volume (Units) Analysis by Channel, 2020-2035
  • Figure 169: East Asia Market Value Share (%) and BPS Analysis by Channel, 2025-2035
  • Figure 170: East Asia Market Y-o-Y Growth (%) Projections by Channel, 2025-2035
  • Figure 171: East Asia Market Value (USD Million) Analysis by Claim, 2020-2035
  • Figure 172: East Asia Market Volume (Units) Analysis by Claim, 2020-2035
  • Figure 173: East Asia Market Value Share (%) and BPS Analysis by Claim, 2025-2035
  • Figure 174: East Asia Market Y-o-Y Growth (%) Projections by Claim, 2025-2035
  • Figure 175: East Asia Market Attractiveness by Function, 2025-2035
  • Figure 176: East Asia Market Attractiveness by Product Type, 2025-2035
  • Figure 177: East Asia Market Attractiveness by Active Ingredient, 2025-2035
  • Figure 178: East Asia Market Attractiveness by Channel, 2025-2035
  • Figure 179: East Asia Market Attractiveness by Claim, 2025-2035
  • Figure 180: East Asia Market Attractiveness by Country, 2025-2035
  • Figure 181: South Asia & Pacific Market Value (USD Million) by Function, 2025-2035
  • Figure 182: South Asia & Pacific Market Value (USD Million) by Product Type, 2025-2035
  • Figure 183: South Asia & Pacific Market Value (USD Million) by Active Ingredient, 2025-2035
  • Figure 184: South Asia & Pacific Market Value (USD Million) by Channel, 2025-2035
  • Figure 185: South Asia & Pacific Market Value (USD Million) by Claim, 2025-2035
  • Figure 186: South Asia & Pacific Market Value (USD Million) by Country, 2025-2035
  • Figure 187: South Asia & Pacific Market Value (USD Million) Analysis by Country, 2020-2035
  • Figure 188: South Asia & Pacific Market Volume (Units) Analysis by Country, 2020-2035
  • Figure 189: South Asia & Pacific Market Value Share (%) and BPS Analysis by Country, 2025-2035
  • Figure 190: South Asia & Pacific Market Y-o-Y Growth (%) Projections by Country, 2025-2035
  • Figure 191: South Asia & Pacific Market Value (USD Million) Analysis by Function, 2020-2035
  • Figure 192: South Asia & Pacific Market Volume (Units) Analysis by Function, 2020-2035
  • Figure 193: South Asia & Pacific Market Value Share (%) and BPS Analysis by Function, 2025-2035
  • Figure 194: South Asia & Pacific Market Y-o-Y Growth (%) Projections by Function, 2025-2035
  • Figure 195: South Asia & Pacific Market Value (USD Million) Analysis by Product Type, 2020-2035
  • Figure 196: South Asia & Pacific Market Volume (Units) Analysis by Product Type, 2020-2035
  • Figure 197: South Asia & Pacific Market Value Share (%) and BPS Analysis by Product Type, 2025-2035
  • Figure 198: South Asia & Pacific Market Y-o-Y Growth (%) Projections by Product Type, 2025-2035
  • Figure 199: South Asia & Pacific Market Value (USD Million) Analysis by Active Ingredient, 2020-2035
  • Figure 200: South Asia & Pacific Market Volume (Units) Analysis by Active Ingredient, 2020-2035
  • Figure 201: South Asia & Pacific Market Value Share (%) and BPS Analysis by Active Ingredient, 2025-2035
  • Figure 202: South Asia & Pacific Market Y-o-Y Growth (%) Projections by Active Ingredient, 2025-2035
  • Figure 203: South Asia & Pacific Market Value (USD Million) Analysis by Channel, 2020-2035
  • Figure 204: South Asia & Pacific Market Volume (Units) Analysis by Channel, 2020-2035
  • Figure 205: South Asia & Pacific Market Value Share (%) and BPS Analysis by Channel, 2025-2035
  • Figure 206: South Asia & Pacific Market Y-o-Y Growth (%) Projections by Channel, 2025-2035
  • Figure 207: South Asia & Pacific Market Value (USD Million) Analysis by Claim, 2020-2035
  • Figure 208: South Asia & Pacific Market Volume (Units) Analysis by Claim, 2020-2035
  • Figure 209: South Asia & Pacific Market Value Share (%) and BPS Analysis by Claim, 2025-2035
  • Figure 210: South Asia & Pacific Market Y-o-Y Growth (%) Projections by Claim, 2025-2035
  • Figure 211: South Asia & Pacific Market Attractiveness by Function, 2025-2035
  • Figure 212: South Asia & Pacific Market Attractiveness by Product Type, 2025-2035
  • Figure 213: South Asia & Pacific Market Attractiveness by Active Ingredient, 2025-2035
  • Figure 214: South Asia & Pacific Market Attractiveness by Channel, 2025-2035
  • Figure 215: South Asia & Pacific Market Attractiveness by Claim, 2025-2035
  • Figure 216: South Asia & Pacific Market Attractiveness by Country, 2025-2035
  • Figure 217: Middle East and Africa Market Value (USD Million) by Function, 2025-2035
  • Figure 218: Middle East and Africa Market Value (USD Million) by Product Type, 2025-2035
  • Figure 219: Middle East and Africa Market Value (USD Million) by Active Ingredient, 2025-2035
  • Figure 220: Middle East and Africa Market Value (USD Million) by Channel, 2025-2035
  • Figure 221: Middle East and Africa Market Value (USD Million) by Claim, 2025-2035
  • Figure 222: Middle East and Africa Market Value (USD Million) by Country, 2025-2035
  • Figure 223: Middle East and Africa Market Value (USD Million) Analysis by Country, 2020-2035
  • Figure 224: Middle East and Africa Market Volume (Units) Analysis by Country, 2020-2035
  • Figure 225: Middle East and Africa Market Value Share (%) and BPS Analysis by Country, 2025-2035
  • Figure 226: Middle East and Africa Market Y-o-Y Growth (%) Projections by Country, 2025-2035
  • Figure 227: Middle East and Africa Market Value (USD Million) Analysis by Function, 2020-2035
  • Figure 228: Middle East and Africa Market Volume (Units) Analysis by Function, 2020-2035
  • Figure 229: Middle East and Africa Market Value Share (%) and BPS Analysis by Function, 2025-2035
  • Figure 230: Middle East and Africa Market Y-o-Y Growth (%) Projections by Function, 2025-2035
  • Figure 231: Middle East and Africa Market Value (USD Million) Analysis by Product Type, 2020-2035
  • Figure 232: Middle East and Africa Market Volume (Units) Analysis by Product Type, 2020-2035
  • Figure 233: Middle East and Africa Market Value Share (%) and BPS Analysis by Product Type, 2025-2035
  • Figure 234: Middle East and Africa Market Y-o-Y Growth (%) Projections by Product Type, 2025-2035
  • Figure 235: Middle East and Africa Market Value (USD Million) Analysis by Active Ingredient, 2020-2035
  • Figure 236: Middle East and Africa Market Volume (Units) Analysis by Active Ingredient, 2020-2035
  • Figure 237: Middle East and Africa Market Value Share (%) and BPS Analysis by Active Ingredient, 2025-2035
  • Figure 238: Middle East and Africa Market Y-o-Y Growth (%) Projections by Active Ingredient, 2025-2035
  • Figure 239: Middle East and Africa Market Value (USD Million) Analysis by Channel, 2020-2035
  • Figure 240: Middle East and Africa Market Volume (Units) Analysis by Channel, 2020-2035
  • Figure 241: Middle East and Africa Market Value Share (%) and BPS Analysis by Channel, 2025-2035
  • Figure 242: Middle East and Africa Market Y-o-Y Growth (%) Projections by Channel, 2025-2035
  • Figure 243: Middle East and Africa Market Value (USD Million) Analysis by Claim, 2020-2035
  • Figure 244: Middle East and Africa Market Volume (Units) Analysis by Claim, 2020-2035
  • Figure 245: Middle East and Africa Market Value Share (%) and BPS Analysis by Claim, 2025-2035
  • Figure 246: Middle East and Africa Market Y-o-Y Growth (%) Projections by Claim, 2025-2035
  • Figure 247: Middle East and Africa Market Attractiveness by Function, 2025-2035
  • Figure 248: Middle East and Africa Market Attractiveness by Product Type, 2025-2035
  • Figure 249: Middle East and Africa Market Attractiveness by Active Ingredient, 2025-2035
  • Figure 250: Middle East and Africa Market Attractiveness by Channel, 2025-2035
  • Figure 251: Middle East and Africa Market Attractiveness by Claim, 2025-2035
  • Figure 252: Middle East and Africa Market Attractiveness by Country, 2025-2035
Dashboard
Dashboard
Dashboard
Dashboard
Dashboard
Dashboard

Our Research Products

Full Research Suite

The "Full Research Suite" delivers actionable market intel, deep dives on markets or technologies, so clients act faster, cut risk, and unlock growth.

Competitor Leaderboard Report

The Leaderboard benchmarks and ranks top vendors, classifying them as Established Leaders, Leading Challengers, or Disruptors & Challengers.

Future Leaders Index

Locates where complements amplify value and substitutes erode it, forecasting net impact by horizon

Market Data & Forecasts

We deliver granular, decision-grade intel: market sizing, 5-year forecasts, pricing, adoption, usage, revenue, and operational KPIs—plus competitor tracking, regulation, and value chains—across 60 countries broadly.

Market Focus Report

Spot the shifts before they hit your P&L. We track inflection points, adoption curves, pricing moves, and ecosystem plays to show where demand is heading, why it is changing, and what to do next across high-growth markets and disruptive tech

Survey Report

Real-time reads of user behavior. We track shifting priorities, perceptions of today’s and next-gen services, and provider experience, then pace how fast tech moves from trial to adoption, blending buyer, consumer, and channel inputs with social signals (#WhySwitch, #UX).

Bespoke Reports

Partner with our analyst team to build a custom report designed around your business priorities. From analysing market trends to assessing competitors or crafting bespoke datasets, we tailor insights to your needs.

Supplier Intelligence

Discovery & Profiling

Capacity & Footprint

Performance & Risk

Compliance & Governance

Commercial Readiness

Who Supplies Whom

Scorecards & Shortlists

Playbooks & Docs

Category Intelligence

Definition & Scope

Demand & Use Cases

Cost Drivers

Market Structure

Supply Chain Map

Trade & Policy

Operating Norms

Deliverables

Buyer Intelligence

Account Basics

Spend & Scope

Procurement Model

Vendor Requirements

Terms & Policies

Entry Strategy

Pain Points & Triggers

Outputs

Pricing Analysis

Benchmarks

Trends

Should-Cost

Indexation

Landed Cost

Commercial Terms

Deliverables

Brand Analysis

Positioning & Value Prop

Share & Presence

Customer Evidence

Go-to-Market

Digital & Reputation

Compliance & Trust

KPIs & Gaps

Outputs

Full Research Suite comprises of:

Market outlook & trends analysis

Market outlook & trends analysis

Interviews & case studies

Interviews & case studies

Strategic recommendations

Strategic recommendations

Vendor profiles & capabilities analysis

Vendor profiles & capabilities analysis

5-year forecasts

5-year forecasts

8 regions and 60+ country-level data splits

8 regions and 60+ country-level data splits

Market segment data splits

Market segment data splits

12 months of continuous data updates

12 months of continuous data updates

DELIVERED AS:

PDF EXCEL ONLINE

Full Research Suite


$2000

$3500

$5000

Buy Report Now
Similar Industry Reports

Similar Industry Reports

Skincare Supplement Market

Skincare Supplement Market Size and Share Forecast Outlook 2025 to 2035

Skincare Oil Market
Skincare Oil Market

Skincare Oil Market Size and Share Forecast Outlook 2025 to 2035

Skincare Nutritional Serum Market

Skincare Nutritional Serum Market Size and Share Forecast Outlook 2025 to 2035

Skincare Products Market

Skincare Products Market Size and Share Forecast Outlook 2025 to 2035

Skincare Market
Skincare Market

Skincare Market Analysis - Size, Share, and Forecast Outlook 2025 to 2035

Skincare Packaging Market

Skincare Packaging Market Size, Share & Forecast 2025 to 2035

Skincare Industry Analysis in India

Skincare Industry in India – Trends & Growth Forecast 2024-2034

Skincare Treatment Market

Global Skincare Treatment Market Analysis – Size, Share & Forecast 2024-2034

PDRN Skincare Market

Global PDRN Skincare Market Size and Share Forecast Outlook 2025 to 2035

Men’s Skincare Products Market

Men’s Skincare Products Market Size, Growth, and Forecast for 2025 to 2035

Smart Skincare Market

Global Smart Skincare Market Size and Share Forecast Outlook 2025 to 2035

Cooling Skincare Gels Market

Cooling Skincare Gels Market Size and Share Forecast Outlook 2025 to 2035

Natural Skincare Preservatives Market

Natural Skincare Preservatives Market Analysis - Size and Share Forecast Outlook 2025 to 2035

Ormedic Skincare Market

Ormedic Skincare Market Demand & Insights 2024-2034

Ceramide Skincare Market

Ceramide Skincare Market Size and Share Forecast Outlook 2025 to 2035

BPA-free Skincare Market

BPA-Free Skincare Market Trends – Demand & Forecast 2024-2034

Camellia Skincare & Cosmetics Market

Camellia Skincare & Cosmetics Market

Buffering Skincare Products Market

Buffering Skincare Products Market Analysis - Size and Share Forecast Outlook 2025 to 2035

Menopause Skincare Solutions Market

Menopause Skincare Solutions Market Size and Share Forecast Outlook 2025 to 2035

Probiotic Skincare Ingredients Market

Probiotic Skincare Ingredients Market Size and Share Forecast Outlook 2025 to 2035

Future Market Insights

Rosacea-Targeting Skincare Market

Chat With MaRIA

Chat With

MaRIA

Hi There, I am MaRIA, Your Market Research Intelligence Assistant. How may I help you?