

- Market Size (2026)
- USD 720.6 Mn
- Forecast (2036)
- USD 1938.1 Mn
- CAGR (2026 to 2036)
- 10.4%
How big is the Sensorized Linkage Assemblies Market in 2026?
USD 720.6 million in 2026 and USD 1,938.1 million by 2036 at a 10.4% CAGR.
Vehicle control programs are shifting mechanical linkages into signal-bearing assemblies for chassis control and steering. The shift is driven by software-defined vehicle programs that need reliable movement feedback near harsh mechanical joints. IEA reported in May 2026 that electric car sales exceeded 20 million in 2025. That scale matters for EV and hybrid platforms that place more electronic control inside compact vehicle architectures. Sensorized linkage assemblies gain relevance, reinforced by related automotive sensors adoption that moves feedback closer to control points.
Vehicle OEMs and Tier-1 suppliers prefer sensorized linkage assemblies when a mechanical movement also needs position feedback. The clearest use case is chassis and suspension control where a linkage can carry both motion transfer and sensing responsibility. ZF said in July 2025 that its Smart Chassis Sensor measures wheel height and captures acceleration in three dimensions. That type of integration helps steering and shifter programs while also supporting pedal and suspension programs. Procurement teams then focus on sealing proof, connector design and validation access before awarding platform work.
Regional adoption is rising as vehicle programs are being launched and localized. For instance, OICA reported in April 2026 that global vehicle production reached 96.4 million units in 2025. That production base gives sensorized linkage suppliers more platform opportunities across passenger cars and light commercial vehicles. North America and Europe place more weight on validation records and field history. China and India place more weight on local assembly and faster platform cycles. Buyers favor suppliers that can support mechanical fit and signal reliability through the full platform life.
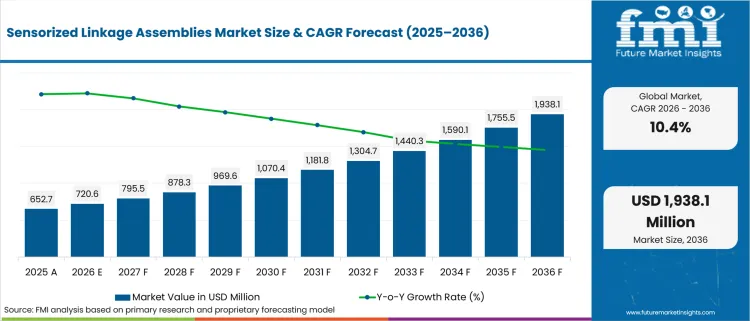
| Metric | Value |
|---|---|
| 2025 Market Size | USD 652.7 million |
| 2026 Market Size | USD 720.6 million |
| 2036 Market Size | USD 1,938.1 million |
| Forecast CAGR (2026-2036) | 10.4% |
| Linkage Type Focus | Suspension Linkage Assemblies |
| Suspension Linkage Assemblies Share (2026) | 36.5% |
| Sensor Type Focus | Position Sensors |
| Position Sensors Share (2026) | 46.0% |
| Vehicle Type Focus | Passenger Cars |
| Passenger Cars Share (2026) | 58.0% |
| Fastest-growing Country | China |
| China CAGR by 2036 | 11.8% |
Summary of the Sensorized Linkage Assemblies Market
| Market Signal | Commercial Impact |
|---|---|
| Demand and Growth Drivers | Demand for sensorized linkage assemblies is increasing as OEMs integrate closed-loop motion feedback into chassis, steering, and safety systems to improve vehicle control and software-driven functionality.
|
| Product and Segment View | Suspension linkage assemblies, position sensors, and OEM sales channels lead their respective market segments as manufacturers prioritize validated motion sensing and factory-level integration.
|
| Geography and Growth Outlook | Asia continues to lead sensorized linkage assembly demand while the United States maintains strong growth through advanced vehicle validation and electrification programs.
|
| Competitive Landscape | Competition increasingly focuses on sensing capability, automotive validation, connector reliability, and system-level chassis integration.
|
| Analyst Perspective | Sensorized linkage assemblies are evolving into critical feedback components that support software-defined vehicles, advanced chassis control, and intelligent actuation systems.
- Nikhil Kaitwade, Principal Consultant at Future Market Insights |
How is the sensorized linkage assemblies market segmented?
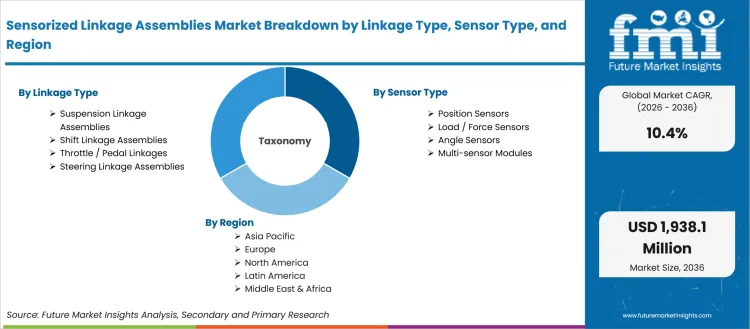
The Sensorized Linkage Assemblies industry is segmented by linkage type, sensor type, vehicle type, application, sales channel, and region.
The Sensorized Linkage Assemblies Market is segmented by linkage type, sensor type, vehicle type, application, sales channel, and region. Linkage type covers shift linkage assemblies, suspension linkage assemblies, throttle or pedal linkages and steering linkage assemblies. Sensor type includes position sensors, load or force sensors, angle sensors and multi-sensor modules. Vehicle type spans passenger cars, EVs or hybrids, commercial vehicles and off-highway vehicles. Application covers chassis control, transmission or shifter, steering and pedal or actuation uses. Sales channel includes OEM and tier supplier integrated routes. Regional coverage extends across North America, Latin America, Europe, East Asia, South Asia and Pacific, and Middle East and Africa.
Why do Suspension Linkage Assemblies matter within linkage type?
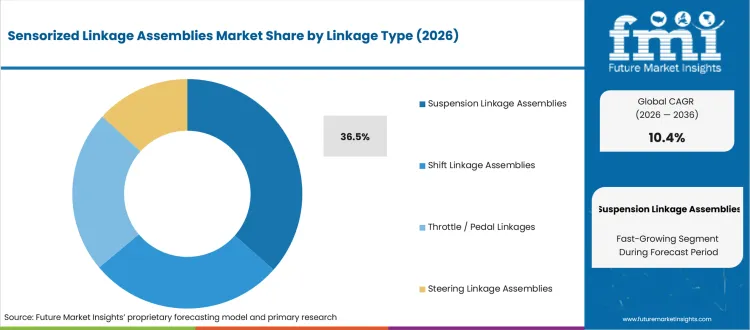
Chassis buyers need movement feedback near suspension joints before ride-control software can react cleanly. The operating issue is not only metal geometry. It is the ability to keep a signal stable under road splash, vibration and repeated travel. Suspension linkage assemblies are relevant for programs that need wheel-path feedback close to the moving part.
- In 2026, Suspension Linkage Assemblies are anticipated to hold 36.5% of linkage type demand, driven by active ride and height-control programs. ZF delivered electronically controlled air suspension OptiRide to Hyundai in June 2025. The project supports demand for components that combine chassis movement and electronic control readiness.
- Program buyers in this segment gain a clearer qualification path when the supplier proves sealing and vibration stability. Related air suspension systems also show why chassis data must stay reliable under load changes and road conditions. That operating need favors assemblies designed around sensor packaging from the start.
What supports demand for Position Sensors?
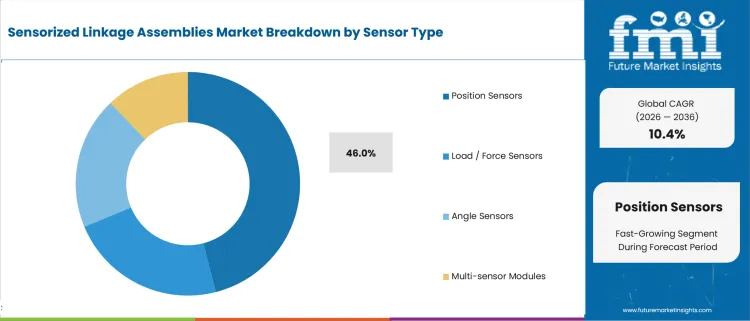
Vehicle programs need simple travel feedback before they justify more complex sensor stacks. Position sensors fit that need in shifter, pedal and linkage points where the control unit needs a repeatable signal. The buying logic is tied to adequate accuracy, lower cost and easier validation inside high-volume platforms.
- Position Sensors represent 46.0% of sensor type demand in 2026, supported by direct feedback needs across shifter and pedal assemblies. The test and measurement sensors category reflects the same buyer emphasis on repeatability and calibration evidence across high-volume programs.
- The executive case for position sensors is cost control plus acceptable signal certainty. OEMs can verify linkage movement without adding a complex sensor module. That makes position feedback suitable for platforms that need a reliable control signal but still face component-cost limits.
How are Passenger Cars positioned within vehicle type?
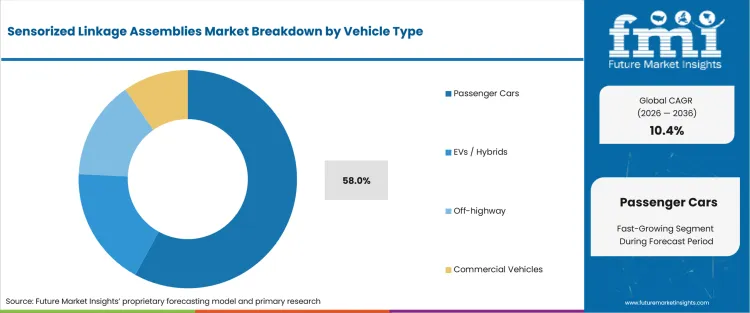
Passenger car platforms carry the scale that makes embedded sensing easier to justify. Shared architectures spread the cost of connectors, sealing work and calibration checks across many model variants. This makes passenger cars a practical fit for sensorized linkages used in shifter, pedal, steering and chassis applications.
- Passenger Cars are estimated to account for 58.0% share in 2026, attributable to platform scale and faster migration of electronic control functions. ACEA reported in February 2026 that battery-electric cars held 19.3% of EU registrations in January 2026. That shift supports more compact sensor content in passenger programs.
- Passenger-car buyers need sensorized linkages that fit tight packaging and keep wiring simple across shared platforms. The automotive steering system category adds related demand due to steering and chassis functions that need consistent feedback once more control logic moves into passenger vehicle software.
What market factors influence Chassis Control applications?
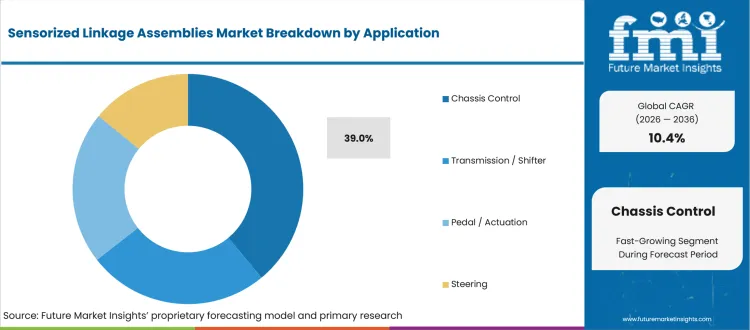
Chassis control programs depend on local movement data from components that operate near road load and vibration. The buyer issue is signal confidence during repeated travel. A linkage assembly that reports movement at the joint can help suspension and stability software act on cleaner inputs.
- Chassis Control is set to hold 39.0% of application demand in 2026, led by suspension and stability programs that use local linkage feedback. ZF announced in July 2025 that its next-generation chassis sensor could capture wheel-height and acceleration data. That development supports component-level sensing near chassis motion.
- System engineers using chassis-control linkages can reduce handoffs between mechanical design and sensing teams. Related automotive actuator programs show the same movement toward qualified control interfaces. This makes assembly-level validation more valuable than separate sourcing of linkages and sensors.
How is OEM positioned within the sales-channel category?
OEM sourcing matters due to calibration, software compatibility and warranty risk before vehicle launch. The commercial issue is accountability. Buyers want a qualified assembly that can be validated inside the platform program instead of adjusted later at the component level.
- OEM is projected to hold 71.0% share in 2026, attributable to calibration approval during vehicle development. NHTSA’s 2024 automatic emergency braking rule reinforces the need for validated feedback paths in safety-adjacent architectures. That favors suppliers accepted early in platform engineering.
- Tier supplier integrated routes remain useful for larger steering and chassis modules. A validated steering position sensor interface can support those programs once linkage feedback is bundled into a broader motion-control package. This route suits buyers that want fewer interfaces to manage during launch.
What are the drivers, restraints, and opportunities in the sensorized linkage assemblies market?
Near-term purchases are being shaped by the motion-feedback requirement, validation constraint, and system-integration route outlined below.
- Driver: Closed-loop chassis and actuation programs are supported by OEM demand for signal-ready linkage assemblies that report local movement accurately.
- Restraint: Validation cost is shaped by heat, vibration, salt-spray and sensor-drift testing that slows supplier switching.
- Opportunity: Tier-integrated modules gain traction from buyers that want linkage geometry, sensing, connectors and calibration support in one package.
Platform teams are treating movement feedback inside chassis and actuation control instead of a late component option. OICA reported in April 2026 that global vehicle sales reached 99.8 million units in 2025. That scale makes supplier awards more valuable for assemblies that can serve repeated platforms. A bare linkage competes on geometry and cost. A sensorized assembly competes on signal quality, sealing, calibration history and launch support. Suppliers that document these attributes can defend program access in chassis, steering and pedal applications.
Validation burden creates a restraint for smaller mechanical suppliers, yet it also creates a route for qualified integrators. NHTSA projected in April 2024 that FMVSS No. 127 would prevent at least 24,000 injuries each year. That safety context raises scrutiny around sensors and control inputs used near safety-adjacent functions. Buyers therefore look for suppliers that combine mechanical design and electronics support inside one accountable package. The constraint becomes a market opening for companies that reduce engineering handoffs and warranty risk.
Supplier opportunity is widening for companies that can join sensing and rugged connectivity inside the same assembly strategy. Amphenol reported in October 2025 that third-quarter sales reached USD 6.2 billion and that it acquired Rochester Sensors in August. The acquisition is relevant to linkage assemblies that need sensor packages built for harsh-duty electrical and mechanical environments. Startups and specialized suppliers can still compete by offering validated modules that reduce qualification burden for tier partners. This opens a practical route for niche engineering teams that can prove durability before scale.
Which country CAGRs are profiled in the sensorized linkage assemblies market?
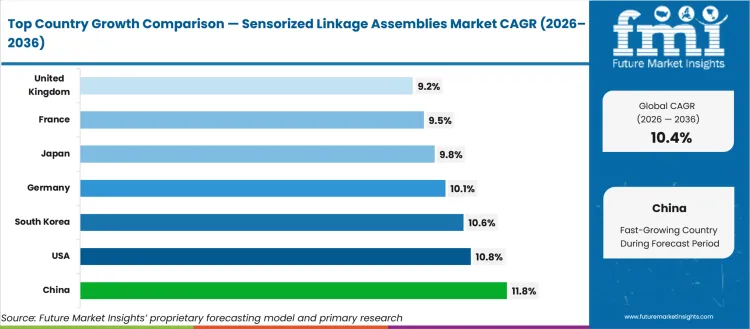
| Country | CAGR |
|---|---|
| United States | 10.8% |
| United Kingdom | 9.2% |
| Germany | 10.1% |
| France | 9.5% |
| Japan | 9.8% |
| China | 11.8% |
| South Korea | 10.6% |
| India | 11.2% |
How do country-level CAGRs compare in the sensorized linkage assemblies market?
Country CAGR comparison should be read against two different buying routes. In North America, Western Europe and Japan, adoption is tied to validation evidence, functional-safety review and field history inside established vehicle programs. South Korea follows an electronics-led path, supported by suppliers that already serve EV component programs. China and India place sensorized linkages closer to launch speed, localized assembly and electrified-platform scale. The practical purchasing issue is therefore not only growth rate. Buyers need suppliers that can offer documented durability in validation-heavy markets and cost-ready integration in markets shaped by faster platform cycling, cost pressure and local sourcing pressure.
- By 2036, the United States is projected to record 10.8% CAGR, reinforced by validation-heavy OEM programs and safety-linked control architectures. EPA reported in February 2026 that model year 2024 new vehicles reached 27.2 mpg. That regulatory and engineering context keeps sensor reliability important for suppliers competing on platform access.
- The United Kingdom is expected to grow at 9.2% CAGR during the forecast period, supported by electrification and fleet-renewal activity. Department for Transport data released in April 2026 showed 2,012,000 zero-emission vehicles licensed at the end of 2025. This supports demand for compact feedback assemblies in evolving vehicle platforms.
- Over the assessment period, Germany is forecast to advance at 10.1% CAGR, shaped by premium vehicle engineering and electrified chassis programs. BMWK reported in January 2026 that domestic EV market share reached a record 63% in 2025. That mix supports buyers that need validated sensing and actuator interfaces.
- Demand in France is forecast to advance at 9.5% CAGR by 2036, influenced by regulated vehicle programs and European electrification pressure. ACEA reported in February 2026 that French battery-electric registrations increased 52.1% in January 2026. The growth profile supports demand for compact components that help control software read movement reliably.
- Japan is likely to expand at 9.8% CAGR by 2036, driven by precision manufacturing and supplier discipline around vehicle electronics. JAMA reported in September 2025 that Japan produced 8.23 million motor vehicles in 2024. That production base supports sensorized linkage programs where repeatability and launch quality are central buyer concerns.
- China is estimated to rise at 11.8% CAGR between 2026 and 2036, propelled by NEV scale and faster platform cycles. IEA projected in May 2026 that electric cars would approach 60% of new car sales in China during 2026. This makes local feedback assemblies relevant across high-volume electrified architectures.
- Demand in South Korea is projected to grow at 10.6% CAGR by 2036, supported by EV production and electronics-led vehicle programs. The USA International Trade Administration reported in July 2025 that Korea produced 407,009 EVs in 2025. That output supports sensor and linkage suppliers tied to electrified platforms.
- India is expected to grow at 11.2% CAGR during the forecast period, attributable to local vehicle output and cost-focused sourcing. SIAM reported in April 2025 that total vehicle production reached 31,034,174 units during fiscal 2024 to 2025. That scale supports localized sensorized linkage assembly for passenger and commercial vehicle programs.
Who are the notable companies in the sensorized linkage assemblies market?
Bosch, ZF, Continental, TE Connectivity, Sensata Technologies, Denso, Nexteer Automotive, FORVIA HELLA, Amphenol and Methode Electronics are the notable companies shaping this market.
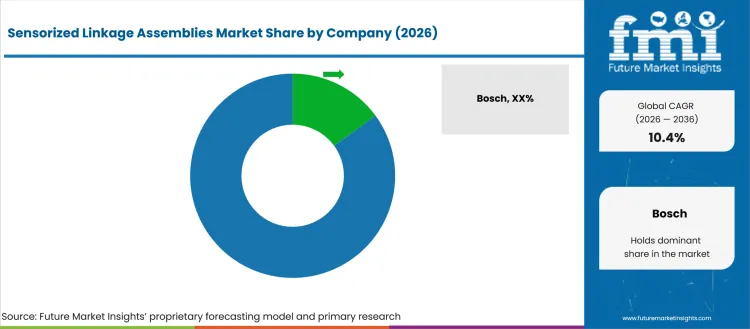
Supplier competition is organized by the layer of vehicle control that the buyer wants to solve. Bosch, ZF, Continental and Denso are more relevant for chassis and motion-control systems. TE Connectivity, Sensata Technologies and Amphenol become important once sensor interfaces and connectors decide qualification risk. Nexteer Automotive gains relevance for steering and motion-by-wire programs. FORVIA HELLA and Methode Electronics matter for angle sensing, interface design and application-specific packaging. The supplier-selection question is practical: should the buyer solve the feedback problem at system level, sensor level or custom assembly level.
- Bosch, ZF, Continental and Denso are relevant for buyers that need chassis and motion-control system depth. Their role is practical due to platform engineering access and experience across steering, suspension and vehicle electronics programs.
- Sensor and connector buyers often look to TE Connectivity, Sensata Technologies and Amphenol for qualified interfaces. Their relevance is supported by automotive-grade component portfolios that help underbody assemblies manage signal, power and packaging risk.
- Nexteer Automotive gains preference in steering-led programs owing to its work in steer-by-wire and motion-control systems. Buyers value this fit once linkage feedback must connect cleanly to electronic steering and safety-adjacent control paths.
- FORVIA HELLA and Methode Electronics are useful for programs that need angle sensing or application-specific interface design. Their role is suited to pedal, steering and off-highway requirements where custom geometry and reliable signal output carry equal weight.
Competitive Benchmarking: Sensorized Linkage Assemblies Market
| Company | Linkage-Sensor Integration | Chassis Motion Interface Depth | Automotive Validation Coverage | Geographic Footprint |
|---|---|---|---|---|
| Bosch | High | Strong | Strong | Global |
| ZF | High | Strong | Strong | Global |
| Continental | Medium | Strong | Strong | Global |
| Denso | Medium | Medium | Strong | Global |
| TE Connectivity | Strong | Medium | Strong | Global |
| Sensata Technologies | Strong | Medium | Strong | Global |
| Nexteer Automotive | Medium | Strong | Strong | Global |
| FORVIA HELLA | Medium | Medium | Strong | Global |
| Amphenol | Strong | Medium | Medium | Global |
| Methode Electronics | Medium | Medium | Medium | Regional |
Source: Future Market Insights competitive analysis, 2026. Ratings reflect relative portfolio relevance, workflow or project fit, service capability, and geographic reach.
Key Developments in the Sensorized Linkage Assemblies Market
- In April 2026, Nexteer Automotive started series production of its first steer-by-wire system for a Chinese OEM. The development matters for electronically controlled steering programs that need verified movement feedback and validated actuator interfaces. The market implication is wider demand for safety-adjacent motion-control components.
- In July 2025, ZF unveiled the next generation of its chassis sensor for wheel-height and acceleration measurement. The development reflects a move toward components that combine movement data and signal quality. Sensorized linkage suppliers can use this direction to position assembly-level feedback for chassis software readiness.
- In March 2025, FORVIA HELLA introduced its Universal Angular Sensor using CIPOS technology at bauma. The launch matters to linkage assemblies due to angle-sensing needs in steering, pedal and off-highway systems. The market implication is stronger interest in compact sensor packages that convert mechanical movement into usable control signals.
- In October 2025, TE Connectivity launched an inside-device connectivity portfolio for automotive ECUs. The development is relevant for sensorized linkages that need reliable connections between harsh-duty assemblies and vehicle control units. It points to supplier demand for compact interfaces that support software-defined vehicle architectures.
Key Players in the Sensorized Linkage Assemblies Market
Vehicle Motion and Chassis Systems
- Bosch
- ZF
- Continental
- Denso
- Nexteer Automotive
Sensor and Connectivity Specialists
- TE Connectivity
- Sensata Technologies
- Amphenol
- FORVIA HELLA
Specialized Linkage and Interface Suppliers
- Methode Electronics
- Kongsberg Automotive
- Mando
Sensorized Linkage Assemblies Market - Report Scope
| Coverage field | Report scope |
|---|---|
| Market breakdown | Sensorized Linkage Assemblies Market Breakdown By Linkage Type, Sensor Type, Vehicle Type, Application, Sales Channel, and Region |
| Market Definition | Mechanical linkage assemblies that integrate position, angle, load or force sensing for vehicle control and actuation systems |
| Regions Covered | North America, Latin America, Europe, East Asia, South Asia and Pacific, Middle East and Africa |
| Countries Covered | United States, United Kingdom, Germany, France, Japan, China, South Korea, India and 30+ countries |
| Key Companies Profiled | Bosch, ZF, Continental, TE Connectivity, Sensata Technologies, Denso, Nexteer Automotive, FORVIA HELLA, Amphenol, Methode Electronics |
| Forecast Period | 2026 to 2036 |
| Approach | Hybrid bottom-up and top-down methodology using vehicle platform volumes, sensor fitment rates, application mix, supplier validation depth and country-level automotive signals |
Sensorized Linkage Assemblies Market - Research Methodology
| Method | Approach |
|---|---|
| Primary Research | FMI analysts reviewed inputs from automotive component buyers, tier suppliers, sensor engineers, steering specialists and chassis sourcing teams. Interviews focused on platform awards, validation needs, sensor durability, packaging limits and integration responsibility. |
| Desk Research | Desk research covered vehicle safety rules, EV sales indicators, automotive production data, association statistics, standards references and official company releases. Product relevance was checked against chassis sensors, position sensors, steering interfaces and suspension control technologies. |
| Market Sizing and Forecasting | The model combined vehicle production volume, expected sensor fitment, average assembly pricing, application mix and country-level platform activity. Forecast assumptions were adjusted for EV penetration, active chassis content, OEM sourcing routes and tier-integrated module activity. |
| Data Validation | Forecasts were checked against automotive electronics portfolios, chassis system developments, by-wire steering launches and country vehicle production trends. Duplicate external statistics were avoided by assigning each evidence point to only one article section. |
Sensorized Linkage Assemblies Market by Segments
Sensorized Linkage Assemblies Market segmented by Linkage Type:
- Shift Linkage Assemblies
- Suspension Linkage Assemblies
- Throttle / Pedal Linkages
- Steering Linkage Assemblies
Sensorized Linkage Assemblies Market segmented by Sensor Type:
- Position Sensors
- Load / Force Sensors
- Angle Sensors
- Multi-sensor Modules
Sensorized Linkage Assemblies Market segmented by Vehicle Type:
- Passenger Cars
- EVs / Hybrids
- Commercial Vehicles
- Off-highway
Sensorized Linkage Assemblies Market segmented by Application:
- Chassis Control
- Transmission / Shifter
- Steering
- Pedal / Actuation
Sensorized Linkage Assemblies Market segmented by Sales Channel:
- OEM
- Tier Supplier Integrated
Sensorized Linkage Assemblies Market by Region:
- North America
- United States
- Canada
- Europe
- Germany
- United Kingdom
- France
- Italy
- Spain
- Asia Pacific
- China
- Japan
- South Korea
- Taiwan
- Singapore
- Latin America
- Brazil
- Mexico
- Argentina
- Middle East & Africa
- GCC Countries
- South Africa
- Israel
Research Sources and Bibliography
- International Energy Agency. (2026, May). Trends in electric cars - Global EV Outlook 2026. International Energy Agency. https://www.iea.org/reports/global-ev-outlook-2026/trends-in-electric-cars
- International Organization of Motor Vehicle Manufacturers. (2026, April 23). Auto industry growth shifted east in 2025 amid global repositioning. OICA. https://oica.net/auto-industry-growth-shifted-east-in-2025-amid-global-repositioning/
- National Highway Traffic Safety Administration. (2024, April 29). NHTSA finalizes key safety rule to reduce crashes and save lives. USA Department of Transportation. https://www.nhtsa.gov/press-releases/nhtsa-fmvss-127-automatic-emergency-braking-reduce-crashes
- USA Environmental Protection Agency. (2026, February 19). Highlights of the Automotive Trends Report. EPA. https://www.epa.gov/automotive-trends/highlights-automotive-trends-report
- Society of Indian Automobile Manufacturers. (2025, April 15). Auto Industry Sales Performance of March 2025, Q4 and April 2024 - March 2025. SIAM. https://www.siam.in/pressrelease-details.aspx?mpgid=48&pgidtrail=50&pid=579
- Department for Transport and Driver and Vehicle Licensing Agency. (2026, April 29). Vehicle licensing statistics, United Kingdom: 2025. GOV.UK. https://www.gov.uk/government/collections/vehicles-statistics
- Federal Ministry for Economic Affairs and Energy. (2026, January 27). Great prospects for electric mobility. BMWK. https://energiewende.bundeswirtschaftsministerium.de/EWD/Redaktion/EN/Newsletter/2026/01/Meldung/direkt-finds.html
- European Automobile Manufacturers Association. (2026, February 24). New car registrations: -3.9% in January 2026; battery-electric 19.3% market share. ACEA. https://www.acea.auto/files/Press_release_car_registrations_January_2026.pdf
- Japan Automobile Manufacturers Association. (2025, September 26). The motor industry of Japan 2025. JAMA. https://www.jama.or.jp/english/reports/docs/MIoJ2025_e.pdf
- USA International Trade Administration. (2025, July 21). South Korea Electric Vehicles EV Market. International Trade Administration. https://www.trade.gov/market-intelligence/south-korea-electric-vehicles-ev-market
- ZF Group. (2025, June 5). ZF delivers electronically controlled air suspension OptiRide to bus manufacturer Hyundai. ZF Press. https://press.zf.com/press/en/releases/release_87360.html
- ZF Group. (2025, July 10). World Market Leader in Car Chassis Technology. ZF Press. https://press.zf.com/press/en/releases/release_89536.html
- ZF Group. (2025, July 21). Next-Gen Smart Chassis Sensor: More data, more intelligence for the chassis system. ZF Press. https://press.zf.com/press/media/en/press_media/2025/01_global_en_and_de_2/releases_12/2025_07_21_zf_scsaplus/tx2025-07-21_PI_ZF_SCSplus_EN.pdf
- TE Connectivity. (2025, October 2). TE Connectivity launches new product portfolio for automotive ECUs to accelerate SDV and E/E architectural transformation. TE Connectivity. https://www.te.com/en/about-te/news-center/indeco-press-release.html
- Nexteer Automotive. (2026, April 28). Nexteer puts steer-by-wire into series production. Nexteer Automotive. https://www.nexteer.com/release/nexteer-puts-steer-by-wire-into-series-production/
- FORVIA HELLA. (2025, March 12). Precision and versatility: FORVIA HELLA introduces universal angular sensor with CIPOS technology. FORVIA HELLA. https://www.hella.com/en/Newsroom/Press-Releases/2025-03-12-FORVIA-HELLA-presents-the-new-Universal-Angular-Sensor-5386/
- Amphenol Corporation. (2025, October 22). Amphenol Reports Record Third Quarter 2025 Results and Announces Dividend Increase. Amphenol. https://investors.amphenol.com/news-and-events/news-details/2025/Amphenol-Reports-Record-Third-Quarter-2025-Results-and-Announces-Dividend-Increase/default.aspx
This bibliography is provided for reader reference and uses primary government, standards-body, official trade body, and company sources.
This Report Answers
- What is the expected global value of the Sensorized Linkage Assemblies Market in 2026 and 2036?
- What CAGR is forecast for sensorized linkage assemblies during the 2026 to 2036 period?
- Which linkage type category has a notable share position in 2026?
- Which sensor type is relevant for high-volume linkage feedback applications?
- What buyer factors support demand for signal-ready linkage assemblies?
- How do country-level CAGRs compare across the selected markets?
- Which companies compete across chassis systems, sensors, connectors and motion-control interfaces?
- What capabilities are included within the sensorized linkage assemblies definition?
- How does FMI size and forecast demand across segments and countries?
- What implementation and supplier-selection factors should executives assess?
Frequently Asked Questions
What is driving growth in the Sensorized Linkage Assemblies Market?
Growth is driven by closed-loop chassis control needs, EV packaging pressure and OEM demand for validated motion feedback near moving vehicle joints.
Why should executives track the Sensorized Linkage Assemblies Market?
Executives should track this market because sensorized linkages are becoming critical for software controlled vehicles that depend on accurate motion feedback at mechanical joints.
What business problem does the Sensorized Linkage Assemblies Market address?
It provides reliable position feedback directly at moving linkage points to support closed loop chassis steering and actuation control.
What should procurement leaders evaluate before selecting suppliers?
Procurement leaders should evaluate sealing durability sensor accuracy connector robustness validation history and platform integration readiness.
What can limit return on investment for buyers?
Return on investment can be limited by high validation cost sensor drift under heat and vibration and poor long term durability.
How can suppliers build executive confidence?
Suppliers build confidence by demonstrating stable signal output proven environmental resistance consistent manufacturing quality and strong OEM validation support.
Preview the report firsthand - request a free sample
Get SampleGet the brochure for pricing and purchase details.
Get PDFTable of Content
- Key Takeaways
- Market Size and CAGR
- Top Growth Driver
- Fastest Growing Segment
- Leading Region
- Key Companies
- Emerging Opportunities
- Executive Summary
- Global Market Outlook
- Demand-side Trends
- Supply-side Trends
- Technology Roadmap Analysis
- Analysis and Recommendations
- Analyst Perspective (What is happening? Why now? What should investors know?)
- Key Questions Answered
- How large is the market?
- What is the CAGR?
- What are key trends?
- Which region dominates?
- Who are the leaders?
- Market Overview
- Market Coverage / Taxonomy
- Market Definition / Scope / Limitations
- Research Methodology
- Chapter Orientation
- Analytical Lens and Working Hypotheses
- Market Structure, Signals, and Trend Drivers
- Benchmarking and Cross-market Comparability
- Market Sizing, Forecasting, and Opportunity Mapping
- Research Design and Evidence Framework
- Desk Research Programme (Secondary Evidence)
- Expert Input and Fieldwork (Primary Evidence)
- Tooling, Models, and Reference Databases
- Data Engineering and Model Build
- Quality Assurance and Audit Trail
- Market Background
- Market Dynamics (Drivers, Restraints, Opportunity, Trends)
- Scenario Forecast (Optimistic, Likely, Conservative)
- Impact Analysis
- AI Impact
- Sustainability Impact
- Regulatory Impact
- Technology Impact
- Consumer / Buyer Analysis
- Purchase Drivers
- Adoption Barriers
- Buyer Journey
- Opportunity Map Analysis
- Product Life Cycle Analysis
- Supply Chain Analysis
- Investment Feasibility Matrix
- Value Chain Analysis
- PESTLE and Porter's Analysis
- Regulatory Landscape
- Regional Parent Market Outlook
- Production and Consumption Statistics
- Import and Export Statistics
- Global Market Analysis and Forecast, 2021 to 2036
- Historical Market Size Value (USD Million) & Volume (Unit) Analysis, 2021 to 2025
- Current and Future Market Size Value (USD Million) & Volume (Unit) Projections, 2026 to 2036
- Y-o-Y Growth Trend Analysis
- Absolute $ Opportunity Analysis
- Global Market Pricing Analysis, 2021 to 2036
- Global Market Analysis and Forecast, By Linkage Type, 2021 to 2036
- Introduction / Key Findings
- Historical Market Size Value (USD Million) & Volume (Unit) Analysis By Linkage Type, 2021 to 2025
- Current and Future Market Size Value (USD Million) & Volume (Unit) Analysis and Forecast By Linkage Type, 2026 to 2036
- Suspension Linkage Assemblies
- Shift Linkage Assemblies
- Throttle / Pedal Linkages
- Steering Linkage Assemblies
- Suspension Linkage Assemblies
- Y-o-Y Growth Trend Analysis By Linkage Type, 2021 to 2025
- Absolute $ Opportunity Analysis By Linkage Type, 2026 to 2036
- Global Market Analysis and Forecast, By Sensor Type, 2021 to 2036
- Introduction / Key Findings
- Historical Market Size Value (USD Million) & Volume (Unit) Analysis By Sensor Type, 2021 to 2025
- Current and Future Market Size Value (USD Million) & Volume (Unit) Analysis and Forecast By Sensor Type, 2026 to 2036
- Position Sensors
- Load / Force Sensors
- Angle Sensors
- Multi-sensor Modules
- Position Sensors
- Y-o-Y Growth Trend Analysis By Sensor Type, 2021 to 2025
- Absolute $ Opportunity Analysis By Sensor Type, 2026 to 2036
- Global Market Analysis and Forecast, By Vehicle Type, 2021 to 2036
- Introduction / Key Findings
- Historical Market Size Value (USD Million) & Volume (Unit) Analysis By Vehicle Type, 2021 to 2025
- Current and Future Market Size Value (USD Million) & Volume (Unit) Analysis and Forecast By Vehicle Type, 2026 to 2036
- Passenger Cars
- EVs / Hybrids
- Off-highway
- Commercial Vehicles
- Passenger Cars
- Y-o-Y Growth Trend Analysis By Vehicle Type, 2021 to 2025
- Absolute $ Opportunity Analysis By Vehicle Type, 2026 to 2036
- Global Market Analysis and Forecast, By Application, 2021 to 2036
- Introduction / Key Findings
- Historical Market Size Value (USD Million) & Volume (Unit) Analysis By Application, 2021 to 2025
- Current and Future Market Size Value (USD Million) & Volume (Unit) Analysis and Forecast By Application, 2026 to 2036
- Chassis Control
- Transmission / Shifter
- Pedal / Actuation
- Steering
- Chassis Control
- Y-o-Y Growth Trend Analysis By Application, 2021 to 2025
- Absolute $ Opportunity Analysis By Application, 2026 to 2036
- Global Market Analysis and Forecast, By Sales Channel, 2021 to 2036
- Introduction / Key Findings
- Historical Market Size Value (USD Million) & Volume (Unit) Analysis By Sales Channel, 2021 to 2025
- Current and Future Market Size Value (USD Million) & Volume (Unit) Analysis and Forecast By Sales Channel, 2026 to 2036
- OEM
- Tier Supplier Integrated
- OEM
- Y-o-Y Growth Trend Analysis By Sales Channel, 2021 to 2025
- Absolute $ Opportunity Analysis By Sales Channel, 2026 to 2036
- Global Market Analysis and Forecast, By Region, 2021 to 2036
- Introduction
- Historical Market Size Value (USD Million) & Volume (Unit) Analysis By Region, 2021 to 2025
- Current Market Size Value (USD Million) & Volume (Unit) Analysis and Forecast By Region, 2026 to 2036
- North America
- Latin America
- Western Europe
- Eastern Europe
- East Asia
- South Asia and Pacific
- Middle East & Africa
- Market Attractiveness Analysis By Region
- North America Market Analysis and Forecast, By Country, 2021 to 2036
- Historical Market Size Value (USD Million) & Volume (Unit) Trend Analysis By Market Taxonomy, 2021 to 2025
- Market Size Value (USD Million) & Volume (Unit) Forecast By Market Taxonomy, 2026 to 2036
- By Country
- USA
- Canada
- Mexico
- By Linkage Type
- By Sensor Type
- By Vehicle Type
- By Application
- By Sales Channel
- By Country
- Market Attractiveness Analysis
- By Country
- By Linkage Type
- By Sensor Type
- By Vehicle Type
- By Application
- By Sales Channel
- Key Takeaways
- Latin America Market Analysis and Forecast, By Country
- Historical Market Size Value (USD Million) & Volume (Unit) Trend Analysis By Market Taxonomy, 2021 to 2025
- Market Size Value (USD Million) & Volume (Unit) Forecast By Market Taxonomy, 2026 to 2036
- By Country
- Brazil
- Chile
- Rest of Latin America
- By Linkage Type
- By Sensor Type
- By Vehicle Type
- By Application
- By Sales Channel
- By Country
- Market Attractiveness Analysis
- By Country
- By Linkage Type
- By Sensor Type
- By Vehicle Type
- By Application
- By Sales Channel
- Key Takeaways
- Western Europe Market Analysis and Forecast, By Country
- Historical Market Size Value (USD Million) & Volume (Unit) Trend Analysis By Market Taxonomy, 2021 to 2025
- Market Size Value (USD Million) & Volume (Unit) Forecast By Market Taxonomy, 2026 to 2036
- By Country
- Germany
- UK
- Italy
- Spain
- France
- Nordic
- BENELUX
- Rest of Western Europe
- By Linkage Type
- By Sensor Type
- By Vehicle Type
- By Application
- By Sales Channel
- By Country
- Market Attractiveness Analysis
- By Country
- By Linkage Type
- By Sensor Type
- By Vehicle Type
- By Application
- By Sales Channel
- Key Takeaways
- Eastern Europe Market Analysis and Forecast, By Country
- Historical Market Size Value (USD Million) & Volume (Unit) Trend Analysis By Market Taxonomy, 2021 to 2025
- Market Size Value (USD Million) & Volume (Unit) Forecast By Market Taxonomy, 2026 to 2036
- By Country
- Russia
- Poland
- Hungary
- Balkan & Baltic
- Rest of Eastern Europe
- By Linkage Type
- By Sensor Type
- By Vehicle Type
- By Application
- By Sales Channel
- By Country
- Market Attractiveness Analysis
- By Country
- By Linkage Type
- By Sensor Type
- By Vehicle Type
- By Application
- By Sales Channel
- Key Takeaways
- East Asia Market Analysis and Forecast, By Country
- Historical Market Size Value (USD Million) & Volume (Unit) Trend Analysis By Market Taxonomy, 2021 to 2025
- Market Size Value (USD Million) & Volume (Unit) Forecast By Market Taxonomy, 2026 to 2036
- By Country
- China
- Japan
- South Korea
- By Linkage Type
- By Sensor Type
- By Vehicle Type
- By Application
- By Sales Channel
- By Country
- Market Attractiveness Analysis
- By Country
- By Linkage Type
- By Sensor Type
- By Vehicle Type
- By Application
- By Sales Channel
- Key Takeaways
- South Asia and Pacific Market Analysis and Forecast, By Country
- Historical Market Size Value (USD Million) & Volume (Unit) Trend Analysis By Market Taxonomy, 2021 to 2025
- Market Size Value (USD Million) & Volume (Unit) Forecast By Market Taxonomy, 2026 to 2036
- By Country
- India
- ASEAN
- Australia & New Zealand
- Rest of South Asia and Pacific
- By Linkage Type
- By Sensor Type
- By Vehicle Type
- By Application
- By Sales Channel
- By Country
- Market Attractiveness Analysis
- By Country
- By Linkage Type
- By Sensor Type
- By Vehicle Type
- By Application
- By Sales Channel
- Key Takeaways
- Middle East & Africa Market Analysis and Forecast, By Country
- Historical Market Size Value (USD Million) & Volume (Unit) Trend Analysis By Market Taxonomy, 2021 to 2025
- Market Size Value (USD Million) & Volume (Unit) Forecast By Market Taxonomy, 2026 to 2036
- By Country
- Kingdom of Saudi Arabia
- Other GCC Countries
- Türkiye
- South Africa
- Other African Union
- Rest of Middle East & Africa
- By Linkage Type
- By Sensor Type
- By Vehicle Type
- By Application
- By Sales Channel
- By Country
- Market Attractiveness Analysis
- By Country
- By Linkage Type
- By Sensor Type
- By Vehicle Type
- By Application
- By Sales Channel
- Key Takeaways
- Key Countries Market Analysis
- USA
- Pricing Analysis
- Market Share Analysis, 2025
- By Linkage Type
- By Sensor Type
- By Vehicle Type
- By Application
- By Sales Channel
- Canada
- Pricing Analysis
- Market Share Analysis, 2025
- By Linkage Type
- By Sensor Type
- By Vehicle Type
- By Application
- By Sales Channel
- Mexico
- Pricing Analysis
- Market Share Analysis, 2025
- By Linkage Type
- By Sensor Type
- By Vehicle Type
- By Application
- By Sales Channel
- Brazil
- Pricing Analysis
- Market Share Analysis, 2025
- By Linkage Type
- By Sensor Type
- By Vehicle Type
- By Application
- By Sales Channel
- Chile
- Pricing Analysis
- Market Share Analysis, 2025
- By Linkage Type
- By Sensor Type
- By Vehicle Type
- By Application
- By Sales Channel
- Germany
- Pricing Analysis
- Market Share Analysis, 2025
- By Linkage Type
- By Sensor Type
- By Vehicle Type
- By Application
- By Sales Channel
- UK
- Pricing Analysis
- Market Share Analysis, 2025
- By Linkage Type
- By Sensor Type
- By Vehicle Type
- By Application
- By Sales Channel
- Italy
- Pricing Analysis
- Market Share Analysis, 2025
- By Linkage Type
- By Sensor Type
- By Vehicle Type
- By Application
- By Sales Channel
- Spain
- Pricing Analysis
- Market Share Analysis, 2025
- By Linkage Type
- By Sensor Type
- By Vehicle Type
- By Application
- By Sales Channel
- France
- Pricing Analysis
- Market Share Analysis, 2025
- By Linkage Type
- By Sensor Type
- By Vehicle Type
- By Application
- By Sales Channel
- India
- Pricing Analysis
- Market Share Analysis, 2025
- By Linkage Type
- By Sensor Type
- By Vehicle Type
- By Application
- By Sales Channel
- ASEAN
- Pricing Analysis
- Market Share Analysis, 2025
- By Linkage Type
- By Sensor Type
- By Vehicle Type
- By Application
- By Sales Channel
- Australia & New Zealand
- Pricing Analysis
- Market Share Analysis, 2025
- By Linkage Type
- By Sensor Type
- By Vehicle Type
- By Application
- By Sales Channel
- China
- Pricing Analysis
- Market Share Analysis, 2025
- By Linkage Type
- By Sensor Type
- By Vehicle Type
- By Application
- By Sales Channel
- Japan
- Pricing Analysis
- Market Share Analysis, 2025
- By Linkage Type
- By Sensor Type
- By Vehicle Type
- By Application
- By Sales Channel
- South Korea
- Pricing Analysis
- Market Share Analysis, 2025
- By Linkage Type
- By Sensor Type
- By Vehicle Type
- By Application
- By Sales Channel
- Russia
- Pricing Analysis
- Market Share Analysis, 2025
- By Linkage Type
- By Sensor Type
- By Vehicle Type
- By Application
- By Sales Channel
- Poland
- Pricing Analysis
- Market Share Analysis, 2025
- By Linkage Type
- By Sensor Type
- By Vehicle Type
- By Application
- By Sales Channel
- Hungary
- Pricing Analysis
- Market Share Analysis, 2025
- By Linkage Type
- By Sensor Type
- By Vehicle Type
- By Application
- By Sales Channel
- Kingdom of Saudi Arabia
- Pricing Analysis
- Market Share Analysis, 2025
- By Linkage Type
- By Sensor Type
- By Vehicle Type
- By Application
- By Sales Channel
- Türkiye
- Pricing Analysis
- Market Share Analysis, 2025
- By Linkage Type
- By Sensor Type
- By Vehicle Type
- By Application
- By Sales Channel
- South Africa
- Pricing Analysis
- Market Share Analysis, 2025
- By Linkage Type
- By Sensor Type
- By Vehicle Type
- By Application
- By Sales Channel
- USA
- Market Structure Analysis
- Competition Dashboard
- Competition Benchmarking
- Market Share Analysis of Top Players
- By Regional
- By Linkage Type
- By Sensor Type
- By Vehicle Type
- By Application
- By Sales Channel
- Emerging Startups
- Innovation Benchmarking
- Competition Analysis
- Competition Deep Dive
- Bosch
- Overview
- Product Portfolio
- Profitability by Market Segments (Product/Region/Sales Channel)
- Sales Footprint
- Strategy Overview
- Marketing Strategy
- Product Strategy
- Channel Strategy
- ZF
- Continental
- Denso
- Nexteer Automotive
- Bosch
- Case Studies
- Success Stories
- Recent Developments
- Competition Deep Dive
- Assumptions & Acronyms Used


