
- Market Size (2026)
- USD 15.6 Bn
- Forecast (2036)
- USD 134.1 Bn
- CAGR (2026 to 2036)
- 24.0%
How Big Is the Tensor Processing Unit Market in 2026?
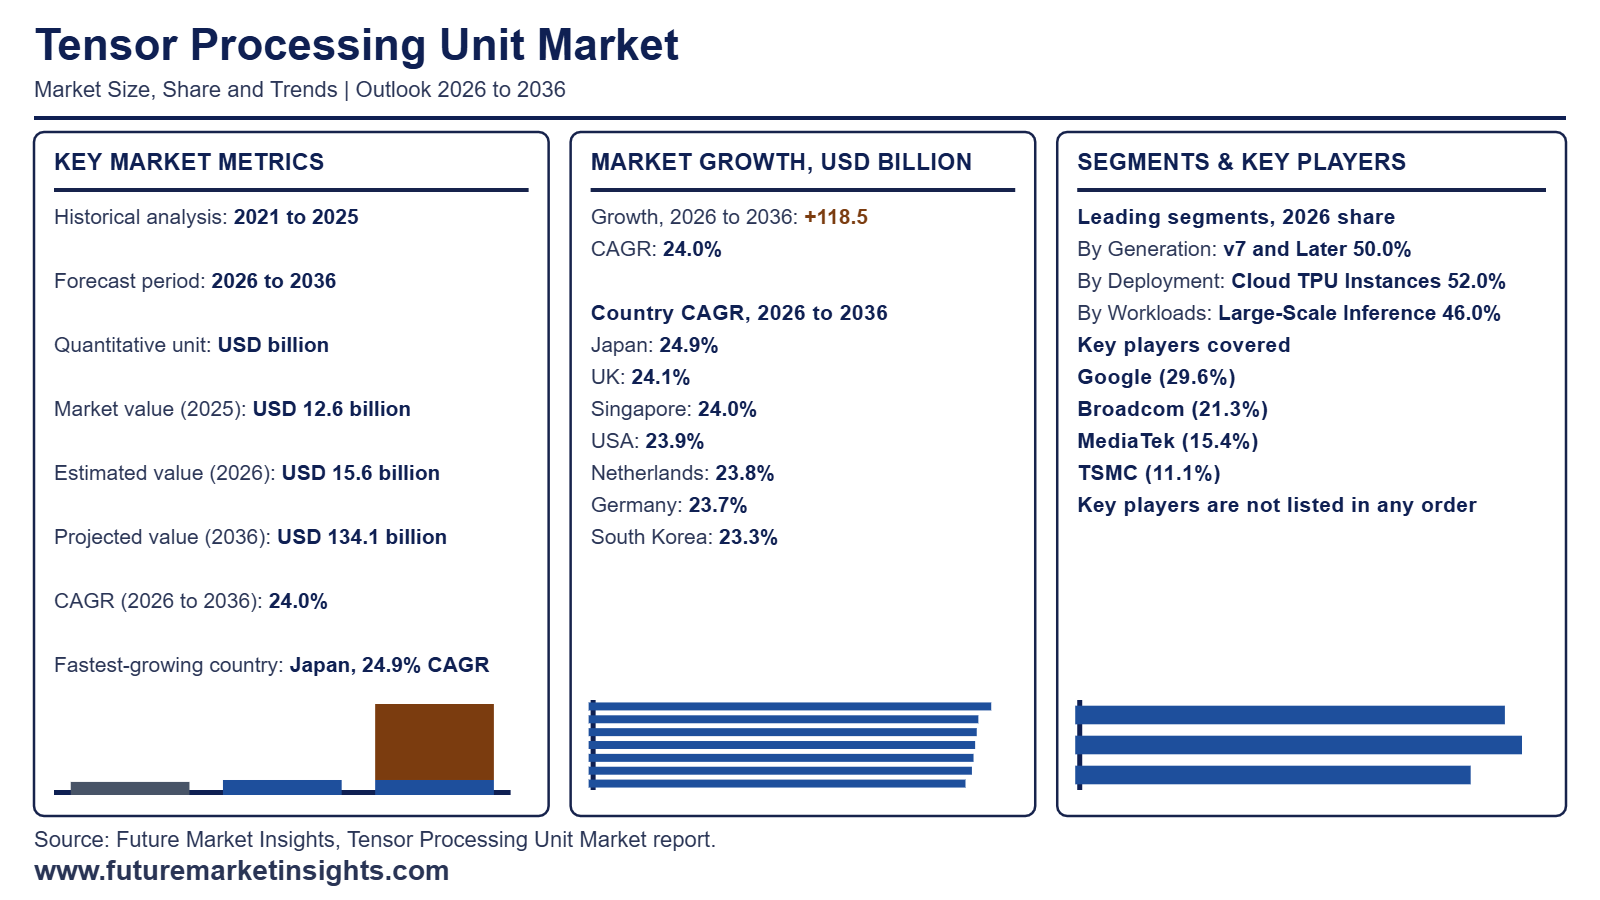
The global tensor processing unit market is valued at USD 15.6 billion in 2026, up from USD 12.6 billion in 2025, and is projected by Future Market Insights (FMI) to reach USD 134.1 billion by 2036, expanding at a 24.0% CAGR over the 2026 to 2036 forecast period.
| Market Metric | Valuation / Share / Forecast Benchmark |
|---|---|
| 2025 Market Size (Historical) | USD 12.6 billion |
| 2026 Market Size (Estimated) | USD 15.6 billion |
| 2036 Market Size (Projected) | USD 134.1 billion |
| Compound Annual Growth Rate (2026 to 2036) | 24.0% CAGR |
| Incremental Dollar Opportunity (2026 to 2036) | USD 118.5 billion |
| Dominant Generation (2026 to 2036 Share) | v7 and Later (50.0% in 2026, rising to 54.2% by 2036) |
| Leading & Fastest-Growing Generations | v7 and Later (50.0% share in 2026; 25.0% CAGR) | Edge and Embedded (28.0% CAGR) |
| Leading & Fastest-Growing Workloads | Large-Scale Inference (46.0% share in 2026; 25.5% CAGR) |
| Leading & Fastest-Growing Deployments | Cloud TPU Instances (52.0% share in 2026; 24.5% CAGR) | Dedicated Customer Capacity (26.8% CAGR) |
| Largest Country Markets (2026 Global Share) | USA (64.0%), Singapore (6.0%), Netherlands (5.0%) |
| Fastest-Growing Country Markets (2026 to 2036) | Japan (24.9% CAGR), UK (24.1% CAGR), Singapore (24.0% CAGR) |
| Leading Tier-1 Companies | Google (29.6%), Broadcom (21.3%), MediaTek (15.4%), TSMC (11.1%) |
Source: Future Market Insights analysis of the tensor processing unit market, 2026.
Executive Market Overview
Hyperscalers favor TPUs because silicon built around neural network math lets inference run at scale on hardware matched to the workload. Ironwood shows the design direction with more than 4 times the per-chip performance of Trillium and a single superpod of 9,216 chips (Google 2025). Demand for custom accelerators stays strong as Broadcom reported AI semiconductor revenue of USD 16.7 billion and rose 221% (Broadcom 2026). Large-Scale Inference holds 46.0% of Workload revenue with a 25.5% CAGR. Cloud TPU Instances capture 52.0% of Deployment as AI Labs and Model Developers rent capacity at 40.0% of Customer Type. v7 and Later leads Generation at 50.0% with 25.0% and Dedicated Customer Capacity advances fastest at 26.8% as labs secure private clusters.
Access to leading-edge foundry nodes and advanced packaging is the restraint specific to this market since every large accelerator designer draws on the same wafer capacity. TSMC drew 79% of wafer revenue from 7-nanometer and smaller nodes with 3-nanometer at 33% and 2-nanometer at 8% (TSMC 2026). Google at 29.6% and Broadcom at 21.3% lead company share ahead of MediaTek at 15.4% and TSMC at 11.1%. Japan is the fastest-growing country at a 24.9% CAGR ahead of the UK at 24.1% and Singapore at 24.0% as sovereign and enterprise clusters expand. The USA at 23.9% and the Netherlands at 23.8% advance next to Germany at 23.7% and South Korea at 23.3% across data center builds. Sizing covers TPU silicon and TPU-based systems and capacity while excluding GPUs and other custom accelerators outside the TPU line.
Analyst Perspective
The tensor processing unit market is accelerating as enterprises scale AI training and inference workloads that demand efficient purpose built silicon. Vendors that pair custom accelerators with mature cloud software stacks will capture growing hyperscale demand and build lasting platform loyalty.
- Sudip Saha, Principal Consultant, Future Market Insights.
Major Market Trends and Insights
- Inference Economics Steer Cloud Providers Toward Purpose Built TPUs: AI providers are moving more spending toward serving models so cloud platforms favor chips tuned for efficiency at scale. Large pods cut data movement and lower the cost of each query. Google Cloud (November 2025) says Ironwood links up to 9,216 chips in one superpod and delivers more than 4X better performance per chip than the prior Trillium generation. Anthropic plans to access up to 1 million TPUs. Google pairs the chips with liquid cooling to support dense racks and steady availability. Buyers that run large model fleets see TPU pods as a route to predictable unit economics and steady capacity planning.
- Custom Accelerator Orders Lift Broadcom and Anchor Customer Capacity Plans: TPU volume depends on design partners and large anchor buyers so supply agreements now carry as much weight as chip specifications. Broadcom (September 2026) reported AI semiconductor revenue of USD 16.7 billion up 221% year over year and expects USD 21.7 billion in its fourth quarter. Management described demand for custom accelerators and networking as very strong. Anthropic (April 2026) signed for multiple gigawatts of next generation TPU capacity arriving from 2027. Order books of this size give suppliers confidence to commit foundry and packaging capacity well ahead of delivery. Suppliers that secure memory and packaging early gain pricing strength with hyperscalers.
- US Export Rules Shape Where Accelerator Volume Can Ship: Controls on advanced computing chips set the boundaries for regional supply so compliance planning now sits inside accelerator roadmaps and cloud service design. The Bureau of Industry and Security (January 2026) moved license review for certain chips bound for China and Macau to a case by case basis effective 15 January 2026 with total processing performance below 21,000 and shipments capped at 50% of volume sent for US end use. Cloud providers renting accelerators must also vet remote users. Know your customer procedures sit at the center of those checks. Vendors with clear compliance practices keep access to the widest customer base.
What Are the Main Drivers, Restraints, and Opportunities?
Inference economics pull buyers toward rented TPU capacity while foundry and packaging limits slow supply and that gap rewards providers offering reserved dedicated capacity and edge variants to buyers in Japan and the UK and Singapore well beyond the USA.
Driver: Inference Workloads Shift Buying Toward Cloud TPU Capacity
Serving a model to millions of users repeats the same computation endlessly so cost per query matters more than peak training speed. Google built Ironwood for that pattern and Google Cloud (November 2025) said Anthropic plans to access up to a million of these chips. Cloud TPU instances suit this buying behavior since customers rent capacity as traffic grows instead of owning racks. The same pull explains why the USA hosts most deployments and why model developers and enterprise platform teams now weigh TPU rental prices against GPU options in the wider data center accelerator category every budget cycle.
Restraint: Foundry and Packaging Slots Cap Accelerator Output
Each TPU needs leading-edge wafers and advanced packaging from a handful of fabs so orders can outrun factory expansion for long stretches. TSMC (October 2026) reported strong leading-edge demand and a steep two-nanometer ramp while Broadcom (September 2026) described demand for its custom accelerators as very strong. Designers and cloud buyers therefore reserve wafer and advanced packaging slots long before racks ship and smaller programs outside Google can wait behind larger commitments. Buyers in Japan and the UK that want dedicated capacity face the same queue. Delivery dates for new racks shift with foundry schedules more than with software readiness.
Opportunity: Reserved Capacity Deals Open Doors Beyond Hyperscalers
Model developers now sign reserved capacity deals rather than renting by the hour because training and serving plans run years ahead. Anthropic (April 2026) signed for multiple gigawatts of next-generation TPU capacity starting next year with most of it sited in the USA. FMI sees Dedicated Customer Capacity as the fastest deployment route and Edge and Embedded as the fastest generation while Japan and the UK and Singapore lead country growth. Singapore EDB (February 2026) recorded Google commitments to four data center and cloud region sites there and MediaTek (April 2026) described several new data center ASIC opportunities in final discussion. Rival GPU suppliers such as those in the data center GPU category must now match reserved terms.
How Is the Tensor Processing Unit Market Segmented?
Segmentation of the global tensor processing unit market covers generation and workload and deployment and customer type and region with each axis describing a separate buying decision and totaling to the full market.
| Segmentation Axis | Sub-Segments Covered | 2026 Leading Segment and Share | Main Growth Benchmark (2026 to 2036) |
|---|---|---|---|
| Generation | v7 and Later / v6 (Trillium) / v5 and Earlier / Edge and Embedded | v7 and Later (50.0% revenue share) | v7 and Later share rises to 54.2% by 2036 at 25.0% CAGR |
| Workload | Large-Scale Inference / Foundation-Model Training / Recommendation and Ranking / Scientific and Other Computing | Large-Scale Inference (46.0% revenue share) | Large-Scale Inference share rises to 51.8% by 2036 at 25.5% CAGR |
| Deployment | Cloud TPU Instances / Google Internal Services / Dedicated Customer Capacity / Edge Devices | Cloud TPU Instances (52.0% revenue share) | Cloud TPU Instances share rises to 54.1% by 2036 at 24.5% CAGR |
| Customer Type | AI Labs and Model Developers / Google Internal / Enterprises / Research and Public Sector | AI Labs and Model Developers (40.0% revenue share) | AI Labs and Model Developers share rises to 43.3% by 2036 at 25.0% CAGR |
| Region | North America / Latin America / Western Europe / Eastern Europe / East Asia / South Asia and Pacific / Middle East and Africa | United States (64.0% global country share) | Japan leads country growth at 24.9% CAGR |
Source. Future Market Insights analysis of the tensor processing unit market 2026.
Why Does v7 and Later Lead by Generation?
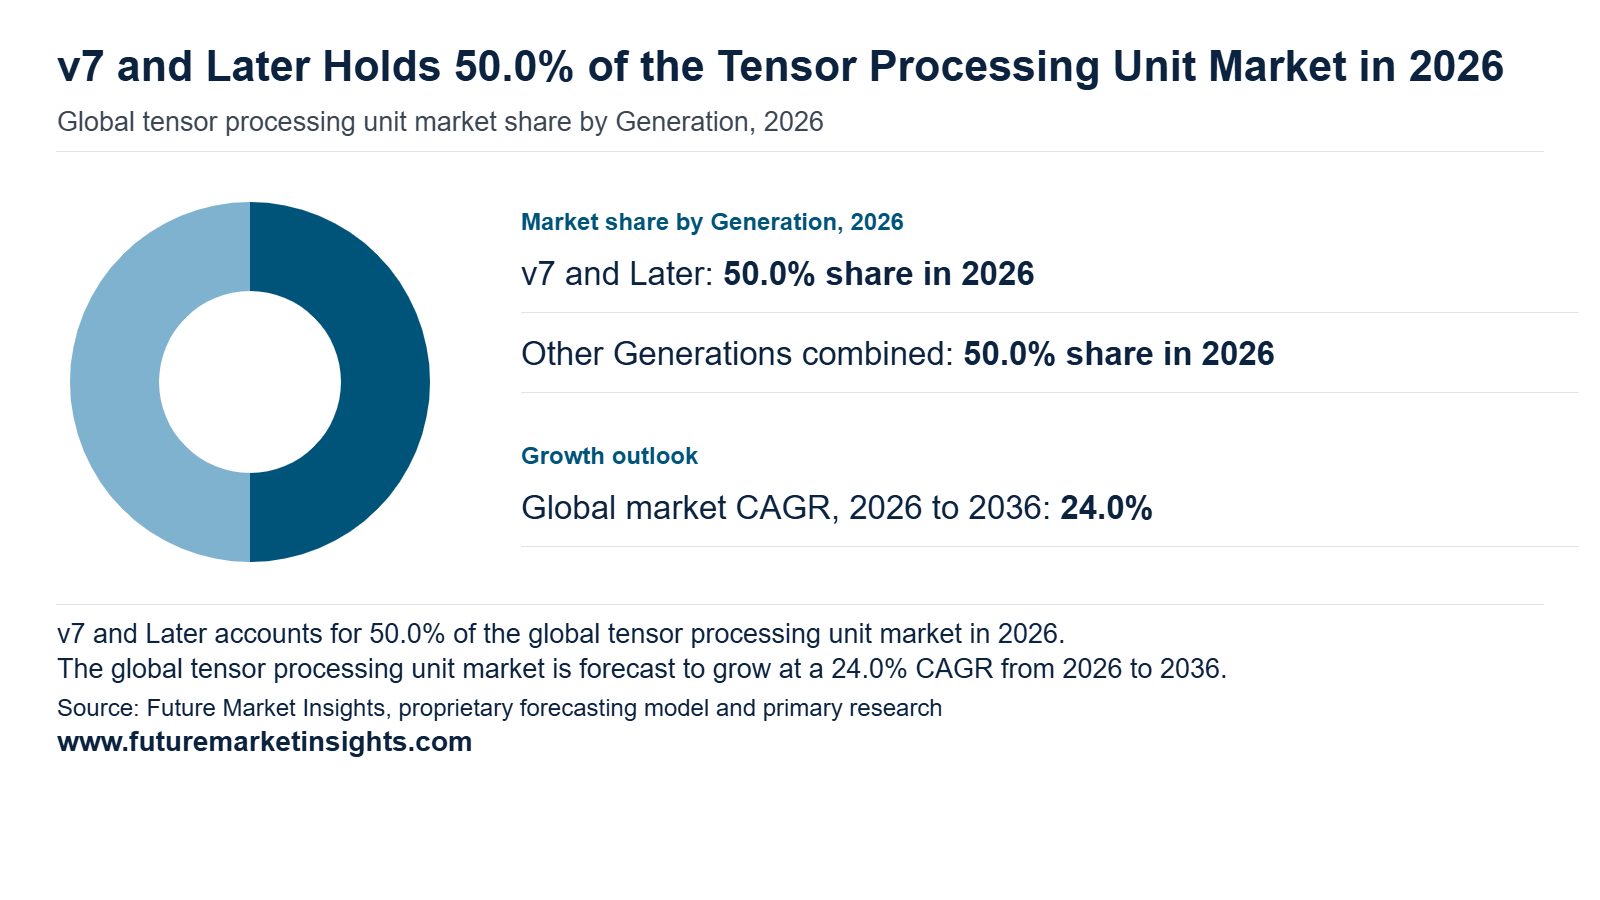
The v7 and later generation leads with a 50.0% share in 2026 and is projected to reach 54.2% by 2036 at a 25.0% CAGR. Google’s Ironwood class pods deliver the memory capacity and interconnect bandwidth that frontier model builders need for serving and training at scale. Rack power densities at this level push operators toward liquid cooled halls and retrofits tracked across data center liquid cooling deployments. Broadcom and MediaTek carry design roles while TSMC supplies leading-edge wafers and advanced packaging that anchor volume ramps. Trillium and v5 and earlier generations remain in service for steady workloads while edge and embedded variants extend the architecture to devices.
Why Does Large-Scale Inference Lead by Workload?
Large-scale inference leads by workload with a 46.0% share in 2026 and is projected to move to 51.8% by 2036 at a 25.5% CAGR. Every deployed chatbot and coding assistant and search summary generates serving traffic that grows with user counts rather than training budgets. Product teams pursuing generative AI features track cost per token closely and select accelerators on throughput per watt and per dollar. TPUs fit this need through high utilization on batched requests and large on-package memory for long context windows. Foundation-model training and recommendation and ranking and scientific computing add concurrent demand on the same fleets.
Why Do Cloud TPU Instances Lead by Deployment?
Cloud TPU instances lead by deployment with a 52.0% share in 2026 and are projected to reach 54.1% by 2036 at a 24.5% CAGR. Startups and enterprises rent capacity through Google Cloud by the hour or by committed term which converts large capital outlays into operating spend. Integration with JAX and PyTorch and managed Kubernetes lets teams port workloads quickly. Buyers weighing cloud computing commitments compare TPU pricing against GPU instances and negotiate reserved blocks in the United States and Japan and the Netherlands. Google internal services and dedicated customer capacity and edge devices follow with captive or private footprints.
Why Do AI Labs and Model Developers Lead by Customer Type?
AI labs and model developers lead by customer type with a 40.0% share in 2026 and are projected to account for 43.3% by 2036 at a 25.0% CAGR. Labs such as Anthropic have secured access to very large TPU capacity under multi-year agreements with Google which lets them plan training runs and serving fleets ahead of model launches. Supply partners gain visibility for wafer and packaging allocation. Competition on model quality keeps compute budgets large at these buyers. Google internal teams and enterprises and research and public sector institutions follow with workloads tied to products and internal analytics and academic programs.
Tensor Processing Unit Market by Region and Country (2026 to 2036)
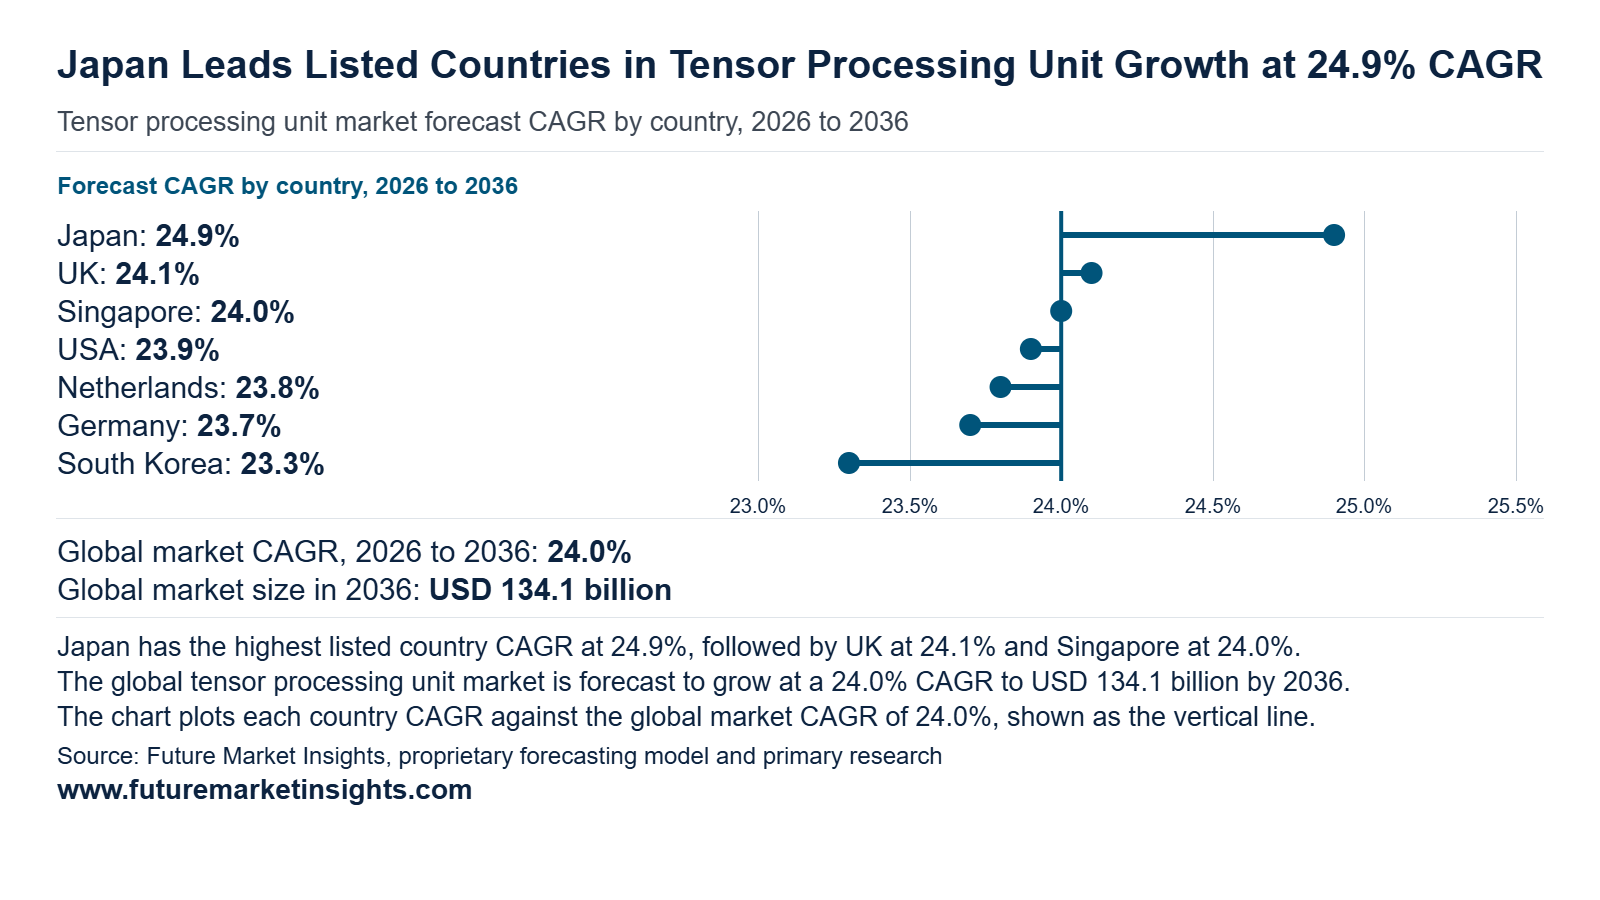
Demand for tensor processing units is spread across four regions. North America holds the largest base through the USA. Western Europe adds depth through the Netherlands and the UK and Germany. East Asia gains pace through Japan and South Korea. South Asia and Pacific is led by Singapore. Buyers in these countries are hyperscale cloud operators and national compute programs, and each adds accelerator capacity as AI workloads scale. Japan leads on growth, followed by the UK and Singapore.
| Country | 2026 Revenue (USD billion) | 2036 Revenue (USD billion) | 10-Year Addition (USD billion) | 2026 to 2036 CAGR | Global Share (2026 → 2036) |
|---|---|---|---|---|---|
| Japan | 0.26 | 2.40 | 2.14 | 24.9% | 4.0% → 4.3% |
| UK | 0.23 | 1.97 | 1.74 | 24.1% | 3.5% → 3.5% |
| Singapore | 0.39 | 3.35 | 2.96 | 24.0% | 6.0% → 6.0% |
| USA | 4.16 | 35.47 | 31.31 | 23.9% | 64.0% → 63.5% |
| Netherlands | 0.33 | 2.75 | 2.42 | 23.8% | 5.0% → 4.9% |
| Germany | 0.20 | 1.64 | 1.44 | 23.7% | 3.0% → 2.9% |
| South Korea | 0.16 | 1.32 | 1.16 | 23.3% | 2.5% → 2.4% |
| Rest of World | 0.78 | 6.97 | 6.19 | 24.5% | 12.0% → 12.5% |
Source: Future Market Insights analysis of the tensor processing unit market, 2026.
Japan
The Cabinet approved the Second AI Basic Plan on July 14 2026 and named computing resources as national AI infrastructure. The plan also lists sufficient power capacity and domestic data centers among the core elements. Japan is the fastest-growing country in the tensor processing unit market at a 24.9% CAGR and lifts its global share from 4.0% in 2026 to 4.3% by 2036. It aims for an open form of AI sovereignty. Cloud providers and research institutions in Tokyo and Osaka therefore add accelerator clusters under a national mandate for domestic compute. Public backing of this kind should keep orders for tensor processing units rising through 2036.
UK
The Digital and Technologies Sector Plan update of June 2026 reports five AI Growth Zones expected to generate £28.2 billion in investment. The UK ranks second at a 24.1% CAGR and holds a steady 3.5% share across the forecast period. The government has announced £750 million for a national AI supercomputer including up to £400 million for next-generation AI chips. The Sovereign AI venture fund has allocated over 3 million GPU hours of compute to startups. University labs and Oxford to Cambridge start-ups gain access to accelerators through these programs. Public purchasing of chips should widen the base of tensor processing unit users through 2036.
Singapore
Singapore ranks third at a 24.0% CAGR and holds a 6.0% global share in both 2026 and 2036. The Economic Development Board and IMDA provisionally allocated 200 megawatts of new data centre capacity to four operators on August 21 2026 under the second call for application. Singapore releases capacity through competitive calls and this directs each new megawatt to dense AI clusters. Regional cloud platforms and financial institutions serving Southeast Asia place accelerator racks in these facilities. Operators that win these allocations commit to high rack density and efficient cooling for AI workloads. The steady release of capacity should keep demand for tensor processing units strong across 2036 and protect Singapore’s position as the leading hub in South Asia and Pacific.
USA
The USA anchors the market with a 64.0% global share in 2026 and a 23.9% CAGR that ranks fourth. The Energy Information Administration (September 2026) expects US electricity generation to rise 2.2% to a record 4368 billion kilowatthours in 2026 on data center development and manufacturing growth. The West South Central region leads the growth in electricity sales. Hyperscale cloud operators and AI laboratories in Texas and Virginia and the Pacific Northwest build the largest accelerator fleets worldwide. Power availability guides these buildouts and keeps procurement of tensor processing units continuous. Cloud customers lease this capacity to enterprises across every sector. These dynamics should sustain buying through 2036 with the share near 63.5%.
Netherlands
Amsterdam serves as a major European data center hub and hosts cloud regions for multinational firms. A defined national compute plan should guide operators toward accelerator capacity for local AI workloads. Enterprises and research bodies in Groningen and Eindhoven add further demand for shared accelerators. Planned infrastructure investments should keep the country near 4.9% of global revenue through 2036. The Netherlands holds a 5.0% share in 2026 and a 23.8% CAGR that ranks fifth. The Dutch cabinet approved its AI vision on November 6 2026. It will publish a plan for the AI infrastructure and computing power the country needs in early 2027.
Germany
Germany records a 23.7% CAGR with its share near 3.0% in 2026 and 2.9% by 2036. The federal government adopted the National Data Center Strategy on March 18 2026 and set targets for 2030. Data center capacity should at least double and AI and high-performance computing capacity should at least quadruple. The government aims to bring an AI Gigafactory to Germany. It wants to act as an anchor customer. Automotive and machinery and chemical groups in Bavaria and Baden-Wuerttemberg need sovereign compute for industrial AI. Anchor purchasing by the state should secure steady demand for tensor processing units through 2036.
South Korea
South Korea records a 23.3% CAGR and a 2.5% share in 2026 that settles near 2.4% by 2036. The Ministry of Science and ICT held the groundbreaking for the National AI Computing Center at Solasido Data Center Park in Haenam on August 3 2026. Completion is scheduled for 2028. A private consortium serves as business operator. Korean model developers and electronics groups and universities gain a shared pool of accelerators through this public-private structure. Startups building domestic language models benefit as well and add orders for new accelerator clusters. Shared national capacity should convert into steady purchases of tensor processing units through 2036.
Competitive Environment and Notable Companies
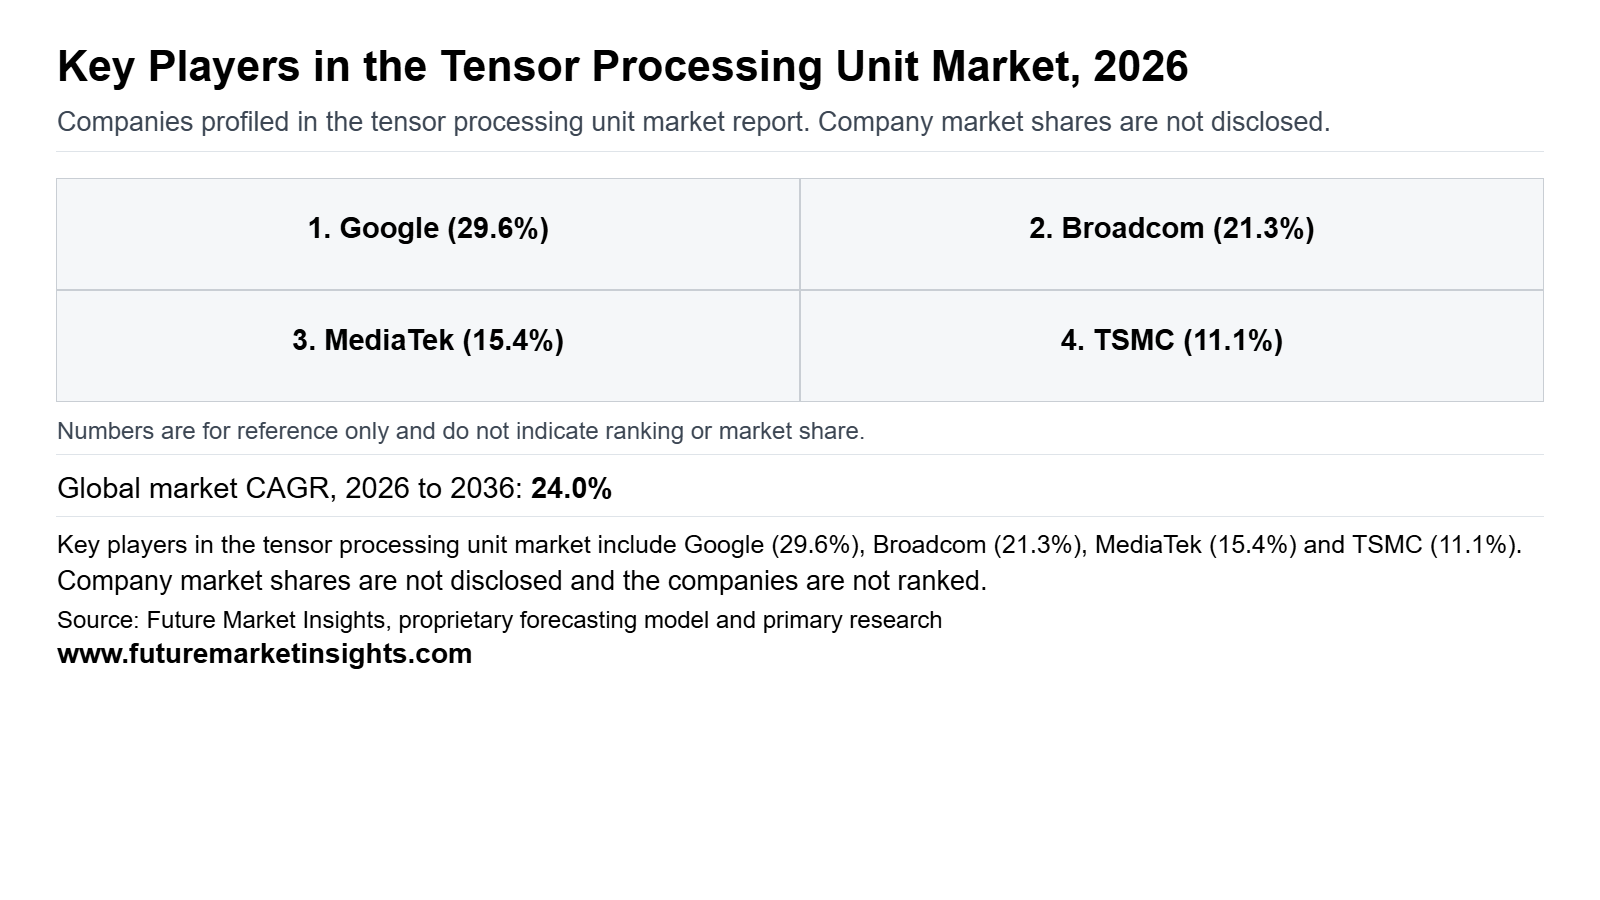
Notable companies shaping the global tensor processing unit market include Google, Broadcom, MediaTek, and TSMC. Competition forms at two structural levels. Google owns the architecture and the cloud channel that delivers each TPU generation to customers. Broadcom and MediaTek sit at the design partner level with custom silicon and interconnect capabilities while TSMC supplies the leading-edge manufacturing that every program depends on. Platform ownership and a full software and cloud stack keep Google as the leading company. Custom accelerator programs for additional hyperscaler customers show the clearest partnership scope beyond the core cloud relationship.
How Are Companies Positioned in the Tensor Processing Unit Market?
Positioning follows a layered model. Google introduced its eighth generation TPUs on 22 April 2026 with two architectures where TPU 8t targets large-scale training and TPU 8i targets low-latency inference (Google, April 2026). Splitting the roadmap lets each chip serve a distinct workload. Broadcom reported third quarter AI semiconductor revenue of USD 16.7 billion that rose 221% year over year (Broadcom, September 2026). MediaTek presents Data Center Solutions as a platform from chip design through rack integration (MediaTek, May 2026).
What Matters When a Buyer Selects a Tensor Processing Unit Supplier?
Buyers choose on efficiency and scale and delivery certainty. Training teams want shorter development cycles while serving teams want lower cost per response. Google claims TPU 8i delivers 80% better performance per dollar and both chips deliver up to 2x better performance per watt than Ironwood (Google, April 2026). Broadcom guided fourth quarter AI semiconductor revenue to USD 21.7 billion (Broadcom, September 2026). That outlook signals the supply ramp behind custom accelerators. Buyers should read these figures as company claims and confirm them through pilot workloads.
Which Capabilities Distinguish Product Offers?
Offers separate on system scale and memory design and interconnect. TPU 8t scales a superpod to 9600 chips with 2 petabytes of shared high-bandwidth memory while TPU 8i carries 288 GB of high-bandwidth memory and 384 MB of on-chip SRAM (Google, April 2026). MediaTek showed co-packaged optics that reach up to 400 Gbps per fiber and MicroLED interconnect that lowers power use by 50% (MediaTek, May 2026). Each layer widens what a custom accelerator program can deliver.
How Does Geographic Reach Affect Competition?
Reach depends on cloud delivery and on where design and manufacturing capacity sits. Google plans general availability of both new chips later in 2026 through its AI Hypercomputer offering (Google, April 2026). TSMC guided fourth quarter 2026 revenue to USD 52.3 billion to USD 54.3 billion (TSMC, October 2026). The guidance shows how much leading-edge capacity the AI accelerator ecosystem draws from a single foundry base. Design partners in California and Taiwan therefore connect through a shared manufacturing footprint.
| Verified Company Evidence (2026) | Commercial Effect | Buyer Action |
|---|---|---|
| 22 April 2026 Google introduced TPU 8t for training and TPU 8i for inference as its eighth generation [Google (April 2026)]. | Separates the roadmap by workload and gives cloud customers a dedicated option for each. | Map training and serving workloads to the matching chip before committing capacity. |
| 28 May 2026 MediaTek presented Data Center Solutions with custom ASIC and custom XPU designs and 2.5D and 3.5D packaging [MediaTek (May 2026)]. | Widens the pool of design partners able to deliver custom AI silicon. | Compare partner scope across design and packaging and rack integration. |
| 2 September 2026 Broadcom reported third quarter AI semiconductor revenue of USD 16.7 billion and guided fourth quarter AI revenue to USD 21.7 billion [Broadcom (September 2026)]. | Shows rising volume behind custom accelerators and AI networking. | Confirm delivery schedules and networking pairing in custom accelerator programs. |
Source: Verified corporate disclosures and Future Market Insights analysis, 2026.
| Company | Core Positioning | Verified Activity & Source Attribution |
|---|---|---|
| Architecture owner and cloud provider of TPU capacity and the leading company | Introduced TPU 8t and TPU 8i on 22 April 2026 with general availability planned later in 2026 (Google, April 2026). | |
| Broadcom | Semiconductor supplier of custom AI accelerators and AI networking | Reported USD 16.7 billion of third quarter AI semiconductor revenue on 2 September 2026 (Broadcom, September 2026). |
| MediaTek | Chip designer with a Data Center Solutions platform | Presented custom ASIC and XPU capabilities and co-packaged optics on 28 May 2026 (MediaTek, May 2026). |
| TSMC | Leading-edge foundry and advanced packaging supplier | Reported third quarter 2026 revenue of USD 46.72 billion and guided fourth quarter revenue to USD 52.3 billion to USD 54.3 billion (TSMC, October 2026). |
Source: Verified corporate disclosures and Future Market Insights analysis, 2026.
Tensor Processing Unit Market Report Scope and Research Methodology
FMI sizes the tensor processing unit market by tracking TPU chip capacity deployed in each country and valuing it at the realized rental or sale rate per chip hour. Capacity data is cross-checked against hyperscale data center build totals and chip supply volumes reported by design and foundry partners. Cloud TPU instances anchor the model because they are the main route through which external buyers consume TPU compute. Capacity used in Google internal services is valued at equivalent cloud rental rates so internal and external use share one value basis. Revenue is counted in the country where the capacity operates. Segment and country figures sum to the global total in every year. Company disclosures verify product generations and roadmaps rather than estimate proprietary company revenue.
| Coverage Field | Report Scope |
|---|---|
| Market definition | Revenue from TPU compute capacity delivered through cloud instances and dedicated customer capacity and Google internal services and edge devices for AI training and inference workloads. |
| Product types | v7 and later / v6 (Trillium) / v5 and earlier / edge and embedded TPUs |
| Variants | Large-scale inference / foundation-model training / recommendation and ranking / scientific and other computing |
| Ingredients or materials included | Custom AI accelerator silicon and high-bandwidth memory and interconnect fabric and liquid-cooled pod hardware and compiler software |
| Packaging formats | Cloud TPU instances / dedicated customer capacity / internal service allocations / edge modules |
| Distribution channels | Cloud platform marketplace / direct enterprise agreements / internal allocation / device partners |
| End users | AI labs and model developers / Google internal teams / enterprises / research and public sector |
| Exclusions | GPUs and other non-TPU accelerators / general-purpose servers and CPUs / networking equipment sold apart from TPU pods / AI software and model licensing revenue |
| Quantitative units | USD billion for value and TPU chip hours for volume |
| Volume basis | TPU chip hour equivalents with generations and pod configurations converted to a common chip basis |
| Value basis | Revenue from capacity in each country counted where the capacity operates with internal use valued at cloud rental rates |
| Regions covered | North America / Latin America / Western Europe / Eastern Europe / East Asia / South Asia and Pacific / Middle East and Africa |
| National coverage | United States / Singapore / Netherlands / Japan / United Kingdom / Germany / South Korea |
| Companies covered | Google / Broadcom / MediaTek / TSMC |
Source: Future Market Insights analysis of the tensor processing unit market, 2026.
Research Sources and Bibliography
- Anthropic (April 2026). Anthropic expands partnership with Google and Broadcom for multiple gigawatts of next-generation compute [company announcement, April 6, 2026]. https://anthropic.com/news/google-broadcom-partnership-compute
- Broadcom (September 2026). Broadcom Inc. Announces Third Quarter Fiscal Year 2026 Financial Results and Quarterly Dividend [press release, September 2, 2026]. https://investors.broadcom.com/news-releases/news-release-details/broadcom-inc-announces-third-quarter-fiscal-year-2026-financial
- Bundesministerium für Digitales und Staatsmodernisierung, Germany (September 2026). Halbjahresbilanz Rechenzentrumsstrategie: „Wir setzen den Fahrplan zügig um“ [press release 57/2026, 18 September 2026]. https://bmds.bund.de/aktuelles/pressemitteilungen/detail/halbjahresbilanz-rechenzentrumsstrategie-wir-setzen-den-fahrplan-zuegig-um
- Bureau of Industry and Security, US Department of Commerce (January 2026). Revision to License Review Policy for Advanced Computing Commodities [15 January 2026]. https://www.govinfo.gov/content/pkg/FR-2026-01-15/html/2026-00789.htm
- Cabinet Office, Government of Japan (July 2026). Summary of Japan’s Second AI Basic Plan [cabinet decision summary, 14 July 2026]. https://www8.cao.go.jp/cstp/ai/ai_plan/aiplan_g_eng_20260714.pdf
- Department for Science, Innovation and Technology, UK (June 2026). Digital and Technologies Sector Plan: Year One Update [policy update, June 2026]. https://assets.publishing.service.gov.uk/media/6a295455db0592d809052c11/D_T_Sector_Plan_PDF_F_A.pdf
- Economic Development Board, Singapore (August 2026). Four data centre proposals selected as part of second data centre call for application (DC-CFA2) [press release, 21 August 2026]. https://www.edb.gov.sg/en/about-edb/media-releases-publications/four-data-centre-proposals-selected-as-part-of-second-data-centre.html
- Economic Development Board, Singapore (February 2026). Google deepens AI investment in Singapore with expanded R&D [agency news release, February 10, 2026]. https://www.edb.gov.sg/en/news-and-insights/google-deepens-ai-investment-in-singapore-with-expanded-rnd
- Google (April 2026). Our Eighth Generation TPUs: Two Chips for the Agentic Era [Company blog post, 22 April 2026]. https://blog.google/innovation-and-ai/infrastructure-and-cloud/google-cloud/eighth-generation-tpu-agentic-era/
- Google Cloud (November 2025). Announcing Ironwood TPUs General Availability and new Axion VMs to power the age of inference [company blog, November 6, 2025]. https://cloud.google.com/blog/products/compute/ironwood-tpus-and-new-axion-based-vms-for-your-ai-workloads/
- Government of the Netherlands, Rijksoverheid (November 2026). Kabinet kiest voor AI die Nederland vooruithelpt [news release, 6 November 2026]. https://www.rijksoverheid.nl/actueel/nieuws/2026/11/06/kabinet-kiest-voor-ai-die-nederland-vooruithelpt
- Korea.net, Ministry of Science and ICT (August 2026). Construction of Nat’l AI Computing Center begins, to end in 2028 [news article, 4 August 2026]. https://www.korea.net/NewsFocus/policies/view?articleId=297207&koreanId=297173
- MediaTek (April 2026). First Quarter 2026 Investor Conference Transcript [earnings call transcript, April 30, 2026]. https://www.mediatek.com/hubfs/MediaTek%20Assets/Pdfs/Quarterly%20Earnings%20Release/2026/Quarterly%20Earnings%20Release-2026Q1/Transcript.pdf
- MediaTek (May 2026). MediaTek to Empower the Agentic AI Era with Edge-to-Cloud Tech at Computex 2026 [Press release, 28 May 2026]. https://www.mediatek.com/press-room/mediatek-to-empower-the-agentic-ai-era-with-edge-to-cloud-tech-at-computex-2026
- TSMC (October 2026). Quarterly Results 2026 Q3 [Investor relations page, accessed 17 November 2026]. https://investor.tsmc.com/english/quarterly-results/2026/q3
- TSMC (October 2026). TSMC Reports Third Quarter EPS of NT$29.43 [press release, October 15, 2026]. https://pr.tsmc.com/english/news/3346
- U.S. Energy Information Administration (September 2026). EIA expects record electricity generation in 2026 and 2027 [press release, 9 September 2026]. https://www.eia.gov/pressroom/releases/press592.php
Table of Content
- Key Takeaways
- Market Size and CAGR
- Top Growth Driver
- Fastest Growing Segment
- Leading Region
- Key Companies
- Emerging Opportunities
- Executive Summary
- Global Market Outlook
- Demand-side Trends
- Supply-side Trends
- Technology Roadmap Analysis
- Analysis and Recommendations
- Analyst Perspective (What is happening? Why now? What should investors know?)
- Key Questions Answered
- How large is the market?
- What is the CAGR?
- What are key trends?
- Which region dominates?
- Who are the leaders?
Read More...
- Market Overview
- Market Coverage / Taxonomy
- Market Definition / Scope / Limitations
- Research Methodology
- Chapter Orientation
- Analytical Lens and Working Hypotheses
- Market Structure, Signals, and Trend Drivers
- Benchmarking and Cross-market Comparability
- Market Sizing, Forecasting, and Opportunity Mapping
- Research Design and Evidence Framework
- Desk Research Programme (Secondary Evidence)
- Expert Input and Fieldwork (Primary Evidence)
- Tooling, Models, and Reference Databases
- Data Engineering and Model Build
- Quality Assurance and Audit Trail
- Market Background
- Market Dynamics (Drivers, Restraints, Opportunity, Trends)
- Scenario Forecast (Optimistic, Likely, Conservative)
- Impact Analysis
- AI Impact
- Sustainability Impact
- Regulatory Impact
- Technology Impact
- Consumer / Buyer Analysis
- Purchase Drivers
- Adoption Barriers
- Buyer Journey
- Opportunity Map Analysis
- Product Life Cycle Analysis
- Supply Chain Analysis
- Investment Feasibility Matrix
- Value Chain Analysis
- PESTLE and Porter's Analysis
- Regulatory Landscape
- Regional Parent Market Outlook
- Production and Consumption Statistics
- Import and Export Statistics
- Global Market Analysis and Forecast, 2021 to 2036
- Historical Market Size Value (USD Billion) Analysis, 2021 to 2025
- Current and Future Market Size Value (USD Billion) Projections, 2026 to 2036
- Y-o-Y Growth Trend Analysis
- Absolute $ Opportunity Analysis
- Global Market Pricing Analysis, 2021 to 2036
- Global Market Analysis and Forecast, By Generation, 2021 to 2036
- Introduction / Key Findings
- Historical Market Size Value (USD Billion) Analysis By Generation, 2021 to 2025
- Current and Future Market Size Value (USD Billion) Analysis and Forecast By Generation, 2026 to 2036
- v7 and Later
- v6 (Trillium)
- v5 and Earlier
- Edge and Embedded
- Y-o-Y Growth Trend Analysis By Generation, 2021 to 2025
- Absolute $ Opportunity Analysis By Generation, 2026 to 2036
- Global Market Analysis and Forecast, By Workload, 2021 to 2036
- Introduction / Key Findings
- Historical Market Size Value (USD Billion) Analysis By Workload, 2021 to 2025
- Current and Future Market Size Value (USD Billion) Analysis and Forecast By Workload, 2026 to 2036
- Large-Scale Inference
- Foundation-Model Training
- Recommendation and Ranking
- Scientific and Other Computing
- Y-o-Y Growth Trend Analysis By Workload, 2021 to 2025
- Absolute $ Opportunity Analysis By Workload, 2026 to 2036
- Global Market Analysis and Forecast, By Deployment, 2021 to 2036
- Introduction / Key Findings
- Historical Market Size Value (USD Billion) Analysis By Deployment, 2021 to 2025
- Current and Future Market Size Value (USD Billion) Analysis and Forecast By Deployment, 2026 to 2036
- Cloud TPU Instances
- Google Internal Services
- Dedicated Customer Capacity
- Edge Devices
- Y-o-Y Growth Trend Analysis By Deployment, 2021 to 2025
- Absolute $ Opportunity Analysis By Deployment, 2026 to 2036
- Global Market Analysis and Forecast, By Customer Type, 2021 to 2036
- Introduction / Key Findings
- Historical Market Size Value (USD Billion) Analysis By Customer Type, 2021 to 2025
- Current and Future Market Size Value (USD Billion) Analysis and Forecast By Customer Type, 2026 to 2036
- AI Labs and Model Developers
- Google Internal
- Enterprises
- Research and Public Sector
- Y-o-Y Growth Trend Analysis By Customer Type, 2021 to 2025
- Absolute $ Opportunity Analysis By Customer Type, 2026 to 2036
- Global Market Analysis and Forecast, By Region, 2021 to 2036
- Introduction
- Historical Market Size Value (USD Billion) Analysis By Region, 2021 to 2025
- Current Market Size Value (USD Billion) Analysis and Forecast By Region, 2026 to 2036
- North America
- Latin America
- Western Europe
- Eastern Europe
- East Asia
- South Asia and Pacific
- Middle East and Africa
- Market Attractiveness Analysis By Region
- North America Market Analysis and Forecast, By Country, 2021 to 2036
- Historical Market Size Value (USD Billion) Trend Analysis By Market Taxonomy, 2021 to 2025
- Market Size Value (USD Billion) Forecast By Market Taxonomy, 2026 to 2036
- By Country
- United States
- Canada
- By Generation
- By Workload
- By Deployment
- By Customer Type
- By Country
- Market Attractiveness Analysis
- By Country
- By Generation
- By Workload
- By Deployment
- By Customer Type
- Key Takeaways
- Latin America Market Analysis and Forecast, By Country, 2021 to 2036
- Historical Market Size Value (USD Billion) Trend Analysis By Market Taxonomy, 2021 to 2025
- Market Size Value (USD Billion) Forecast By Market Taxonomy, 2026 to 2036
- By Country
- Brazil
- Mexico
- Argentina
- Chile
- By Generation
- By Workload
- By Deployment
- By Customer Type
- By Country
- Market Attractiveness Analysis
- By Country
- By Generation
- By Workload
- By Deployment
- By Customer Type
- Key Takeaways
- Western Europe Market Analysis and Forecast, By Country, 2021 to 2036
- Historical Market Size Value (USD Billion) Trend Analysis By Market Taxonomy, 2021 to 2025
- Market Size Value (USD Billion) Forecast By Market Taxonomy, 2026 to 2036
- By Country
- Germany
- France
- United Kingdom
- Italy
- Spain
- Benelux
- Nordics
- By Generation
- By Workload
- By Deployment
- By Customer Type
- By Country
- Market Attractiveness Analysis
- By Country
- By Generation
- By Workload
- By Deployment
- By Customer Type
- Key Takeaways
- Eastern Europe Market Analysis and Forecast, By Country, 2021 to 2036
- Historical Market Size Value (USD Billion) Trend Analysis By Market Taxonomy, 2021 to 2025
- Market Size Value (USD Billion) Forecast By Market Taxonomy, 2026 to 2036
- By Country
- Poland
- Czech Republic
- Romania
- Hungary
- By Generation
- By Workload
- By Deployment
- By Customer Type
- By Country
- Market Attractiveness Analysis
- By Country
- By Generation
- By Workload
- By Deployment
- By Customer Type
- Key Takeaways
- East Asia Market Analysis and Forecast, By Country, 2021 to 2036
- Historical Market Size Value (USD Billion) Trend Analysis By Market Taxonomy, 2021 to 2025
- Market Size Value (USD Billion) Forecast By Market Taxonomy, 2026 to 2036
- By Country
- China
- Japan
- South Korea
- By Generation
- By Workload
- By Deployment
- By Customer Type
- By Country
- Market Attractiveness Analysis
- By Country
- By Generation
- By Workload
- By Deployment
- By Customer Type
- Key Takeaways
- South Asia and Pacific Market Analysis and Forecast, By Country, 2021 to 2036
- Historical Market Size Value (USD Billion) Trend Analysis By Market Taxonomy, 2021 to 2025
- Market Size Value (USD Billion) Forecast By Market Taxonomy, 2026 to 2036
- By Country
- India
- ASEAN
- Australia and New Zealand
- By Generation
- By Workload
- By Deployment
- By Customer Type
- By Country
- Market Attractiveness Analysis
- By Country
- By Generation
- By Workload
- By Deployment
- By Customer Type
- Key Takeaways
- Middle East and Africa Market Analysis and Forecast, By Country, 2021 to 2036
- Historical Market Size Value (USD Billion) Trend Analysis By Market Taxonomy, 2021 to 2025
- Market Size Value (USD Billion) Forecast By Market Taxonomy, 2026 to 2036
- By Country
- GCC Countries
- South Africa
- Türkiye
- Israel
- By Generation
- By Workload
- By Deployment
- By Customer Type
- By Country
- Market Attractiveness Analysis
- By Country
- By Generation
- By Workload
- By Deployment
- By Customer Type
- Key Takeaways
- Key Countries Market Analysis
- United States
- Pricing Analysis
- Market Share Analysis, 2025
- By Generation
- By Workload
- By Deployment
- By Customer Type
- Canada
- Pricing Analysis
- Market Share Analysis, 2025
- By Generation
- By Workload
- By Deployment
- By Customer Type
- Brazil
- Pricing Analysis
- Market Share Analysis, 2025
- By Generation
- By Workload
- By Deployment
- By Customer Type
- Mexico
- Pricing Analysis
- Market Share Analysis, 2025
- By Generation
- By Workload
- By Deployment
- By Customer Type
- Argentina
- Pricing Analysis
- Market Share Analysis, 2025
- By Generation
- By Workload
- By Deployment
- By Customer Type
- Chile
- Pricing Analysis
- Market Share Analysis, 2025
- By Generation
- By Workload
- By Deployment
- By Customer Type
- Germany
- Pricing Analysis
- Market Share Analysis, 2025
- By Generation
- By Workload
- By Deployment
- By Customer Type
- France
- Pricing Analysis
- Market Share Analysis, 2025
- By Generation
- By Workload
- By Deployment
- By Customer Type
- United Kingdom
- Pricing Analysis
- Market Share Analysis, 2025
- By Generation
- By Workload
- By Deployment
- By Customer Type
- Italy
- Pricing Analysis
- Market Share Analysis, 2025
- By Generation
- By Workload
- By Deployment
- By Customer Type
- Spain
- Pricing Analysis
- Market Share Analysis, 2025
- By Generation
- By Workload
- By Deployment
- By Customer Type
- Benelux
- Pricing Analysis
- Market Share Analysis, 2025
- By Generation
- By Workload
- By Deployment
- By Customer Type
- Nordics
- Pricing Analysis
- Market Share Analysis, 2025
- By Generation
- By Workload
- By Deployment
- By Customer Type
- Poland
- Pricing Analysis
- Market Share Analysis, 2025
- By Generation
- By Workload
- By Deployment
- By Customer Type
- Czech Republic
- Pricing Analysis
- Market Share Analysis, 2025
- By Generation
- By Workload
- By Deployment
- By Customer Type
- Romania
- Pricing Analysis
- Market Share Analysis, 2025
- By Generation
- By Workload
- By Deployment
- By Customer Type
- Hungary
- Pricing Analysis
- Market Share Analysis, 2025
- By Generation
- By Workload
- By Deployment
- By Customer Type
- China
- Pricing Analysis
- Market Share Analysis, 2025
- By Generation
- By Workload
- By Deployment
- By Customer Type
- Japan
- Pricing Analysis
- Market Share Analysis, 2025
- By Generation
- By Workload
- By Deployment
- By Customer Type
- South Korea
- Pricing Analysis
- Market Share Analysis, 2025
- By Generation
- By Workload
- By Deployment
- By Customer Type
- India
- Pricing Analysis
- Market Share Analysis, 2025
- By Generation
- By Workload
- By Deployment
- By Customer Type
- ASEAN
- Pricing Analysis
- Market Share Analysis, 2025
- By Generation
- By Workload
- By Deployment
- By Customer Type
- Australia and New Zealand
- Pricing Analysis
- Market Share Analysis, 2025
- By Generation
- By Workload
- By Deployment
- By Customer Type
- GCC Countries
- Pricing Analysis
- Market Share Analysis, 2025
- By Generation
- By Workload
- By Deployment
- By Customer Type
- South Africa
- Pricing Analysis
- Market Share Analysis, 2025
- By Generation
- By Workload
- By Deployment
- By Customer Type
- Türkiye
- Pricing Analysis
- Market Share Analysis, 2025
- By Generation
- By Workload
- By Deployment
- By Customer Type
- Israel
- Pricing Analysis
- Market Share Analysis, 2025
- By Generation
- By Workload
- By Deployment
- By Customer Type
- United States
- Market Structure Analysis
- Competition Dashboard
- Competition Benchmarking
- Market Share Analysis of Top Players
- By Region
- By Generation
- By Workload
- By Deployment
- By Customer Type
- Emerging Startups
- Innovation Benchmarking
- Competition Analysis
- Competition Deep Dive
- Google
- Overview
- Product Portfolio
- Profitability by Market Segments
- Sales Footprint
- Strategy Overview
- Marketing Strategy
- Product Strategy
- Channel Strategy
- Broadcom
- MediaTek
- TSMC
- Google
- Case Studies
- Success Stories
- Recent Developments
- Competition Deep Dive
- Assumptions & Acronyms Used
List of Tables
- Table 1: Global Market Value (USD Billion) Forecast by Region, 2021 to 2036
- Table 2: Global Market Value (USD Billion) Forecast by Generation, 2021 to 2036
- Table 3: Global Market Value (USD Billion) Forecast by Workload, 2021 to 2036
- Table 4: Global Market Value (USD Billion) Forecast by Deployment, 2021 to 2036
- Table 5: Global Market Value (USD Billion) Forecast by Customer Type, 2021 to 2036
- Table 6: North America Market Value (USD Billion) Forecast by Country, 2021 to 2036
- Table 7: North America Market Value (USD Billion) Forecast by Generation, 2021 to 2036
- Table 8: North America Market Value (USD Billion) Forecast by Workload, 2021 to 2036
- Table 9: North America Market Value (USD Billion) Forecast by Deployment, 2021 to 2036
- Table 10: North America Market Value (USD Billion) Forecast by Customer Type, 2021 to 2036
- Table 11: Latin America Market Value (USD Billion) Forecast by Country, 2021 to 2036
- Table 12: Latin America Market Value (USD Billion) Forecast by Generation, 2021 to 2036
- Table 13: Latin America Market Value (USD Billion) Forecast by Workload, 2021 to 2036
- Table 14: Latin America Market Value (USD Billion) Forecast by Deployment, 2021 to 2036
- Table 15: Latin America Market Value (USD Billion) Forecast by Customer Type, 2021 to 2036
- Table 16: Western Europe Market Value (USD Billion) Forecast by Country, 2021 to 2036
- Table 17: Western Europe Market Value (USD Billion) Forecast by Generation, 2021 to 2036
- Table 18: Western Europe Market Value (USD Billion) Forecast by Workload, 2021 to 2036
- Table 19: Western Europe Market Value (USD Billion) Forecast by Deployment, 2021 to 2036
- Table 20: Western Europe Market Value (USD Billion) Forecast by Customer Type, 2021 to 2036
- Table 21: Eastern Europe Market Value (USD Billion) Forecast by Country, 2021 to 2036
- Table 22: Eastern Europe Market Value (USD Billion) Forecast by Generation, 2021 to 2036
- Table 23: Eastern Europe Market Value (USD Billion) Forecast by Workload, 2021 to 2036
- Table 24: Eastern Europe Market Value (USD Billion) Forecast by Deployment, 2021 to 2036
- Table 25: Eastern Europe Market Value (USD Billion) Forecast by Customer Type, 2021 to 2036
- Table 26: East Asia Market Value (USD Billion) Forecast by Country, 2021 to 2036
- Table 27: East Asia Market Value (USD Billion) Forecast by Generation, 2021 to 2036
- Table 28: East Asia Market Value (USD Billion) Forecast by Workload, 2021 to 2036
- Table 29: East Asia Market Value (USD Billion) Forecast by Deployment, 2021 to 2036
- Table 30: East Asia Market Value (USD Billion) Forecast by Customer Type, 2021 to 2036
- Table 31: South Asia and Pacific Market Value (USD Billion) Forecast by Country, 2021 to 2036
- Table 32: South Asia and Pacific Market Value (USD Billion) Forecast by Generation, 2021 to 2036
- Table 33: South Asia and Pacific Market Value (USD Billion) Forecast by Workload, 2021 to 2036
- Table 34: South Asia and Pacific Market Value (USD Billion) Forecast by Deployment, 2021 to 2036
- Table 35: South Asia and Pacific Market Value (USD Billion) Forecast by Customer Type, 2021 to 2036
- Table 36: Middle East and Africa Market Value (USD Billion) Forecast by Country, 2021 to 2036
- Table 37: Middle East and Africa Market Value (USD Billion) Forecast by Generation, 2021 to 2036
- Table 38: Middle East and Africa Market Value (USD Billion) Forecast by Workload, 2021 to 2036
- Table 39: Middle East and Africa Market Value (USD Billion) Forecast by Deployment, 2021 to 2036
- Table 40: Middle East and Africa Market Value (USD Billion) Forecast by Customer Type, 2021 to 2036
List of Figures
- Figure 1: Global Market Pricing Analysis
- Figure 2: Global Market Value (USD Billion) Forecast 2021-2036
- Figure 3: Global Market Value Share and BPS Analysis by Generation, 2026 and 2036
- Figure 4: Global Market Y-o-Y Growth Comparison by Generation, 2026-2036
- Figure 5: Global Market Attractiveness Analysis by Generation
- Figure 6: Global Market Value Share and BPS Analysis by Workload, 2026 and 2036
- Figure 7: Global Market Y-o-Y Growth Comparison by Workload, 2026-2036
- Figure 8: Global Market Attractiveness Analysis by Workload
- Figure 9: Global Market Value Share and BPS Analysis by Deployment, 2026 and 2036
- Figure 10: Global Market Y-o-Y Growth Comparison by Deployment, 2026-2036
- Figure 11: Global Market Attractiveness Analysis by Deployment
- Figure 12: Global Market Value Share and BPS Analysis by Customer Type, 2026 and 2036
- Figure 13: Global Market Y-o-Y Growth Comparison by Customer Type, 2026-2036
- Figure 14: Global Market Attractiveness Analysis by Customer Type
- Figure 15: Global Market Value (USD Billion) Share and BPS Analysis by Region, 2026 and 2036
- Figure 16: Global Market Y-o-Y Growth Comparison by Region, 2026-2036
- Figure 17: Global Market Attractiveness Analysis by Region
- Figure 18: North America Market Incremental Dollar Opportunity, 2026-2036
- Figure 19: Latin America Market Incremental Dollar Opportunity, 2026-2036
- Figure 20: Western Europe Market Incremental Dollar Opportunity, 2026-2036
- Figure 21: Eastern Europe Market Incremental Dollar Opportunity, 2026-2036
- Figure 22: East Asia Market Incremental Dollar Opportunity, 2026-2036
- Figure 23: South Asia and Pacific Market Incremental Dollar Opportunity, 2026-2036
- Figure 24: Middle East and Africa Market Incremental Dollar Opportunity, 2026-2036
- Figure 25: North America Market Value Share and BPS Analysis by Country, 2026 and 2036
- Figure 26: North America Market Value Share and BPS Analysis by Generation, 2026 and 2036
- Figure 27: North America Market Y-o-Y Growth Comparison by Generation, 2026-2036
- Figure 28: North America Market Attractiveness Analysis by Generation
- Figure 29: North America Market Value Share and BPS Analysis by Workload, 2026 and 2036
- Figure 30: North America Market Y-o-Y Growth Comparison by Workload, 2026-2036
- Figure 31: North America Market Attractiveness Analysis by Workload
- Figure 32: North America Market Value Share and BPS Analysis by Deployment, 2026 and 2036
- Figure 33: North America Market Y-o-Y Growth Comparison by Deployment, 2026-2036
- Figure 34: North America Market Attractiveness Analysis by Deployment
- Figure 35: North America Market Value Share and BPS Analysis by Customer Type, 2026 and 2036
- Figure 36: North America Market Y-o-Y Growth Comparison by Customer Type, 2026-2036
- Figure 37: North America Market Attractiveness Analysis by Customer Type
- Figure 38: Latin America Market Value Share and BPS Analysis by Country, 2026 and 2036
- Figure 39: Latin America Market Value Share and BPS Analysis by Generation, 2026 and 2036
- Figure 40: Latin America Market Y-o-Y Growth Comparison by Generation, 2026-2036
- Figure 41: Latin America Market Attractiveness Analysis by Generation
- Figure 42: Latin America Market Value Share and BPS Analysis by Workload, 2026 and 2036
- Figure 43: Latin America Market Y-o-Y Growth Comparison by Workload, 2026-2036
- Figure 44: Latin America Market Attractiveness Analysis by Workload
- Figure 45: Latin America Market Value Share and BPS Analysis by Deployment, 2026 and 2036
- Figure 46: Latin America Market Y-o-Y Growth Comparison by Deployment, 2026-2036
- Figure 47: Latin America Market Attractiveness Analysis by Deployment
- Figure 48: Latin America Market Value Share and BPS Analysis by Customer Type, 2026 and 2036
- Figure 49: Latin America Market Y-o-Y Growth Comparison by Customer Type, 2026-2036
- Figure 50: Latin America Market Attractiveness Analysis by Customer Type
- Figure 51: Western Europe Market Value Share and BPS Analysis by Country, 2026 and 2036
- Figure 52: Western Europe Market Value Share and BPS Analysis by Generation, 2026 and 2036
- Figure 53: Western Europe Market Y-o-Y Growth Comparison by Generation, 2026-2036
- Figure 54: Western Europe Market Attractiveness Analysis by Generation
- Figure 55: Western Europe Market Value Share and BPS Analysis by Workload, 2026 and 2036
- Figure 56: Western Europe Market Y-o-Y Growth Comparison by Workload, 2026-2036
- Figure 57: Western Europe Market Attractiveness Analysis by Workload
- Figure 58: Western Europe Market Value Share and BPS Analysis by Deployment, 2026 and 2036
- Figure 59: Western Europe Market Y-o-Y Growth Comparison by Deployment, 2026-2036
- Figure 60: Western Europe Market Attractiveness Analysis by Deployment
- Figure 61: Western Europe Market Value Share and BPS Analysis by Customer Type, 2026 and 2036
- Figure 62: Western Europe Market Y-o-Y Growth Comparison by Customer Type, 2026-2036
- Figure 63: Western Europe Market Attractiveness Analysis by Customer Type
- Figure 64: Eastern Europe Market Value Share and BPS Analysis by Country, 2026 and 2036
- Figure 65: Eastern Europe Market Value Share and BPS Analysis by Generation, 2026 and 2036
- Figure 66: Eastern Europe Market Y-o-Y Growth Comparison by Generation, 2026-2036
- Figure 67: Eastern Europe Market Attractiveness Analysis by Generation
- Figure 68: Eastern Europe Market Value Share and BPS Analysis by Workload, 2026 and 2036
- Figure 69: Eastern Europe Market Y-o-Y Growth Comparison by Workload, 2026-2036
- Figure 70: Eastern Europe Market Attractiveness Analysis by Workload
- Figure 71: Eastern Europe Market Value Share and BPS Analysis by Deployment, 2026 and 2036
- Figure 72: Eastern Europe Market Y-o-Y Growth Comparison by Deployment, 2026-2036
- Figure 73: Eastern Europe Market Attractiveness Analysis by Deployment
- Figure 74: Eastern Europe Market Value Share and BPS Analysis by Customer Type, 2026 and 2036
- Figure 75: Eastern Europe Market Y-o-Y Growth Comparison by Customer Type, 2026-2036
- Figure 76: Eastern Europe Market Attractiveness Analysis by Customer Type
- Figure 77: East Asia Market Value Share and BPS Analysis by Country, 2026 and 2036
- Figure 78: East Asia Market Value Share and BPS Analysis by Generation, 2026 and 2036
- Figure 79: East Asia Market Y-o-Y Growth Comparison by Generation, 2026-2036
- Figure 80: East Asia Market Attractiveness Analysis by Generation
- Figure 81: East Asia Market Value Share and BPS Analysis by Workload, 2026 and 2036
- Figure 82: East Asia Market Y-o-Y Growth Comparison by Workload, 2026-2036
- Figure 83: East Asia Market Attractiveness Analysis by Workload
- Figure 84: East Asia Market Value Share and BPS Analysis by Deployment, 2026 and 2036
- Figure 85: East Asia Market Y-o-Y Growth Comparison by Deployment, 2026-2036
- Figure 86: East Asia Market Attractiveness Analysis by Deployment
- Figure 87: East Asia Market Value Share and BPS Analysis by Customer Type, 2026 and 2036
- Figure 88: East Asia Market Y-o-Y Growth Comparison by Customer Type, 2026-2036
- Figure 89: East Asia Market Attractiveness Analysis by Customer Type
- Figure 90: South Asia and Pacific Market Value Share and BPS Analysis by Country, 2026 and 2036
- Figure 91: South Asia and Pacific Market Value Share and BPS Analysis by Generation, 2026 and 2036
- Figure 92: South Asia and Pacific Market Y-o-Y Growth Comparison by Generation, 2026-2036
- Figure 93: South Asia and Pacific Market Attractiveness Analysis by Generation
- Figure 94: South Asia and Pacific Market Value Share and BPS Analysis by Workload, 2026 and 2036
- Figure 95: South Asia and Pacific Market Y-o-Y Growth Comparison by Workload, 2026-2036
- Figure 96: South Asia and Pacific Market Attractiveness Analysis by Workload
- Figure 97: South Asia and Pacific Market Value Share and BPS Analysis by Deployment, 2026 and 2036
- Figure 98: South Asia and Pacific Market Y-o-Y Growth Comparison by Deployment, 2026-2036
- Figure 99: South Asia and Pacific Market Attractiveness Analysis by Deployment
- Figure 100: South Asia and Pacific Market Value Share and BPS Analysis by Customer Type, 2026 and 2036
- Figure 101: South Asia and Pacific Market Y-o-Y Growth Comparison by Customer Type, 2026-2036
- Figure 102: South Asia and Pacific Market Attractiveness Analysis by Customer Type
- Figure 103: Middle East and Africa Market Value Share and BPS Analysis by Country, 2026 and 2036
- Figure 104: Middle East and Africa Market Value Share and BPS Analysis by Generation, 2026 and 2036
- Figure 105: Middle East and Africa Market Y-o-Y Growth Comparison by Generation, 2026-2036
- Figure 106: Middle East and Africa Market Attractiveness Analysis by Generation
- Figure 107: Middle East and Africa Market Value Share and BPS Analysis by Workload, 2026 and 2036
- Figure 108: Middle East and Africa Market Y-o-Y Growth Comparison by Workload, 2026-2036
- Figure 109: Middle East and Africa Market Attractiveness Analysis by Workload
- Figure 110: Middle East and Africa Market Value Share and BPS Analysis by Deployment, 2026 and 2036
- Figure 111: Middle East and Africa Market Y-o-Y Growth Comparison by Deployment, 2026-2036
- Figure 112: Middle East and Africa Market Attractiveness Analysis by Deployment
- Figure 113: Middle East and Africa Market Value Share and BPS Analysis by Customer Type, 2026 and 2036
- Figure 114: Middle East and Africa Market Y-o-Y Growth Comparison by Customer Type, 2026-2036
- Figure 115: Middle East and Africa Market Attractiveness Analysis by Customer Type
- Figure 116: Global Market - Tier Structure Analysis
- Figure 117: Global Market - Company Share Analysis
Frequently Asked Questions
How big is the Tensor Processing Unit Market in 2026?
Future Market Insights estimates the global tensor processing unit market at USD 15.6 billion in 2026 and projects it to reach USD 134.1 billion by 2036.
How fast is the Tensor Processing Unit Market expected to grow through 2036?
FMI projects the market to expand at a 24.0% CAGR from 2026 to 2036, reflecting rising adoption of specialized computing hardware for artificial intelligence workloads.
Which generation leads the Tensor Processing Unit Market?
V7 and later generations lead the generation segment with a 50.0% share, reflecting the growing role of newer TPU architectures in advanced AI computing.
Which workload accounts for the largest share of the Tensor Processing Unit Market?
Large-scale inference leads the workload segment with a 46.0% share, supported by increasing requirements for running AI models across large-scale applications.
Which country is expected to record the fastest growth in the Tensor Processing Unit Market?
Japan is projected to record the fastest growth at a 24.9% CAGR from 2026 to 2036, followed by the UK at 24.1% and Singapore at 24.0%.
Who are the leading players in the Tensor Processing Unit Market?
Key players in the tensor processing unit market include Google, Broadcom, MediaTek, and TSMC.
Preview the report firsthand - request a free sample
Get SampleGet the brochure for pricing and purchase details.
Get PDF
