

- Market Size (2026)
- USD 760.6 Mn
- Forecast (2036)
- USD 1336.6 Mn
- CAGR (2026 to 2036)
- 5.8%
How big is the Toe Control Links Market in 2026?
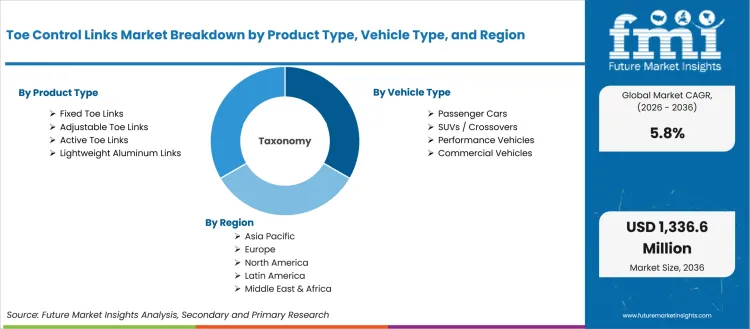
USD 760.6 million in 2026 and USD 1,336.6 million by 2036 at a 5.8% CAGR.
Rear axle geometry has become a more visible purchasing issue for vehicle makers and repair channels. Electrified platforms and crossover bodies add load to suspension links. Wheel-angle stability now affects tire wear and service liability. OICA reported in April 2026 that global vehicle production reached 96.4 million units in 2025. That output base keeps toe control links tied to OEM programs, but recall activity has made fitment accuracy and corrosion performance part of the buying discussion.
OEM chassis teams and tier suppliers evaluate toe control links from the platform side. Aftermarket distributors and collision repair networks assess fitment from service needs. Vehicle engineers prioritize fatigue strength and platform validation. Workshops focus on correct geometry after impact repair and suspension service. The buyer case is reinforced by adjacent automotive suspension systems. Suppliers that provide predictable fitment and clear service guidance can reduce warranty exposure for customers.
Established regions link demand to platform renewal and the repair base. High-growth countries add volume pull from passenger cars and utility vehicles. Electrified models add a second volume layer. Toe control links gain value once they connect material choice and axle design. Service instructions and quality records complete the buyer case. The same logic appears in automotive electric drivetrain components. Higher vehicle mass changes the engineering burden carried by surrounding chassis parts. Buyers therefore treat toe links like safety-relevant alignment hardware instead of low-visibility suspension stock.
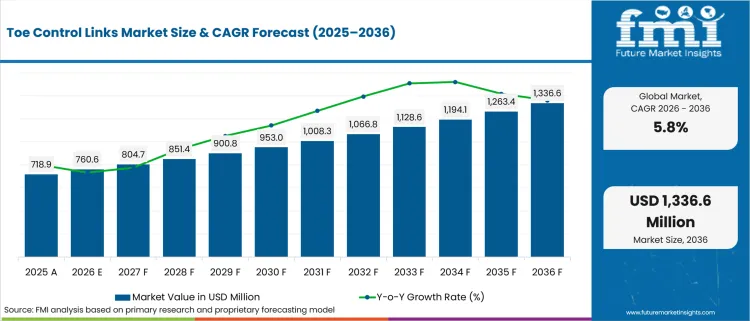
| Metric | Value |
|---|---|
| 2025 Market Size | USD 718.9 million |
| 2026 Market Size | USD 760.6 million |
| 2036 Market Size | USD 1,336.6 million |
| Forecast CAGR (2026-2036) | 5.8% |
| Product Type Focus | Fixed Toe Links |
| Fixed Toe Links Share (2026) | 48.0% |
| Vehicle Type Focus | Passenger Cars |
| Passenger Cars Share (2026) | 56.0% |
| Material Focus | Steel |
| Steel Share (2026) | 62.0% |
| Fastest-growing Country | China |
| China CAGR by 2036 | 6.9% |
Summary of the Toe Control Links Market
| Market Signal | Commercial Impact |
|---|---|
| Demand and Growth Drivers | Demand for toe control links is increasing as global vehicle production, electrified platforms, and SUV ownership expand OEM sourcing opportunities and aftermarket replacement requirements.
|
| Product and Segment View | Fixed toe links, passenger cars, and steel materials continue to dominate commercial demand across global vehicle platforms.
|
| Geography and Growth Outlook | Asia remains the primary growth engine for toe control links, while the United States continues to generate demand through aftermarket replacement and vehicle service activity.
|
| Competitive Landscape | Competition increasingly centers on chassis engineering capability, manufacturing quality, and aftermarket service support rather than component pricing alone.
|
| Analyst Perspective | Toe control links are evolving into increasingly important chassis components where durability, alignment accuracy, corrosion protection, and service support influence purchasing decisions across OEM and aftermarket channels.
- Nikhil Kaitwade, Principal Consultant at Future Market Insights |
How is the toe control links market segmented?
The Toe Control Links industry is segmented by product type, vehicle type, material, suspension type, sales channel, and region.
The toe control links market is segmented by product type, vehicle type, material, suspension type, sales channel, and region. Product type covers fixed toe links, adjustable toe links, active toe links, and lightweight aluminum links. Vehicle type includes passenger cars, SUVs / Crossovers, performance vehicles, and commercial vehicles. Material spans steel, aluminum, forged / cast alloy, and composite / other formats. Suspension type covers multi-link suspension, independent rear suspension, and performance / adaptive suspension. Sales channel includes OEM and aftermarket routes. Regional coverage extends across North America, Latin America, Europe, East Asia, South Asia and Pacific, and the Middle East and Africa.
Why do fixed toe links matter within the product type category?
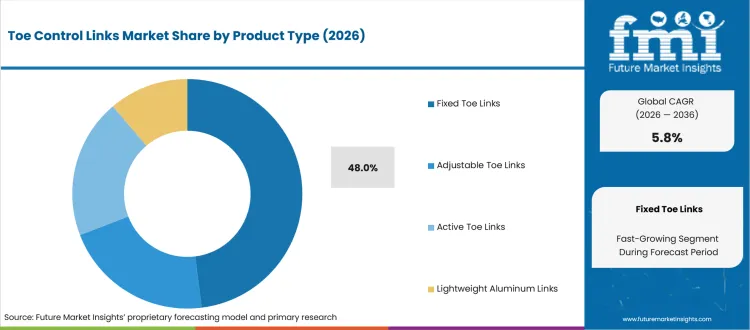
High-volume platforms need rear geometry that can be validated once and repeated across production runs. Fixed toe links address that need by removing adjustment points that can add service variation. This makes the segment relevant for OEMs that balance part cost and assembly time. Long-term alignment stability reinforces the selection case.
- In 2026, fixed toe links are anticipated to hold 48.0% of product type demand, driven by OEM preference for locked geometry on high-volume models. Benteler states that its chassis component scope includes axle carriers and subframes. The same scope covers control arms and knuckles, which supports sourcing trust.
- The buyer value is repeatability across assembly and service. Vehicle makers can reduce calibration burden, and repair networks can replace the part without changing the intended rear toe setting after routine suspension work or impact repair.
What supports demand from passenger cars?
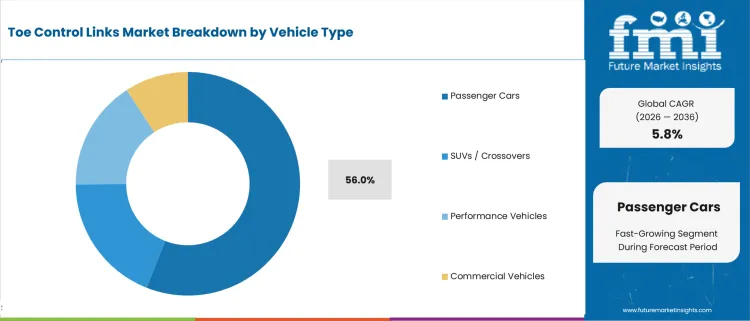
Passenger car platforms create steady demand due to broad production volume and frequent use of rear independent suspension layouts. Compact and midsize models need wheel control that protects tire wear and ride stability without adding active steering cost. This keeps mechanical toe links relevant in everyday platforms.
- Passenger cars are expected to account for 56.0% share in 2026, supported by broad fitment across compact and midsize vehicle programs. OICA listed Japan at 7.16 million passenger cars produced in 2025, showing why large car-producing countries still matter for toe-link supply.
- Procurement teams benefit from a component that can serve multiple trims and regional variants. Standardized toe links help control inventory complexity, and common service parts reduce confusion across dealer and independent repair channels.
How is steel positioned within the material category?
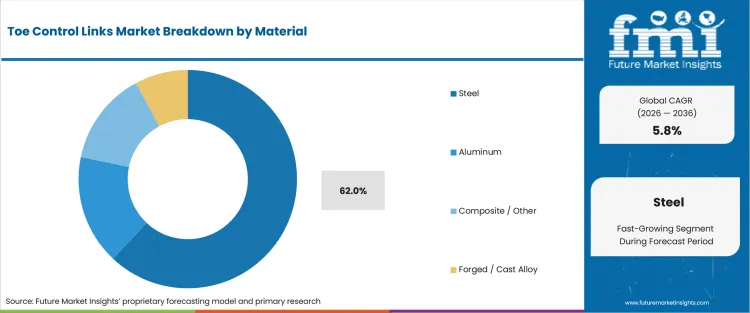
The material decision is tied to fatigue strength and corrosion exposure. Forming cost and weight targets shape the final choice. Steel remains practical for mass-market vehicles due to familiar forming routes and predictable load handling. Aluminum and composites gain attention only after the buyer justifies higher validation and joining complexity.
- Steel is projected to account for 62.0% share in 2026, attributable to fatigue strength and cost control in volume programs. thyssenkrupp notes that modern chassis technology uses ultra-high-strength steels for control arms and springs. Stabilizer applications also support steel relevance in load-bearing programs.
- Engineering teams using steel can manage durability targets without shifting the surrounding knuckle and bushing design. Subframe compatibility supports continuity. That continuity helps suppliers defend cost and warranty performance across long-running rear suspension architectures.
What makes multi-link suspension a relevant suspension type?
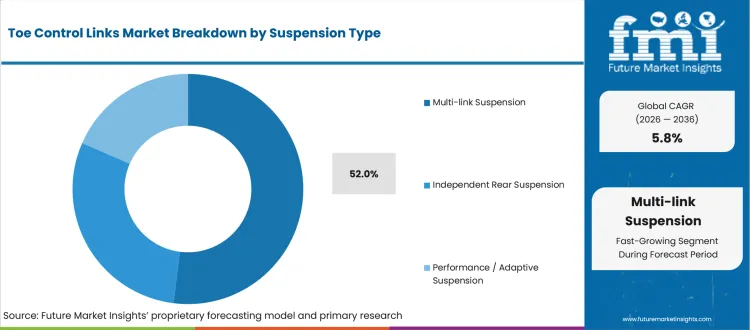
Multi-link rear axles separate wheel-control functions across several arms and links. This creates a specific role for toe control links in managing wheel angle during braking and cornering. Load transfer adds another design pressure. The segment matters more on vehicles that sell comfort and tire life. Stable handling completes the buyer value case.
- Multi-link suspension is projected to hold 52.0% of suspension type demand in 2026, shaped by the need to control toe change under varied road loads. Schaeffler lists rear-wheel steering and active chassis applications in its chassis systems scope, which illustrates the move toward more controlled rear axle behavior.
- The executive case for multi-link fitment is ride quality tied to serviceability. Buyers can offer better rear wheel control, and workshops can isolate toe-link replacement instead of replacing a complete suspension module.
How does OEM buying shape the sales channel?
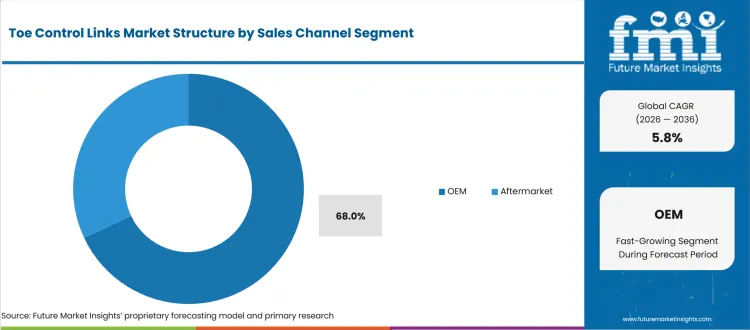
Toe control links are usually approved during vehicle platform design before late-stage accessory buying. OEM purchasing therefore controls much of the early market value. The aftermarket gains relevance later after collision repair and corrosion findings. Alignment complaints also create replacement demand.
- OEM is projected to represent 68.0% of sales channel demand in 2026, led by platform contracts that define geometry and process records. Validation standards reinforce the channel position. This pattern also appears in the automotive actuator market. Early design approval shapes supplier access to chassis-control content.
- For aftermarket buyers, the priority is fitment confidence and clear repair support. Distribution programs tied to non-OEM EV MRO demand can serve workshops that need OE-equivalent geometry after suspension service on newer electrified platforms.
What are the drivers, restraints, and opportunities in the toe control links market?
Near-term purchases are being shaped by axle-load pressure, service-procedure risk, and aftermarket fitment expansion outlined below.
- Driver: Heavier EV and SUV platforms are driving supplier spending on stronger toe-link validation and tighter rear-geometry control.
- Restraint: Service procedure errors restrain adoption of low-support parts due to higher liability after suspension repair.
- Opportunity: Aftermarket programs gain traction from replacement demand for workshops that need OE-equivalent fitment and clear instructions.
EV and SUV buyers are placing more attention on rear axle durability. ACEA data showed 1.88 million new battery-electric cars registered in the EU in 2025. That figure matters for toe control links due to higher platform mass and tire-cost exposure. Suppliers that connect material validation to load-cycle evidence can defend OEM approval and service-channel confidence.
Repair networks can turn a restraint into a supplier advantage. Rivian recall 26V003 covered 19,641 vehicles that may have received service using an older rear toe-link procedure. This issue is not only a defect question. It shows why workshops need documented torque steps and updated service kits. Parts that reduce reassembly ambiguity become more valuable.
Aftermarket access is expected to improve for suppliers that package fitment data and coverage breadth. ZF Aftermarket announced more than 130 new TRW chassis parts in February 2025, expanding coverage to 29 million additional vehicles in operation. That type of program supports automotive aftermarket demand by giving workshops more OE-quality options for suspension repair.
Which country CAGRs are profiled in the toe control links market?
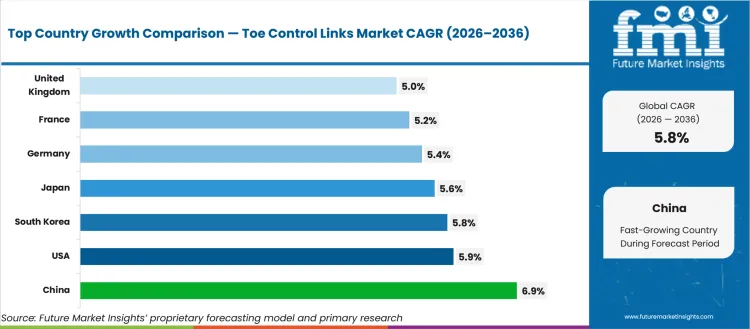
| Country | CAGR |
|---|---|
| United States | 5.9% |
| United Kingdom | 5.0% |
| Germany | 5.4% |
| France | 5.2% |
| Japan | 5.6% |
| China | 6.9% |
| South Korea | 5.8% |
| India | 6.5% |
How do country-level CAGRs compare in the toe control links market?
Country CAGR profiles should be read against vehicle build scale and suspension complexity. Repair-channel visibility adds another comparison layer. Established markets are tied to SUV repair density and premium chassis programs. Warranty procedures shape the service side of demand. High-growth markets add stronger volume pull from utility vehicles and electrified platforms. This comparison helps buyers identify sourcing regions that need high-volume mechanical links. It also separates premium rear-axle control demand from aftermarket support needs. The same evaluation applies to automotive performance part demand. Fitment quality and service evidence influence buyer confidence.
- By 2036 the United States is projected to record 5.9% CAGR, supported by SUV repair volume and a large light-truck base. OICA listed the United States at 5.68 million commercial vehicles produced in 2025. That scale differs from passenger-car-heavy markets and keeps rear suspension service demand visible to distributors and workshops.
- The United Kingdom is expected to grow at 5.0% CAGR during the forecast period, owing to a smaller production base and export-led assembly profile. SMMT reported 208,088 vehicles built in the first quarter of 2026. The country profile is more tied to premium platforms and service networks. Imported replacement parts matter more than domestic volume scale.
- Germany is forecast to advance at 5.4% CAGR over the assessment period, driven by premium EV output and chassis engineering depth. VDA reported that domestic electric passenger car production expanded to 1.22 million vehicles in 2025. Germany therefore reflects an engineering-led market profile instead of a pure replacement-volume profile.
- France is anticipated to post 5.2% CAGR by 2036, supported by renewed local vehicle production and European platform allocation. PFA data carried by OICA showed French vehicle production at 1.464 million units in 2025. The profile is meaningful for suppliers that serve mixed OEM and European service programs.
- Japan is likely to expand at 5.6% CAGR by 2036, shaped by high-quality production systems and established compact vehicle platforms. The USA International Trade Administration reported 4.42 million new passenger vehicles sold in Japan in 2024. This profile points to steady demand for validated parts instead of abrupt platform churn.
- China is estimated to rise at 6.9% CAGR between 2026 and 2036, led by electric platform scale and dense local sourcing. The National Bureau of Statistics of China reported new energy vehicle output of 16.524 million units in 2025. China therefore differs from other markets due to its combined volume and electrification pull.
- South Korea is projected to record 5.8% CAGR by 2036, reinforced by export-oriented production and EV program renewal. MOTIR reported first-quarter automobile production of 1.026 million units in 2026. This makes South Korea relevant for suppliers that can meet OEM quality needs across export programs and local chassis platforms.
- India is expected to grow at 6.5% CAGR from 2026 to 2036, attributable to passenger vehicle scale and utility vehicle demand. SIAM reported passenger vehicle sales of 4.3 million units in FY 2024-25. India reflects a volume-growth market profile that needs cost-controlled parts and expanding aftermarket coverage.
Who are the notable companies in the toe control links market?
ZF, Magna, Benteler, Schaeffler, Gestamp, thyssenkrupp, Mubea, Futaba Industrial, Mevotech and Autokiniton are the notable companies shaping this market.
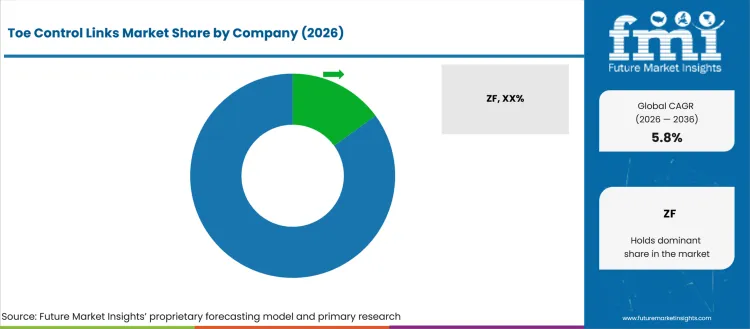
Competition is structured around the level of the chassis system that the buyer wants to solve. ZF and Mevotech are more relevant to aftermarket replacement and workshop fitment. Magna and Benteler become important in formed-metal chassis structures. Gestamp and thyssenkrupp support related structural programs. Autokiniton adds related assembly capability. Schaeffler and Mubea gain relevance in active chassis and lightweight component directions. Futaba Industrial is better suited to Japanese OEM supply links. Online parts discovery and automotive e-tailing also influence aftermarket reach, especially for fitment-sensitive replacement parts.
- Aftermarket-focused suppliers including ZF and Mevotech address buyers that need fitment breadth and catalog clarity. Workshop confidence shapes repeat purchasing. ZF Aftermarket says a car may have up to 70 chassis components. That scope explains the value of complete steering and suspension coverage.
- Magna and Benteler are relevant for OEM buyers that need formed-metal engineering across suspension arms and carriers. Adjacent axle structures widen their fit. Magna points to hydroforming and stamping capability across chassis systems. Benteler lists chassis components including control arms and knuckles.
- Schaeffler and Mubea compete closer to controlled rear axle behavior and lightweight chassis design. Schaeffler offers rear-wheel steering and active chassis applications. Mubea lists steel and GRP stabilizer bar links. Hybrid variants support lightweight suspension component programs.
- Gestamp and thyssenkrupp gain relevance in regional OEM supply chains. Futaba Industrial and Autokiniton support related component programs. Their role is tied to metal components and body structures. Chassis assembly discipline can support validated toe-link-adjacent production programs.
Competitive Benchmarking: Toe Control Links Market
| Company | Toe Geometry Fit | Metal Forming Depth | Aftermarket Access | Geographic Reach |
|---|---|---|---|---|
| ZF | High | Medium | High | Global |
| Magna | High | High | Medium | Global |
| Benteler | High | High | Medium | Global |
| Schaeffler | Medium | Medium | Medium | Global |
| Gestamp | Medium | High | Low | Global |
| thyssenkrupp | Medium | High | Low | Global |
| Mubea | Medium | Medium | Medium | Europe |
| Futaba Industrial | Medium | Medium | Low | Japan |
| Mevotech | Medium | Medium | High | North America |
| Autokiniton | Medium | High | Low | North America |
Source: Future Market Insights competitive analysis, 2026. Ratings reflect relative portfolio relevance and workflow fit. Service capability and geographic reach shape the comparison.
Key Developments in the Toe Control Links Market
- In February 2025, ZF Aftermarket added more than 130 new parts to its TRW chassis portfolio. The action expanded North American coverage for control arms and ball joints. Related tie-rod products added adjacent repair reach. It matters to toe control links due to broader workshop access for OE-quality chassis replacements.
- In July 2025, Schaeffler announced successful production launch of its rear-wheel steering system for a German OEM. The development matters to the market due to active rear axle control and higher attention on toe behavior. It also affects actuator packaging and chassis-level validation.
Key Players in the Toe Control Links Market
Global Chassis System Suppliers
- ZF
- Magna
- Benteler
- Schaeffler
Metal Forming and Structure Specialists
- Gestamp
- thyssenkrupp
- Autokiniton
Lightweight and Regional Component Suppliers
- Mubea
- Futaba Industrial
Aftermarket Fitment Specialists
- Mevotech
Toe Control Links Market - Report Scope
| Coverage field | Report scope |
|---|---|
| Market breakdown | Toe Control Links Market Breakdown By Product Type, Vehicle Type, Material, Suspension Type, Sales Channel, and Region |
| Market Definition | Suspension links that control rear wheel toe angle during braking, cornering, loading, and repair-sensitive service events |
| Regions Covered | North America, Latin America, Europe, East Asia, South Asia and Pacific, Middle East and Africa |
| Countries Covered | United States, United Kingdom, Germany, France, Japan, China, South Korea, India and broader regional coverage |
| Key Companies Profiled | ZF, Magna, Benteler, Schaeffler, Gestamp, thyssenkrupp, Mubea, Futaba Industrial, Mevotech, Autokiniton |
| Forecast Period | 2026 to 2036 |
| Approach | Hybrid bottom-up and top-down methodology using vehicle production, suspension mix, replacement rates, material selection, and country demand signals |
Toe Control Links Market - Research Methodology
| Method | Approach |
|---|---|
| Primary Research | FMI analysts reviewed inputs from chassis suppliers, aftermarket distributors, workshop networks, vehicle platform engineers, and repair-channel participants. Discussions covered fitment logic, material choice, service failures, validation needs, and buyer selection criteria. |
| Desk Research | Desk research covered vehicle production data, safety recall filings, automotive association releases, official company chassis pages, and aftermarket product announcements. Source screening separated direct toe-link evidence from broader chassis-system proxy evidence. |
| Market Sizing and Forecasting | The model combined OEM fitment rates, replacement cycles, suspension architecture, vehicle type mix, material preference, and country-level vehicle output. Pricing assumptions were adjusted for OEM supply, branded aftermarket parts, and active chassis applications. |
| Data Validation | Forecasts were checked against output indicators, recall activity, supplier product coverage, and segment share consistency. Duplicate external statistics were removed and company portfolios were reviewed before inclusion in competitive sections. |
Toe Control Links Market by Segments
Toe Control Links Market segmented by Product Type:
- Fixed Toe Links
- Adjustable Toe Links
- Active Toe Links
- Lightweight Aluminum Links
Toe Control Links Market segmented by Vehicle Type:
- Passenger Cars
- SUVs / Crossovers
- Performance Vehicles
- Commercial Vehicles
Toe Control Links Market segmented by Material:
- Steel
- Aluminum
- Forged / Cast Alloy
- Composite / Other
Toe Control Links Market segmented by Suspension Type:
- Multi-link Suspension
- Independent Rear Suspension
- Performance / Adaptive Suspension
Toe Control Links Market segmented by Sales Channel:
- OEM
- Aftermarket
Toe Control Links Market by Region:
- North America
- United States
- Canada
- Mexico
- Latin America
- Brazil
- Chile
- Argentina
- Western Europe
- Germany
- United Kingdom
- Italy
- Spain
- France
- Nordic countries
- Eastern Europe
- Russia
- Poland
- Hungary
- Balkan & Baltic countries
- East Asia
- China
- Japan
- South Korea
- South Asia and Pacific
- India
- ASEAN
- Australia & New Zealand
- Middle East & Africa
- GCC
- Turkiye
- South Africa
- Other African Union
Research Sources and Bibliography
- International Organization of Motor Vehicle Manufacturers. (2026, April). Auto industry growth shifted east in 2025 amid global repositioning. OICA.
- European Automobile Manufacturers' Association. (2026, January 27). New car registrations: +1.8% in 2025; battery-electric 17.4% market share. ACEA.
- National Bureau of Statistics of China. (2026, February 28). Statistical Communique of the People's Republic of China on the 2025 National Economic and Social Development. National Bureau of Statistics of China.
- Society of Indian Automobile Manufacturers. (2025, April 15). Auto Industry Performance of FY 2024-25. SIAM.
- German Association of the Automotive Industry. (2026, February 3). Production and market in January 2026. VDA.
- Society of Motor Manufacturers and Traders. (2026, April 30). Car production stabilises but outlook still challenging. SMMT.
- International Organization of Motor Vehicle Manufacturers. (2026, March). PFA France's Automotive Platform Market Analysis Letter. OICA.
- USA International Trade Administration. (2025, November 20). Japan - Automotive. USA Department of Commerce.
- Ministry of Trade, Industry and Resources. (2026, April). March 2026 Automobile Exports Reach $6.4 Billion. MOTIR.
- National Highway Traffic Safety Administration. (2026, January 5). Part 573 Safety Recall Report 26V003. USA Department of Transportation.
- National Highway Traffic Safety Administration. (2026, February 20). Part 573 Safety Recall Report 26V101. USA Department of Transportation.
- ZF Group. (2025, February 26). ZF Aftermarket Adds Over 130 New Parts to TRW Chassis Line, Expands Coverage to 29 Million More Vehicles in Operation. ZF Press.
- Schaeffler Group. (2025, July 9). Rear-wheel steering: Successful production launch for German OEM and new volume production orders with greater vertical integration. Schaeffler.
This bibliography is provided for reader reference and uses primary government, standards-body, official trade body, and company sources.
This Report Answers
- What is the expected value of the Toe Control Links Market in 2026 and 2036?
- What CAGR is forecast for toe control links from 2026 to 2036?
- Which product type has a notable share in 2026?
- Which material category is meaningfully positioned in 2026?
- How do EVs and SUVs affect toe-link specifications and supplier selection?
- Which countries are compared in the toe control links forecast?
- Which companies compete across OEM chassis supply and aftermarket fitment?
- What products are included in the toe control links scope?
- How does FMI size and forecast this suspension component category?
- What buyer factors should procurement teams evaluate before supplier selection?
Frequently Asked Questions
Why should executives track the Toe Control Links Market?
Executives should track this market because toe control links directly affect wheel alignment durability tire wear risk and chassis reliability on heavier EV and SUV platforms.
What business problem does the Toe Control Links Market address?
It stabilizes rear wheel toe geometry to maintain handling safety and predictable alignment during braking cornering and long term vehicle use.
What should procurement leaders evaluate before selecting suppliers?
Procurement leaders should evaluate fatigue strength corrosion protection geometry accuracy validation records and service ready fitment documentation.
What can limit return on investment for buyers?
Return on investment can be limited by misfit components corrosion related failures and unclear installation procedures that increase warranty or repair risk.
How can suppliers build executive confidence?
Suppliers build confidence by delivering validated steel or alloy links consistent forming quality clear service instructions and proven OEM or aftermarket performance history.
Preview the report firsthand - request a free sample
Get SampleGet the brochure for pricing and purchase details.
Get PDFTable of Content
- Key Takeaways
- Market Size and CAGR
- Top Growth Driver
- Fastest Growing Segment
- Leading Region
- Key Companies
- Emerging Opportunities
- Executive Summary
- Global Market Outlook
- Demand-side Trends
- Supply-side Trends
- Technology Roadmap Analysis
- Analysis and Recommendations
- Analyst Perspective (What is happening? Why now? What should investors know?)
- Key Questions Answered
- How large is the market?
- What is the CAGR?
- What are key trends?
- Which region dominates?
- Who are the leaders?
- Market Overview
- Market Coverage / Taxonomy
- Market Definition / Scope / Limitations
- Research Methodology
- Chapter Orientation
- Analytical Lens and Working Hypotheses
- Market Structure, Signals, and Trend Drivers
- Benchmarking and Cross-market Comparability
- Market Sizing, Forecasting, and Opportunity Mapping
- Research Design and Evidence Framework
- Desk Research Programme (Secondary Evidence)
- Expert Input and Fieldwork (Primary Evidence)
- Tooling, Models, and Reference Databases
- Data Engineering and Model Build
- Quality Assurance and Audit Trail
- Market Background
- Market Dynamics (Drivers, Restraints, Opportunity, Trends)
- Scenario Forecast (Optimistic, Likely, Conservative)
- Impact Analysis
- AI Impact
- Sustainability Impact
- Regulatory Impact
- Technology Impact
- Consumer / Buyer Analysis
- Purchase Drivers
- Adoption Barriers
- Buyer Journey
- Opportunity Map Analysis
- Product Life Cycle Analysis
- Supply Chain Analysis
- Investment Feasibility Matrix
- Value Chain Analysis
- PESTLE and Porter's Analysis
- Regulatory Landscape
- Regional Parent Market Outlook
- Production and Consumption Statistics
- Import and Export Statistics
- Global Market Analysis and Forecast, 2021 to 2036
- Historical Market Size Value (USD Million) & Volume (Unit) Analysis, 2021 to 2025
- Current and Future Market Size Value (USD Million) & Volume (Unit) Projections, 2026 to 2036
- Y-o-Y Growth Trend Analysis
- Absolute $ Opportunity Analysis
- Global Market Pricing Analysis, 2021 to 2036
- Global Market Analysis and Forecast, By Product Type, 2021 to 2036
- Introduction / Key Findings
- Historical Market Size Value (USD Million) & Volume (Unit) Analysis By Product Type, 2021 to 2025
- Current and Future Market Size Value (USD Million) & Volume (Unit) Analysis and Forecast By Product Type, 2026 to 2036
- Fixed Toe Links
- Adjustable Toe Links
- Active Toe Links
- Lightweight Aluminum Links
- Fixed Toe Links
- Y-o-Y Growth Trend Analysis By Product Type, 2021 to 2025
- Absolute $ Opportunity Analysis By Product Type, 2026 to 2036
- Global Market Analysis and Forecast, By Vehicle Type, 2021 to 2036
- Introduction / Key Findings
- Historical Market Size Value (USD Million) & Volume (Unit) Analysis By Vehicle Type, 2021 to 2025
- Current and Future Market Size Value (USD Million) & Volume (Unit) Analysis and Forecast By Vehicle Type, 2026 to 2036
- Passenger Cars
- SUVs / Crossovers
- Performance Vehicles
- Commercial Vehicles
- Passenger Cars
- Y-o-Y Growth Trend Analysis By Vehicle Type, 2021 to 2025
- Absolute $ Opportunity Analysis By Vehicle Type, 2026 to 2036
- Global Market Analysis and Forecast, By Material, 2021 to 2036
- Introduction / Key Findings
- Historical Market Size Value (USD Million) & Volume (Unit) Analysis By Material, 2021 to 2025
- Current and Future Market Size Value (USD Million) & Volume (Unit) Analysis and Forecast By Material, 2026 to 2036
- Steel
- Aluminum
- Composite / Other
- Forged / Cast Alloy
- Steel
- Y-o-Y Growth Trend Analysis By Material, 2021 to 2025
- Absolute $ Opportunity Analysis By Material, 2026 to 2036
- Global Market Analysis and Forecast, By Suspension Type, 2021 to 2036
- Introduction / Key Findings
- Historical Market Size Value (USD Million) & Volume (Unit) Analysis By Suspension Type, 2021 to 2025
- Current and Future Market Size Value (USD Million) & Volume (Unit) Analysis and Forecast By Suspension Type, 2026 to 2036
- Multi-link Suspension
- Independent Rear Suspension
- Performance / Adaptive Suspension
- Multi-link Suspension
- Y-o-Y Growth Trend Analysis By Suspension Type, 2021 to 2025
- Absolute $ Opportunity Analysis By Suspension Type, 2026 to 2036
- Global Market Analysis and Forecast, By Sales Channel, 2021 to 2036
- Introduction / Key Findings
- Historical Market Size Value (USD Million) & Volume (Unit) Analysis By Sales Channel, 2021 to 2025
- Current and Future Market Size Value (USD Million) & Volume (Unit) Analysis and Forecast By Sales Channel, 2026 to 2036
- OEM
- Aftermarket
- OEM
- Y-o-Y Growth Trend Analysis By Sales Channel, 2021 to 2025
- Absolute $ Opportunity Analysis By Sales Channel, 2026 to 2036
- Global Market Analysis and Forecast, By Region, 2021 to 2036
- Introduction
- Historical Market Size Value (USD Million) & Volume (Unit) Analysis By Region, 2021 to 2025
- Current Market Size Value (USD Million) & Volume (Unit) Analysis and Forecast By Region, 2026 to 2036
- North America
- Latin America
- Western Europe
- Eastern Europe
- East Asia
- South Asia and Pacific
- Middle East & Africa
- Market Attractiveness Analysis By Region
- North America Market Analysis and Forecast, By Country, 2021 to 2036
- Historical Market Size Value (USD Million) & Volume (Unit) Trend Analysis By Market Taxonomy, 2021 to 2025
- Market Size Value (USD Million) & Volume (Unit) Forecast By Market Taxonomy, 2026 to 2036
- By Country
- USA
- Canada
- Mexico
- By Product Type
- By Vehicle Type
- By Material
- By Suspension Type
- By Sales Channel
- By Country
- Market Attractiveness Analysis
- By Country
- By Product Type
- By Vehicle Type
- By Material
- By Suspension Type
- By Sales Channel
- Key Takeaways
- Latin America Market Analysis and Forecast, By Country
- Historical Market Size Value (USD Million) & Volume (Unit) Trend Analysis By Market Taxonomy, 2021 to 2025
- Market Size Value (USD Million) & Volume (Unit) Forecast By Market Taxonomy, 2026 to 2036
- By Country
- Brazil
- Chile
- Rest of Latin America
- By Product Type
- By Vehicle Type
- By Material
- By Suspension Type
- By Sales Channel
- By Country
- Market Attractiveness Analysis
- By Country
- By Product Type
- By Vehicle Type
- By Material
- By Suspension Type
- By Sales Channel
- Key Takeaways
- Western Europe Market Analysis and Forecast, By Country
- Historical Market Size Value (USD Million) & Volume (Unit) Trend Analysis By Market Taxonomy, 2021 to 2025
- Market Size Value (USD Million) & Volume (Unit) Forecast By Market Taxonomy, 2026 to 2036
- By Country
- Germany
- UK
- Italy
- Spain
- France
- Nordic
- BENELUX
- Rest of Western Europe
- By Product Type
- By Vehicle Type
- By Material
- By Suspension Type
- By Sales Channel
- By Country
- Market Attractiveness Analysis
- By Country
- By Product Type
- By Vehicle Type
- By Material
- By Suspension Type
- By Sales Channel
- Key Takeaways
- Eastern Europe Market Analysis and Forecast, By Country
- Historical Market Size Value (USD Million) & Volume (Unit) Trend Analysis By Market Taxonomy, 2021 to 2025
- Market Size Value (USD Million) & Volume (Unit) Forecast By Market Taxonomy, 2026 to 2036
- By Country
- Russia
- Poland
- Hungary
- Balkan & Baltic
- Rest of Eastern Europe
- By Product Type
- By Vehicle Type
- By Material
- By Suspension Type
- By Sales Channel
- By Country
- Market Attractiveness Analysis
- By Country
- By Product Type
- By Vehicle Type
- By Material
- By Suspension Type
- By Sales Channel
- Key Takeaways
- East Asia Market Analysis and Forecast, By Country
- Historical Market Size Value (USD Million) & Volume (Unit) Trend Analysis By Market Taxonomy, 2021 to 2025
- Market Size Value (USD Million) & Volume (Unit) Forecast By Market Taxonomy, 2026 to 2036
- By Country
- China
- Japan
- South Korea
- By Product Type
- By Vehicle Type
- By Material
- By Suspension Type
- By Sales Channel
- By Country
- Market Attractiveness Analysis
- By Country
- By Product Type
- By Vehicle Type
- By Material
- By Suspension Type
- By Sales Channel
- Key Takeaways
- South Asia and Pacific Market Analysis and Forecast, By Country
- Historical Market Size Value (USD Million) & Volume (Unit) Trend Analysis By Market Taxonomy, 2021 to 2025
- Market Size Value (USD Million) & Volume (Unit) Forecast By Market Taxonomy, 2026 to 2036
- By Country
- India
- ASEAN
- Australia & New Zealand
- Rest of South Asia and Pacific
- By Product Type
- By Vehicle Type
- By Material
- By Suspension Type
- By Sales Channel
- By Country
- Market Attractiveness Analysis
- By Country
- By Product Type
- By Vehicle Type
- By Material
- By Suspension Type
- By Sales Channel
- Key Takeaways
- Middle East & Africa Market Analysis and Forecast, By Country
- Historical Market Size Value (USD Million) & Volume (Unit) Trend Analysis By Market Taxonomy, 2021 to 2025
- Market Size Value (USD Million) & Volume (Unit) Forecast By Market Taxonomy, 2026 to 2036
- By Country
- Kingdom of Saudi Arabia
- Other GCC Countries
- Türkiye
- South Africa
- Other African Union
- Rest of Middle East & Africa
- By Product Type
- By Vehicle Type
- By Material
- By Suspension Type
- By Sales Channel
- By Country
- Market Attractiveness Analysis
- By Country
- By Product Type
- By Vehicle Type
- By Material
- By Suspension Type
- By Sales Channel
- Key Takeaways
- Key Countries Market Analysis
- USA
- Pricing Analysis
- Market Share Analysis, 2025
- By Product Type
- By Vehicle Type
- By Material
- By Suspension Type
- By Sales Channel
- Canada
- Pricing Analysis
- Market Share Analysis, 2025
- By Product Type
- By Vehicle Type
- By Material
- By Suspension Type
- By Sales Channel
- Mexico
- Pricing Analysis
- Market Share Analysis, 2025
- By Product Type
- By Vehicle Type
- By Material
- By Suspension Type
- By Sales Channel
- Brazil
- Pricing Analysis
- Market Share Analysis, 2025
- By Product Type
- By Vehicle Type
- By Material
- By Suspension Type
- By Sales Channel
- Chile
- Pricing Analysis
- Market Share Analysis, 2025
- By Product Type
- By Vehicle Type
- By Material
- By Suspension Type
- By Sales Channel
- Germany
- Pricing Analysis
- Market Share Analysis, 2025
- By Product Type
- By Vehicle Type
- By Material
- By Suspension Type
- By Sales Channel
- UK
- Pricing Analysis
- Market Share Analysis, 2025
- By Product Type
- By Vehicle Type
- By Material
- By Suspension Type
- By Sales Channel
- Italy
- Pricing Analysis
- Market Share Analysis, 2025
- By Product Type
- By Vehicle Type
- By Material
- By Suspension Type
- By Sales Channel
- Spain
- Pricing Analysis
- Market Share Analysis, 2025
- By Product Type
- By Vehicle Type
- By Material
- By Suspension Type
- By Sales Channel
- France
- Pricing Analysis
- Market Share Analysis, 2025
- By Product Type
- By Vehicle Type
- By Material
- By Suspension Type
- By Sales Channel
- India
- Pricing Analysis
- Market Share Analysis, 2025
- By Product Type
- By Vehicle Type
- By Material
- By Suspension Type
- By Sales Channel
- ASEAN
- Pricing Analysis
- Market Share Analysis, 2025
- By Product Type
- By Vehicle Type
- By Material
- By Suspension Type
- By Sales Channel
- Australia & New Zealand
- Pricing Analysis
- Market Share Analysis, 2025
- By Product Type
- By Vehicle Type
- By Material
- By Suspension Type
- By Sales Channel
- China
- Pricing Analysis
- Market Share Analysis, 2025
- By Product Type
- By Vehicle Type
- By Material
- By Suspension Type
- By Sales Channel
- Japan
- Pricing Analysis
- Market Share Analysis, 2025
- By Product Type
- By Vehicle Type
- By Material
- By Suspension Type
- By Sales Channel
- South Korea
- Pricing Analysis
- Market Share Analysis, 2025
- By Product Type
- By Vehicle Type
- By Material
- By Suspension Type
- By Sales Channel
- Russia
- Pricing Analysis
- Market Share Analysis, 2025
- By Product Type
- By Vehicle Type
- By Material
- By Suspension Type
- By Sales Channel
- Poland
- Pricing Analysis
- Market Share Analysis, 2025
- By Product Type
- By Vehicle Type
- By Material
- By Suspension Type
- By Sales Channel
- Hungary
- Pricing Analysis
- Market Share Analysis, 2025
- By Product Type
- By Vehicle Type
- By Material
- By Suspension Type
- By Sales Channel
- Kingdom of Saudi Arabia
- Pricing Analysis
- Market Share Analysis, 2025
- By Product Type
- By Vehicle Type
- By Material
- By Suspension Type
- By Sales Channel
- Türkiye
- Pricing Analysis
- Market Share Analysis, 2025
- By Product Type
- By Vehicle Type
- By Material
- By Suspension Type
- By Sales Channel
- South Africa
- Pricing Analysis
- Market Share Analysis, 2025
- By Product Type
- By Vehicle Type
- By Material
- By Suspension Type
- By Sales Channel
- USA
- Market Structure Analysis
- Competition Dashboard
- Competition Benchmarking
- Market Share Analysis of Top Players
- By Region
- By Product Type
- By Vehicle Type
- By Material
- By Suspension Type
- By Sales Channel
- Emerging Startups
- Innovation Benchmarking
- Competition Analysis
- Competition Deep Dive
- ZF
- Overview
- Product Portfolio
- Profitability by Market Segments (Product/Region/Sales Channel)
- Sales Footprint
- Strategy Overview
- Marketing Strategy
- Product Strategy
- Channel Strategy
- Magna
- Benteler
- Schaeffler
- Gestamp
- Autokiniton
- ZF
- Case Studies
- Success Stories
- Recent Developments
- Competition Deep Dive
- Assumptions & Acronyms Used


