Torula Yeast Market Size and Share Forecast Outlook 2025 to 2035

The global torula yeast market is estimated to be valued at USD 2.6 billion in 2025 and is projected to reach USD 3.7 billion by 2035, registering a compound annual growth rate (CAGR) of 3.7% over the forecast period. An absolute dollar opportunity of approximately USD 1,100 million is anticipated to be added over the decade, reflecting a 1.42-times growth at a compound annual growth rate of 3.7%. The market’s evolution is expected to be shaped by increasing demand for natural flavor enhancers in food and beverage formulations, growing adoption in animal feed for protein enrichment, and rising investment in clean-label ingredients.

By 2030, the market is likely to reach USD 3.1 billion, accounting for USD 500 million in incremental value over the first half of the decade. The remaining USD 600 million is expected during the second half, suggesting a back-loaded growth pattern amid accelerating demand in feed and supplement sectors.

Companies such as Koninklijke DSM, Lallemand, Oriental Yeast, Synergy Flavors, and Chr. Hansen are reinforcing their market positions through expansion of fermentation capacity, investment in processing technologies, and innovation in clean-label formulations. Strategic collaborations and R&D alliances are fuelling product penetration in both food and feed segments, with regulatory compliance and nutritional functionality remaining central to competitive differentiation.
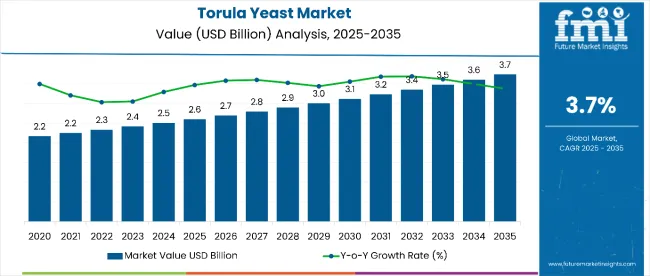
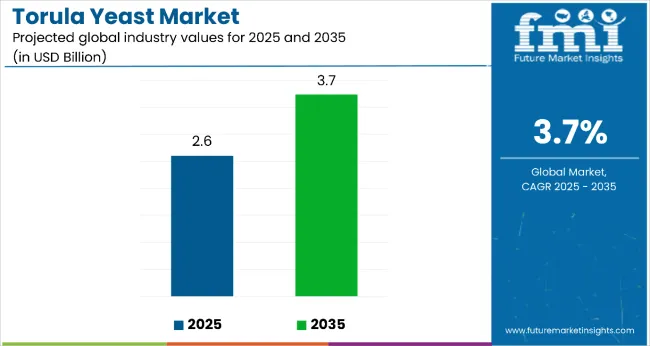
Torula Yeast Market Value Analysis

Quick Stats for Torula Yeast Market

  • Torula Yeast Market Value (2025): USD 2.6 billion
  • Torula Yeast Market Forecast Value (2035): USD 3.7 billion
  • Torula Yeast Market Forecast CAGR: 3.7%
  • Leading Segment in Torula Yeast Market in 2025: Food Industry (65% market share)
  • Key Growth Regions in Torula Yeast Market: North America, Asia-Pacific, Europe
  • Top Key Players in Torula Yeast Market: Gluthatheon, Koninklijke DSM N.V., Chr. Hansen Holding A/S, Lallemand Inc., Kanegrade, Oriental Yeast Co., Kohjin, Synergy Flavors

Torula Yeast Market

Metric Value
Estimated Size (2025E) USD 2.6 billion
Projected Value (2035F) USD 3.7 billion
CAGR (2025 to 2035) 3.7%

The market holds a significant niche within several broader parent markets. In the food ingredients sector, torula yeast captures approximately 8-10% of the natural flavor enhancer segment, driven by demand for clean-label and plant-based solutions. Within animal feed ingredients, it accounts for around 6-7%, favored for its sustainable protein content and digestibility benefits. In nutritional supplements, torula yeast’s share is smaller but growing, estimated at 3-4%, as awareness of its B-vitamin profile rises. The specialty yeast market includes torula yeast as a key component, representing roughly 12% due to its diverse applications. Overall, torula yeast maintains a steadily expanding presence across these interconnected markets.

Strong momentum is being driven by consumer demand for natural, savory (umami) flavor alternatives, expansion of plant-based and health-focused food portfolios, and increased feed industry uptake for livestock and aquaculture nutrition. Innovation is evidenced by development of encapsulated forms for stability, high-protein blends targeting pet food, and precision fermentation methods reducing process footprint. Regulatory trends favoring clean-label disclosure and upcycled ingredients are reinforcing adoption, while supply chain consolidation and raw material standardization continue to underpin market stability.

Why is the Torula Yeast Market Growing?

Torula yeast’s natural umami profile, high protein content, and clean-label credentials have made it a preferred choice for food manufacturers seeking sustainable flavor enhancement solutions. Its ability to improve taste without synthetic additives aligns strongly with consumer demand for natural and minimally processed ingredients. Additionally, its role as a nutrient-rich feed additive is boosting adoption in the livestock and aquaculture sectors.

Rising awareness of plant-based and allergen-free protein sources is further accelerating uptake, especially in functional foods, vegan products, and specialty nutrition formulations. Technological advances in precision fermentation and upcycling of wood-derived substrates are improving yield efficiency and product consistency, broadening commercial viability. As demand for sustainable, protein-dense, and regulatory-compliant ingredients grows, the torula yeast market is positioned for steady expansion across food, beverage, pet nutrition, and feed industries.

Segmental Analysis

The market is segmented by type, form, application, distribution channel, and region. By type, the market is divided into baker’s yeast, wine yeast, feed yeast, bio-ethanol yeast, nutritional yeast, and deactivated yeast. Based on form, the market is classified into instant yeast, dry yeast, and fresh yeast. By application, the market is segmented into food industry, paper industry, pharmaceutical industry and energy. By distribution channel, the market is divided into store-based retail, specialty stores, online retail, supermarkets, and hypermarkets. Regionally, the market is classified into North America, Eastern Europe, Western Europe, Asia-Pacific, Latin America, and Japan.
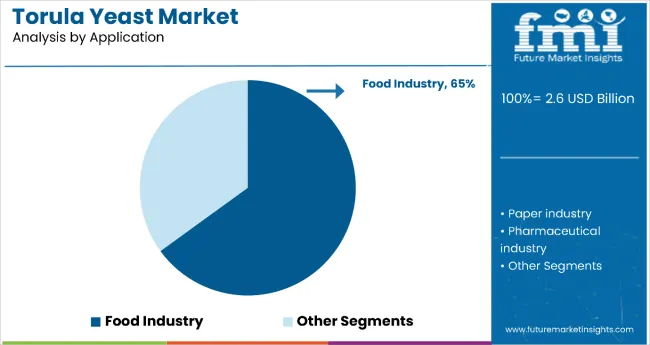
By Application, Food Industry Segment Accounts for 65% of the Market Share

Torula Yeast Market By Application

The food industry segment commands a 65% share of the torula yeast market, driven by its role as a natural flavor enhancer and nutritional fortifier. Its savory umami characteristics make it ideal for soups, sauces, ready meals, plant-based meat alternatives, and snack seasonings. The clean-label movement has further amplified its relevance, as manufacturers seek to replace synthetic additives with naturally derived solutions.

Growing consumer interest in healthier, plant-based products is boosting the incorporation of torula yeast in vegan cheese, protein bars, and meat analogs. Its high protein and vitamin content add both nutritional and sensory value, while its allergen-free and non-GMO attributes appeal to diverse dietary preferences. Product innovation, such as low-sodium savory seasonings and encapsulated yeast powders for extended stability, is expected to support this segment’s expansion across mainstream and specialty food sectors.
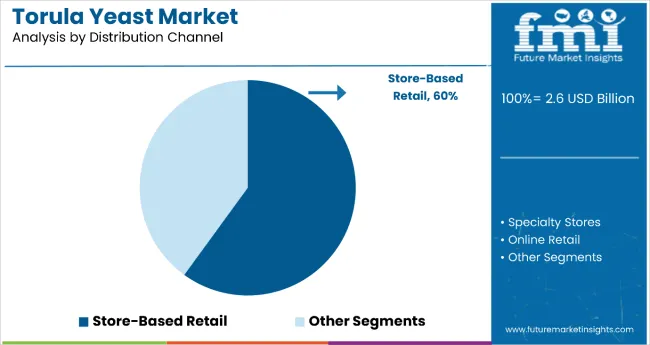
By Distribution Channel, Store-Based Retail Segment Accounts for 60% of the Market Share

Torula Yeast Market By Distribution Channel

Store-based retail holds a dominant 60% share of the torula yeast market, supported by the accessibility and consumer trust associated with physical purchase points. Supermarkets, hypermarkets, and specialty food stores provide an immediate product experience, enabling customers to evaluate freshness, packaging quality, and labeling before purchase. This tactile engagement remains a critical driver in consumer decision-making for specialty food ingredients.

The segment benefits from strategic product placements, in-store promotions, and sampling programs that build brand familiarity and encourage trial. Specialty retailers often showcase torula yeast alongside other premium, plant-based ingredients, reinforcing its positioning as a healthy and sustainable option. As demand for natural and functional food products rises, store-based channels are increasingly partnering with niche and emerging brands to diversify offerings. Despite the growth of e-commerce, store-based retail is projected to retain a stronghold, particularly in regions where consumers prioritize physical inspection and immediate product access.

What are the Drivers, Restraints, and Key Trends of the Torula Yeast Market?

In 2024, global torula yeast market consumption increased by 12% year-on-year, with North America and Europe together accounting for over 55% of demand. Applications span natural flavor enhancement, protein enrichment, and functional ingredient formulation across food, beverage, feed, and dietary supplements. Manufacturers are leveraging precision fermentation, advanced drying methods, and substrate optimization to improve yield efficiency and sensory consistency. Clean-label product positioning and sustainable sourcing are becoming central to competitive differentiation. Rising consumer demand for plant-based proteins, coupled with the shift away from artificial additives, continues to reinforce the market’s adoption trajectory across diverse end-use industries.

Plant-Based Nutrition and Clean-Label Trends Drive Torula Yeast Adoption

Food and beverage producers are increasingly incorporating torula yeast to deliver natural umami flavor, protein fortification, and B-vitamin enrichment without synthetic additives. Its allergen-free, non-GMO profile aligns well with consumer health priorities, while its adaptability in meat alternatives, vegan cheeses, and savory snacks is expanding application diversity. In feed and pet nutrition, torula yeast serves as a sustainable protein source with proven digestibility benefits, contributing to reduced reliance on conventional soy or fishmeal inputs. These nutritional and environmental advantages drive adoption rates upward, particularly in premium and specialty product segments.

Price Sensitivity, Supply Chain Limitations, and Technical Processing Restrain Growth

Market expansion faces constraints from feedstock cost volatility, specialized fermentation infrastructure requirements, and the limited number of commercial-scale processing facilities. Seasonal fluctuations in wood-derived feedstock availability can impact raw material costs by up to 15%, while precision fermentation processes add both capital expenditure and operational complexity. Cold storage and moisture-controlled logistics elevate distribution costs compared to conventional protein additives. These factors, combined with the need for technical expertise in flavor optimization, present barriers for small- and mid-scale producers in price-sensitive markets.
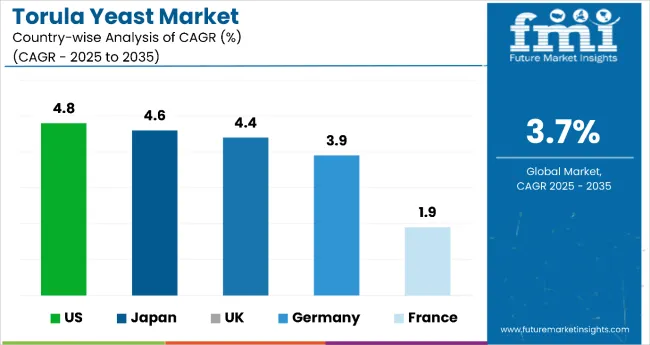
Torula Yeast Market Analysis by Top Countries

Country Wise Analysis Of Torula Yeast Market

Country CAGR (2025 to 2035)
USA 4.8%
Japan 4.6%
UK 4.4%
Germany 3.9%
France 1.9%

In the torula yeast market, the USA is forecasted to lead with a CAGR of 4.8% between 2025 and 2035, driven by strong demand in natural flavor enhancers and plant-based protein segments. Japan follows at 4.6%, supported by innovation in functional food applications and precision fermentation techniques. The UK ranks third at 4.4%, with growth concentrated in vegan and clean-label product categories. Germany’s CAGR of 3.9% reflects steady uptake in sustainable feed applications and specialty savory seasonings, while France shows the slowest growth at 1.9%, constrained by limited production expansion and slower consumer adoption outside premium segments.

The report covers an in-depth analysis of 40+ countries; five top-performing OECD countries are highlighted below.

Market Expansion in the Torula Yeast Market in the United States

Revenue from torula yeast in the USA is estimated to increase at a CAGR of 4.8% from 2025 to 2035, surpassing the global average. Growth is driven by demand for sustainable protein sources and natural umami flavoring in processed foods, snacks, and plant-based meats. Key markets in California, Illinois, and New York are seeing rapid adoption in premium food manufacturing, while livestock and aquaculture feed sectors are expanding usage for nutritional enrichment. Investment in large-scale fermentation facilities and advancements in spray-drying technology are enhancing both production capacity and ingredient functionality.

Key Statistics:

  • 42% of USA torula yeast production is directed to plant-based meat applications in 2024
  • USD 186 million invested in fermentation and drying capacity upgrades in 2024
  • 67% of domestic sales involve clean-label certified torula yeast products in 2024

Innovation Leadership in the Torula Yeast Market in Japan

Demand for torula yeast in Japan is anticipated to expand at a CAGR of 4.6% from 2025 to 2035, fueled by precision fermentation advancements and strong demand for natural seasonings in traditional and fusion cuisines. High adoption is seen in Tokyo, Osaka, and Nagoya, where consumer preference leans toward premium, clean-label products. Applications in instant noodles, snack seasonings, and plant-based meat analogs are gaining momentum. Japanese manufacturers are focusing on quality improvements, allergen-free certifications, and moisture-stable formulations to cater to both domestic and export markets.

Key Statistics:

  • 31% of torula yeast consumption in Japan comes from snack seasoning applications in 2024
  • USD 94 million revenue generated from premium-grade torula yeast in 2024
  • 78% of products marketed with clean-label or allergen-free claims in 2024

Growth Assessment for Torula Yeast Market in the United Kingdom

Revenue from torula yeast in the UK is expected to rise at a CAGR of 4.4% from 2025 to 2035, supported by expanding vegan and flexitarian diets. Major demand centers include London, Manchester, and Birmingham, with growing applications in meat-free ready meals, sauces, and baked goods. Partnerships between ingredient suppliers and plant-based food manufacturers are accelerating innovation. Post-Brexit trade shifts have prompted increased investment in domestic yeast production to reduce import dependency, though production scalability remains a challenge.

Key Statistics:

  • 56% of UK torula yeast demand linked to plant-based product development in 2024
  • £62 million invested in yeast fermentation technology domestically in 2024
  • 29% increase in new product launches using torula yeast between 2022 to 2024

Market Development in the Torula Yeast Market in Germany

Sales of torula yeast in Germanyare projected to flourish at a CAGR of 3.9% from 2025 to 2035, driven by adoption in sustainable feed protein and savory seasonings. Key urban centers such as Hamburg, Munich, and Berlin are leading consumption due to strong demand for premium and functional food products. Collaborations between German biotech firms and European ingredient companies are supporting technological innovation and application diversification. The regulatory emphasis on clean-label compliance is also boosting the appeal of torula yeast in both food and feed industries.

Key Statistics:

  • 48% of German torula yeast output goes into animal feed in 2024
  • 83% of torula yeast sold in Germany meets clean-label certification standards in 2024
  • €38 million invested in sustainable yeast fermentation facilities in 2024

Premium-Driven Growth in the Torula Yeast Market in France

The torula yeast market in France is forecasted to grow at a moderate CAGR of 1.9% from 2025 to 2035, below the global average. Growth is primarily concentrated in premium culinary applications such as gourmet sauces, artisanal soups, and specialty snack seasonings. Paris, Lyon, and Marseille remain the leading demand hubs. Limited domestic fermentation infrastructure and reliance on imports restrain faster market penetration, but partnerships with high-end food manufacturers are supporting niche adoption.

Key Statistics:
  • 27% of torula yeast sales in France linked to gourmet and artisanal food products in 2024
  • €14 million invested in small-scale specialty yeast production in 2024
  • 19% increase in high-end retail listings for torula yeast-based seasonings in 2024

Competitive Landscape of the Torula Yeast Market

Torula Yeast Market By Company

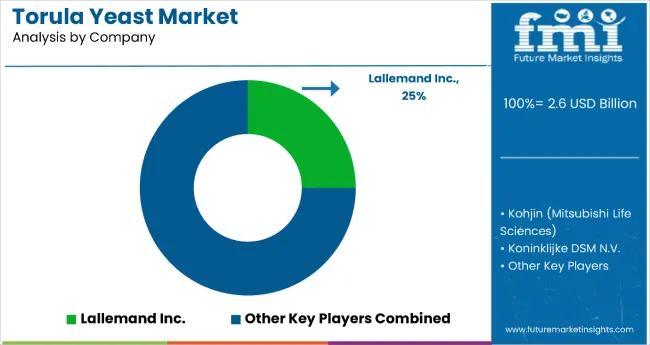
The torula yeast market is marked by moderate consolidation, with a mix of multinational ingredient giants, yeast-specialized firms, and regional players offering diverse technological capabilities, production scales, and application expertise. Leading companies such as Lallemand Inc., Koninklijke DSM N.V., Oriental Yeast Co., Ltd., Synergy Flavors, and Chr. Hansen are well-recognized for their fermentation proficiency and extensive functional ingredient portfolios. Additional formidable competitors include Kanegrade Ltd., Mitsubishi Corporation Life Sciences Holdings, Associated British Foods (ABF) plc, Angel Yeast, and Lesaffre Group, each contributing unique strengths in production, formulation, or regional access.

Innovation-driven differentiation is being pursued by several firms. Lallemand Inc. and Koninklijke DSM are investing in strain development and clean-label yeast variants tailored for savory, plant-based applications. Oriental Yeast emphasizes customization for specialty uses in Asian culinary and fermentation markets. Synergy Flavors focuses on sensory expertise, elevating torula yeast as an ingredient-driven flavor technology. Regional specialists such as Lesaffre are advancing sustainable, waste-derived fermentation approaches to support bio-based and organic applications. Such strategic focuses are enabling penetration into value-added segments like pet foods, nutraceuticals, and clean-label processed products.

Notably, entry into the torula yeast space remains challenging due to high capital requirements associated with advanced fermentation and spray-drying infrastructure, plus rigorous safety and regulatory compliance standards. The presence of viable substitutes, such as yeast extracts, MSG, and plant-based savory ingredients, further elevates competitive pressures. Success in this market is increasingly tied to production efficiency, strain innovation, clean-label positioning, and the ability to tailor offerings across food, feed, and nutraceutical sectors.

Scope of Report

Item Value
Quantitative Units USD 2.6 Billion
Type Baker’s Yeast, Wine Yeast, Feed Yeast, Bio-Ethanol Yeast, Nutritional Yeast, Deactivated Yeast
Form Instant Yeast, Dry Yeast, Fresh Yeast
Application Food Industry, Paper Industry, Pharmaceutical Industry, Energy
Distribution Channel Store-Based Retail, Specialty Stores, Online Retail, Supermarkets, Hypermarkets
Regions Covered North America, Eastern Europe, Western Europe, Asia-Pacific, Latin America, Japan, Middle East & Africa
Countries Covered United States, Canada, United Kingdom, Germany, France, China, Japan, South Korea, Brazil, Australia and 40+ countries
Key Companies Profiled Glut ha th eon, Koninklijke DSM N.V., Chr. Hansen Holding A/S, Lallemand Inc., Kanegrade, Oriental Yeast Co., Kohjin, Synergy Flavors
Additional Attributes Dollar sales by application and purity grade, regional demand trends, competitive landscape, consumer preferences for natural versus synthetic alternatives, Integration with environmentally responsible sourcing practices, innovations in extraction technology and quality standardization for diverse industrial applications

Key Segmentation

By Type:

  • Baker’s yeast
  • wine yeast
  • Feed yeast
  • Bio-Ethanol Yeast
  • Nutritional Yeast
  • Deactivated yeast

By Form:

  • Instant yeast
  • Dry yeast
  • Fresh yeast

By Application:

  • Food Industry
  • Paper industry
  • Pharmaceutical industry
  • Energy

By Distribution channel:

  • Store Based Retail
  • Specialty Stores
  • Online Retail
  • Supermarkets
  • Hypermarkets

By region:

  • North America
  • Latin America
  • Asia pacific
  • Eastern Europe
  • Western Europe
  • Japan

Table of Content

  1. Executive Summary
    • Global Market Outlook
    • Demand-side Trends
    • Supply-side Trends
    • Technology Roadmap Analysis
    • Analysis and Recommendations
  2. Market Overview
    • Market Coverage / Taxonomy
    • Market Definition / Scope / Limitations
  3. Market Background
    • Market Dynamics
      • Drivers
      • Restraints
      • Opportunity
      • Trends
    • Scenario Forecast
      • Demand in Optimistic Scenario
      • Demand in Likely Scenario
      • Demand in Conservative Scenario
    • Opportunity Map Analysis
    • Product Life Cycle Analysis
    • Supply Chain Analysis
      • Supply Side Participants and their Roles
        • Producers
        • Mid-Level Participants (Traders/ Agents/ Brokers)
        • Wholesalers and Distributors
      • Value Added and Value Created at Node in the Supply Chain
      • List of Raw Material Suppliers
      • List of Existing and Potential Buyer’s
    • Investment Feasibility Matrix
    • Value Chain Analysis
      • Profit Margin Analysis
      • Wholesalers and Distributors
      • Retailers
    • PESTLE and Porter’s Analysis
    • Regulatory Landscape
      • By Key Regions
      • By Key Countries
    • Regional Parent Market Outlook
    • Production and Consumption Statistics
    • Import and Export Statistics
  4. Global Market Analysis 2020 to 2024 and Forecast, 2025 to 2035
    • Historical Market Size Value (USD Billion) & Volume (Metric Tons) Analysis, 2020 to 2024
    • Current and Future Market Size Value (USD Billion) & Volume (Metric Tons) Projections, 2025 to 2035
      • Y-o-Y Growth Trend Analysis
      • Absolute $ Opportunity Analysis
  5. Global Market Pricing Analysis 2020 to 2024 and Forecast 2025 to 2035
  6. Introduction / Key Findings
  7. Global Market Analysis 2020 to 2024 and Forecast 2025 to 2035, By Type
    • Introduction / Key Findings
    • Historical Market Size Value (USD Billion) & Volume (Metric Tons) Analysis By Type, 2020 to 2024
    • Current and Future Market Size Value (USD Billion) & Volume (Metric Tons) Analysis and Forecast By Type, 2025 to 2035
      • Baker’s yeast
      • Wine yeast
      • Feed yeast
      • Feed yeast
      • Bio-Ethanol Yeast
      • Nutritional Yeast
      • Deactivated yeast
    • Y-o-Y Growth Trend Analysis By Type, 2020 to 2024
    • Absolute $ Opportunity Analysis By Type, 2025 to 2035
  8. Global Market Analysis 2020 to 2024 and Forecast 2025 to 2035, By Form
    • Introduction / Key Findings
    • Historical Market Size Value (USD Billion) & Volume (Metric Tons) Analysis By Form, 2020 to 2024
    • Current and Future Market Size Value (USD Billion) & Volume (Metric Tons) Analysis and Forecast By Form, 2025 to 2035
      • Instant yeast
      • Dry yeast
      • Fresh yeast
    • Y-o-Y Growth Trend Analysis By Form, 2020 to 2024
    • Absolute $ Opportunity Analysis By Form, 2025 to 2035
  9. Global Market Analysis 2020 to 2024 and Forecast 2025 to 2035, By Application
    • Introduction / Key Findings
    • Historical Market Size Value (USD Billion) & Volume (Metric Tons) Analysis By Application, 2020 to 2024
    • Current and Future Market Size Value (USD Billion) & Volume (Metric Tons) Analysis and Forecast By Application, 2025 to 2035
      • Food Industry
      • Paper industry
      • Pharmaceutical industry
      • Energy
    • Y-o-Y Growth Trend Analysis By Application, 2020 to 2024
    • Absolute $ Opportunity Analysis By Application, 2025 to 2035
  10. Global Market Analysis 2020 to 2024 and Forecast 2025 to 2035, By Distribution Channel
    • Introduction / Key Findings
    • Historical Market Size Value (USD Billion) & Volume (Metric Tons) Analysis By Distribution Channel, 2020 to 2024
    • Current and Future Market Size Value (USD Billion) & Volume (Metric Tons) Analysis and Forecast By Distribution Channel, 2025 to 2035
      • Store Based Retail
      • Specialty Stores
      • Online Retail
      • Supermarkets
      • Hypermarkets
    • Y-o-Y Growth Trend Analysis By Distribution Channel, 2020 to 2024
    • Absolute $ Opportunity Analysis By Distribution Channel, 2025 to 2035
  11. Global Market Analysis 2020 to 2024 and Forecast 2025 to 2035, By Region
    • Introduction
    • Historical Market Size Value (USD Billion) & Volume (Metric Tons) Analysis By Region, 2020 to 2024
    • Current Market Size Value (USD Billion) & Volume (Metric Tons) Analysis and Forecast By Region, 2025 to 2035
      • North America
      • Latin America
      • Western Europe
      • Eastern Europe
      • East Asia
      • South Asia & Pacific
      • Middle East and Africa
    • Market Attractiveness Analysis By Region
  12. North America Market Analysis 2020 to 2024 and Forecast 2025 to 2035, By Country
    • Historical Market Size Value (USD Billion) & Volume (Metric Tons) Trend Analysis By Market Taxonomy, 2020 to 2024
    • Market Size Value (USD Billion) & Volume (Metric Tons) Forecast By Market Taxonomy, 2025 to 2035
      • By Country
        • USA
        • Canada
        • Mexico
      • By Type
      • By Form
      • By Application
      • By Distribution Channel
    • Market Attractiveness Analysis
      • By Country
      • By Type
      • By Form
      • By Application
      • By Distribution Channel
    • Key Takeaways
  13. Latin America Market Analysis 2020 to 2024 and Forecast 2025 to 2035, By Country
    • Historical Market Size Value (USD Billion) & Volume (Metric Tons) Trend Analysis By Market Taxonomy, 2020 to 2024
    • Market Size Value (USD Billion) & Volume (Metric Tons) Forecast By Market Taxonomy, 2025 to 2035
      • By Country
        • Brazil
        • Argentina
        • Rest of LATAM
      • By Type
      • By Form
      • By Application
      • By Distribution Channel
    • Market Attractiveness Analysis
      • By Country
      • By Type
      • By Form
      • By Application
      • By Distribution Channel
    • Key Takeaways
  14. Western Europe Market Analysis 2020 to 2024 and Forecast 2025 to 2035, By Country
    • Historical Market Size Value (USD Billion) & Volume (Metric Tons) Trend Analysis By Market Taxonomy, 2020 to 2024
    • Market Size Value (USD Billion) & Volume (Metric Tons) Forecast By Market Taxonomy, 2025 to 2035
      • By Country
        • Germany
        • Italy
        • France
        • UK
        • Spain
        • BENELUX
        • Nordic
        • Rest of W.Europe
      • By Type
      • By Form
      • By Application
      • By Distribution Channel
    • Market Attractiveness Analysis
      • By Country
      • By Type
      • By Form
      • By Application
      • By Distribution Channel
    • Key Takeaways
  15. Eastern Europe Market Analysis 2020 to 2024 and Forecast 2025 to 2035, By Country
    • Historical Market Size Value (USD Billion) & Volume (Metric Tons) Trend Analysis By Market Taxonomy, 2020 to 2024
    • Market Size Value (USD Billion) & Volume (Metric Tons) Forecast By Market Taxonomy, 2025 to 2035
      • By Country
        • Russia
        • Hungary
        • Poland
        • Balkan & Baltics
        • Rest of E. Europe
      • By Type
      • By Form
      • By Application
      • By Distribution Channel
    • Market Attractiveness Analysis
      • By Country
      • By Type
      • By Form
      • By Application
      • By Distribution Channel
    • Key Takeaways
  16. East Asia Market Analysis 2020 to 2024 and Forecast 2025 to 2035, By Country
    • Historical Market Size Value (USD Billion) & Volume (Metric Tons) Trend Analysis By Market Taxonomy, 2020 to 2024
    • Market Size Value (USD Billion) & Volume (Metric Tons) Forecast By Market Taxonomy, 2025 to 2035
      • By Country
        • China
        • Japan
        • South Korea
      • By Type
      • By Form
      • By Application
      • By Distribution Channel
    • Market Attractiveness Analysis
      • By Country
      • By Type
      • By Form
      • By Application
      • By Distribution Channel
    • Key Takeaways
  17. South Asia & Pacific Market Analysis 2020 to 2024 and Forecast 2025 to 2035, By Country
    • Historical Market Size Value (USD Billion) & Volume (Metric Tons) Trend Analysis By Market Taxonomy, 2020 to 2024
    • Market Size Value (USD Billion) & Volume (Metric Tons) Forecast By Market Taxonomy, 2025 to 2035
      • By Country
        • India
        • Australia & New Zealand
        • ASEAN
        • Rest of SAP
      • By Type
      • By Form
      • By Application
      • By Distribution Channel
    • Market Attractiveness Analysis
      • By Country
      • By Type
      • By Form
      • By Application
      • By Distribution Channel
    • Key Takeaways
  18. Middle East and Africa Market Analysis 2020 to 2024 and Forecast 2025 to 2035, By Country
    • Historical Market Size Value (USD Billion) & Volume (Metric Tons) Trend Analysis By Market Taxonomy, 2020 to 2024
    • Market Size Value (USD Billion) & Volume (Metric Tons) Forecast By Market Taxonomy, 2025 to 2035
      • By Country
        • GCC Countries
        • Northern Africa
        • South Africa
        • Turkiye
        • Rest of MEA
      • By Type
      • By Form
      • By Application
      • By Distribution Channel
    • Market Attractiveness Analysis
      • By Country
      • By Type
      • By Form
      • By Application
      • By Distribution Channel
    • Key Takeaways
  19. Key Countries Market Analysis
    • USA
      • Pricing Analysis
      • Market Share Analysis, 2024
        • By Type
        • By Form
        • By Application
        • By Distribution Channel
    • Canada
    • Brazil
    • Mexico
    • Argentina
  20. Market Structure Analysis
    • Competition Dashboard
    • Competition Benchmarking
    • Market Share Analysis of Top Players
      • By Regional
      • By Type
      • By Form
      • By Application
      • By Distribution Channel
  21. Competition Analysis
    • Competition Deep Dive
      • Gluthatheon
        • Overview
        • Product Portfolio
        • Profitability by Market Segments (Product/Age /Sales Channel/Region)
        • Sales Footprint
        • Strategy Overview
          • Marketing Strategy
          • Product Strategy
          • Channel Strategy
      • Koninklijke DSM N.V.
      • Chr. Hansen Holding A/S
      • Lallemand Inc.
      • Kenegrade
      • Oriental Yeast Co.
      • Kohjin
      • Synergy Flavors
  22. Assumptions & Acronyms Used
  23. Research Methodology

List of Tables

  • Table 1: Global Market Value (USD Billion) Forecast by Region, 2020-2035
  • Table 2: Global Market Volume (Metric Tons) Forecast by Region, 2020-2035
  • Table 3: Global Market Value (USD Billion) Forecast by Type, 2020-2035
  • Table 4: Global Market Volume (Metric Tons) Forecast by Type, 2020-2035
  • Table 5: Global Market Value (USD Billion) Forecast by Form, 2020-2035
  • Table 6: Global Market Volume (Metric Tons) Forecast by Form, 2020-2035
  • Table 7: Global Market Value (USD Billion) Forecast by Application, 2020-2035
  • Table 8: Global Market Volume (Metric Tons) Forecast by Application, 2020-2035
  • Table 9: Global Market Value (USD Billion) Forecast by Distribution Channel, 2020-2035
  • Table 10: Global Market Volume (Metric Tons) Forecast by Distribution Channel, 2020-2035
  • Table 11: North America Market Value (USD Billion) Forecast by Country, 2020-2035
  • Table 12: North America Market Volume (Metric Tons) Forecast by Country, 2020-2035
  • Table 13: North America Market Value (USD Billion) Forecast by Type, 2020-2035
  • Table 14: North America Market Volume (Metric Tons) Forecast by Type, 2020-2035
  • Table 15: North America Market Value (USD Billion) Forecast by Form, 2020-2035
  • Table 16: North America Market Volume (Metric Tons) Forecast by Form, 2020-2035
  • Table 17: North America Market Value (USD Billion) Forecast by Application, 2020-2035
  • Table 18: North America Market Volume (Metric Tons) Forecast by Application, 2020-2035
  • Table 19: North America Market Value (USD Billion) Forecast by Distribution Channel, 2020-2035
  • Table 20: North America Market Volume (Metric Tons) Forecast by Distribution Channel, 2020-2035
  • Table 21: Latin America Market Value (USD Billion) Forecast by Country, 2020-2035
  • Table 22: Latin America Market Volume (Metric Tons) Forecast by Country, 2020-2035
  • Table 23: Latin America Market Value (USD Billion) Forecast by Type, 2020-2035
  • Table 24: Latin America Market Volume (Metric Tons) Forecast by Type, 2020-2035
  • Table 25: Latin America Market Value (USD Billion) Forecast by Form, 2020-2035
  • Table 26: Latin America Market Volume (Metric Tons) Forecast by Form, 2020-2035
  • Table 27: Latin America Market Value (USD Billion) Forecast by Application, 2020-2035
  • Table 28: Latin America Market Volume (Metric Tons) Forecast by Application, 2020-2035
  • Table 29: Latin America Market Value (USD Billion) Forecast by Distribution Channel, 2020-2035
  • Table 30: Latin America Market Volume (Metric Tons) Forecast by Distribution Channel, 2020-2035
  • Table 31: Western Europe Market Value (USD Billion) Forecast by Country, 2020-2035
  • Table 32: Western Europe Market Volume (Metric Tons) Forecast by Country, 2020-2035
  • Table 33: Western Europe Market Value (USD Billion) Forecast by Type, 2020-2035
  • Table 34: Western Europe Market Volume (Metric Tons) Forecast by Type, 2020-2035
  • Table 35: Western Europe Market Value (USD Billion) Forecast by Form, 2020-2035
  • Table 36: Western Europe Market Volume (Metric Tons) Forecast by Form, 2020-2035
  • Table 37: Western Europe Market Value (USD Billion) Forecast by Application, 2020-2035
  • Table 38: Western Europe Market Volume (Metric Tons) Forecast by Application, 2020-2035
  • Table 39: Western Europe Market Value (USD Billion) Forecast by Distribution Channel, 2020-2035
  • Table 40: Western Europe Market Volume (Metric Tons) Forecast by Distribution Channel, 2020-2035
  • Table 41: Eastern Europe Market Value (USD Billion) Forecast by Country, 2020-2035
  • Table 42: Eastern Europe Market Volume (Metric Tons) Forecast by Country, 2020-2035
  • Table 43: Eastern Europe Market Value (USD Billion) Forecast by Type, 2020-2035
  • Table 44: Eastern Europe Market Volume (Metric Tons) Forecast by Type, 2020-2035
  • Table 45: Eastern Europe Market Value (USD Billion) Forecast by Form, 2020-2035
  • Table 46: Eastern Europe Market Volume (Metric Tons) Forecast by Form, 2020-2035
  • Table 47: Eastern Europe Market Value (USD Billion) Forecast by Application, 2020-2035
  • Table 48: Eastern Europe Market Volume (Metric Tons) Forecast by Application, 2020-2035
  • Table 49: Eastern Europe Market Value (USD Billion) Forecast by Distribution Channel, 2020-2035
  • Table 50: Eastern Europe Market Volume (Metric Tons) Forecast by Distribution Channel, 2020-2035
  • Table 51: East Asia Market Value (USD Billion) Forecast by Country, 2020-2035
  • Table 52: East Asia Market Volume (Metric Tons) Forecast by Country, 2020-2035
  • Table 53: East Asia Market Value (USD Billion) Forecast by Type, 2020-2035
  • Table 54: East Asia Market Volume (Metric Tons) Forecast by Type, 2020-2035
  • Table 55: East Asia Market Value (USD Billion) Forecast by Form, 2020-2035
  • Table 56: East Asia Market Volume (Metric Tons) Forecast by Form, 2020-2035
  • Table 57: East Asia Market Value (USD Billion) Forecast by Application, 2020-2035
  • Table 58: East Asia Market Volume (Metric Tons) Forecast by Application, 2020-2035
  • Table 59: East Asia Market Value (USD Billion) Forecast by Distribution Channel, 2020-2035
  • Table 60: East Asia Market Volume (Metric Tons) Forecast by Distribution Channel, 2020-2035
  • Table 61: South Asia & Pacific Market Value (USD Billion) Forecast by Country, 2020-2035
  • Table 62: South Asia & Pacific Market Volume (Metric Tons) Forecast by Country, 2020-2035
  • Table 63: South Asia & Pacific Market Value (USD Billion) Forecast by Type, 2020-2035
  • Table 64: South Asia & Pacific Market Volume (Metric Tons) Forecast by Type, 2020-2035
  • Table 65: South Asia & Pacific Market Value (USD Billion) Forecast by Form, 2020-2035
  • Table 66: South Asia & Pacific Market Volume (Metric Tons) Forecast by Form, 2020-2035
  • Table 67: South Asia & Pacific Market Value (USD Billion) Forecast by Application, 2020-2035
  • Table 68: South Asia & Pacific Market Volume (Metric Tons) Forecast by Application, 2020-2035
  • Table 69: South Asia & Pacific Market Value (USD Billion) Forecast by Distribution Channel, 2020-2035
  • Table 70: South Asia & Pacific Market Volume (Metric Tons) Forecast by Distribution Channel, 2020-2035
  • Table 71: Middle East and Africa Market Value (USD Billion) Forecast by Country, 2020-2035
  • Table 72: Middle East and Africa Market Volume (Metric Tons) Forecast by Country, 2020-2035
  • Table 73: Middle East and Africa Market Value (USD Billion) Forecast by Type, 2020-2035
  • Table 74: Middle East and Africa Market Volume (Metric Tons) Forecast by Type, 2020-2035
  • Table 75: Middle East and Africa Market Value (USD Billion) Forecast by Form, 2020-2035
  • Table 76: Middle East and Africa Market Volume (Metric Tons) Forecast by Form, 2020-2035
  • Table 77: Middle East and Africa Market Value (USD Billion) Forecast by Application, 2020-2035
  • Table 78: Middle East and Africa Market Volume (Metric Tons) Forecast by Application, 2020-2035
  • Table 79: Middle East and Africa Market Value (USD Billion) Forecast by Distribution Channel, 2020-2035
  • Table 80: Middle East and Africa Market Volume (Metric Tons) Forecast by Distribution Channel, 2020-2035

List of Figures

  • Figure 1: Global Market Volume (Metric Tons) Forecast 2020-2035
  • Figure 2: Global Market Pricing Analysis
  • Figure 3: Global Market Value (USD Billion) Forecast 2020-2035
  • Figure 4: Global Market Value Share and BPS Analysis by Type, 2025 and 2035
  • Figure 5: Global Market Y-o-Y Growth Comparison by Type, 2025-2035
  • Figure 6: Global Market Attractiveness Analysis by Type
  • Figure 7: Global Market Value Share and BPS Analysis by Form, 2025 and 2035
  • Figure 8: Global Market Y-o-Y Growth Comparison by Form, 2025-2035
  • Figure 9: Global Market Attractiveness Analysis by Form
  • Figure 10: Global Market Value Share and BPS Analysis by Application, 2025 and 2035
  • Figure 11: Global Market Y-o-Y Growth Comparison by Application, 2025-2035
  • Figure 12: Global Market Attractiveness Analysis by Application
  • Figure 13: Global Market Value Share and BPS Analysis by Distribution Channel, 2025 and 2035
  • Figure 14: Global Market Y-o-Y Growth Comparison by Distribution Channel, 2025-2035
  • Figure 15: Global Market Attractiveness Analysis by Distribution Channel
  • Figure 16: Global Market Value (USD Billion) Share and BPS Analysis by Region, 2025 and 2035
  • Figure 17: Global Market Y-o-Y Growth Comparison by Region, 2025-2035
  • Figure 18: Global Market Attractiveness Analysis by Region
  • Figure 19: North America Market Incremental $ Opportunity, 2025-2035
  • Figure 20: Latin America Market Incremental $ Opportunity, 2025-2035
  • Figure 21: Western Europe Market Incremental $ Opportunity, 2025-2035
  • Figure 22: Eastern Europe Market Incremental $ Opportunity, 2025-2035
  • Figure 23: East Asia Market Incremental $ Opportunity, 2025-2035
  • Figure 24: South Asia & Pacific Market Incremental $ Opportunity, 2025-2035
  • Figure 25: Middle East and Africa Market Incremental $ Opportunity, 2025-2035
  • Figure 26: North America Market Value Share and BPS Analysis by Country, 2025 and 2035
  • Figure 27: North America Market Value Share and BPS Analysis by Type, 2025 and 2035
  • Figure 28: North America Market Y-o-Y Growth Comparison by Type, 2025-2035
  • Figure 29: North America Market Attractiveness Analysis by Type
  • Figure 30: North America Market Value Share and BPS Analysis by Form, 2025 and 2035
  • Figure 31: North America Market Y-o-Y Growth Comparison by Form, 2025-2035
  • Figure 32: North America Market Attractiveness Analysis by Form
  • Figure 33: North America Market Value Share and BPS Analysis by Application, 2025 and 2035
  • Figure 34: North America Market Y-o-Y Growth Comparison by Application, 2025-2035
  • Figure 35: North America Market Attractiveness Analysis by Application
  • Figure 36: North America Market Value Share and BPS Analysis by Distribution Channel, 2025 and 2035
  • Figure 37: North America Market Y-o-Y Growth Comparison by Distribution Channel, 2025-2035
  • Figure 38: North America Market Attractiveness Analysis by Distribution Channel
  • Figure 39: Latin America Market Value Share and BPS Analysis by Country, 2025 and 2035
  • Figure 40: Latin America Market Value Share and BPS Analysis by Type, 2025 and 2035
  • Figure 41: Latin America Market Y-o-Y Growth Comparison by Type, 2025-2035
  • Figure 42: Latin America Market Attractiveness Analysis by Type
  • Figure 43: Latin America Market Value Share and BPS Analysis by Form, 2025 and 2035
  • Figure 44: Latin America Market Y-o-Y Growth Comparison by Form, 2025-2035
  • Figure 45: Latin America Market Attractiveness Analysis by Form
  • Figure 46: Latin America Market Value Share and BPS Analysis by Application, 2025 and 2035
  • Figure 47: Latin America Market Y-o-Y Growth Comparison by Application, 2025-2035
  • Figure 48: Latin America Market Attractiveness Analysis by Application
  • Figure 49: Latin America Market Value Share and BPS Analysis by Distribution Channel, 2025 and 2035
  • Figure 50: Latin America Market Y-o-Y Growth Comparison by Distribution Channel, 2025-2035
  • Figure 51: Latin America Market Attractiveness Analysis by Distribution Channel
  • Figure 52: Western Europe Market Value Share and BPS Analysis by Country, 2025 and 2035
  • Figure 53: Western Europe Market Value Share and BPS Analysis by Type, 2025 and 2035
  • Figure 54: Western Europe Market Y-o-Y Growth Comparison by Type, 2025-2035
  • Figure 55: Western Europe Market Attractiveness Analysis by Type
  • Figure 56: Western Europe Market Value Share and BPS Analysis by Form, 2025 and 2035
  • Figure 57: Western Europe Market Y-o-Y Growth Comparison by Form, 2025-2035
  • Figure 58: Western Europe Market Attractiveness Analysis by Form
  • Figure 59: Western Europe Market Value Share and BPS Analysis by Application, 2025 and 2035
  • Figure 60: Western Europe Market Y-o-Y Growth Comparison by Application, 2025-2035
  • Figure 61: Western Europe Market Attractiveness Analysis by Application
  • Figure 62: Western Europe Market Value Share and BPS Analysis by Distribution Channel, 2025 and 2035
  • Figure 63: Western Europe Market Y-o-Y Growth Comparison by Distribution Channel, 2025-2035
  • Figure 64: Western Europe Market Attractiveness Analysis by Distribution Channel
  • Figure 65: Eastern Europe Market Value Share and BPS Analysis by Country, 2025 and 2035
  • Figure 66: Eastern Europe Market Value Share and BPS Analysis by Type, 2025 and 2035
  • Figure 67: Eastern Europe Market Y-o-Y Growth Comparison by Type, 2025-2035
  • Figure 68: Eastern Europe Market Attractiveness Analysis by Type
  • Figure 69: Eastern Europe Market Value Share and BPS Analysis by Form, 2025 and 2035
  • Figure 70: Eastern Europe Market Y-o-Y Growth Comparison by Form, 2025-2035
  • Figure 71: Eastern Europe Market Attractiveness Analysis by Form
  • Figure 72: Eastern Europe Market Value Share and BPS Analysis by Application, 2025 and 2035
  • Figure 73: Eastern Europe Market Y-o-Y Growth Comparison by Application, 2025-2035
  • Figure 74: Eastern Europe Market Attractiveness Analysis by Application
  • Figure 75: Eastern Europe Market Value Share and BPS Analysis by Distribution Channel, 2025 and 2035
  • Figure 76: Eastern Europe Market Y-o-Y Growth Comparison by Distribution Channel, 2025-2035
  • Figure 77: Eastern Europe Market Attractiveness Analysis by Distribution Channel
  • Figure 78: East Asia Market Value Share and BPS Analysis by Country, 2025 and 2035
  • Figure 79: East Asia Market Value Share and BPS Analysis by Type, 2025 and 2035
  • Figure 80: East Asia Market Y-o-Y Growth Comparison by Type, 2025-2035
  • Figure 81: East Asia Market Attractiveness Analysis by Type
  • Figure 82: East Asia Market Value Share and BPS Analysis by Form, 2025 and 2035
  • Figure 83: East Asia Market Y-o-Y Growth Comparison by Form, 2025-2035
  • Figure 84: East Asia Market Attractiveness Analysis by Form
  • Figure 85: East Asia Market Value Share and BPS Analysis by Application, 2025 and 2035
  • Figure 86: East Asia Market Y-o-Y Growth Comparison by Application, 2025-2035
  • Figure 87: East Asia Market Attractiveness Analysis by Application
  • Figure 88: East Asia Market Value Share and BPS Analysis by Distribution Channel, 2025 and 2035
  • Figure 89: East Asia Market Y-o-Y Growth Comparison by Distribution Channel, 2025-2035
  • Figure 90: East Asia Market Attractiveness Analysis by Distribution Channel
  • Figure 91: South Asia & Pacific Market Value Share and BPS Analysis by Country, 2025 and 2035
  • Figure 92: South Asia & Pacific Market Value Share and BPS Analysis by Type, 2025 and 2035
  • Figure 93: South Asia & Pacific Market Y-o-Y Growth Comparison by Type, 2025-2035
  • Figure 94: South Asia & Pacific Market Attractiveness Analysis by Type
  • Figure 95: South Asia & Pacific Market Value Share and BPS Analysis by Form, 2025 and 2035
  • Figure 96: South Asia & Pacific Market Y-o-Y Growth Comparison by Form, 2025-2035
  • Figure 97: South Asia & Pacific Market Attractiveness Analysis by Form
  • Figure 98: South Asia & Pacific Market Value Share and BPS Analysis by Application, 2025 and 2035
  • Figure 99: South Asia & Pacific Market Y-o-Y Growth Comparison by Application, 2025-2035
  • Figure 100: South Asia & Pacific Market Attractiveness Analysis by Application
  • Figure 101: South Asia & Pacific Market Value Share and BPS Analysis by Distribution Channel, 2025 and 2035
  • Figure 102: South Asia & Pacific Market Y-o-Y Growth Comparison by Distribution Channel, 2025-2035
  • Figure 103: South Asia & Pacific Market Attractiveness Analysis by Distribution Channel
  • Figure 104: Middle East and Africa Market Value Share and BPS Analysis by Country, 2025 and 2035
  • Figure 105: Middle East and Africa Market Value Share and BPS Analysis by Type, 2025 and 2035
  • Figure 106: Middle East and Africa Market Y-o-Y Growth Comparison by Type, 2025-2035
  • Figure 107: Middle East and Africa Market Attractiveness Analysis by Type
  • Figure 108: Middle East and Africa Market Value Share and BPS Analysis by Form, 2025 and 2035
  • Figure 109: Middle East and Africa Market Y-o-Y Growth Comparison by Form, 2025-2035
  • Figure 110: Middle East and Africa Market Attractiveness Analysis by Form
  • Figure 111: Middle East and Africa Market Value Share and BPS Analysis by Application, 2025 and 2035
  • Figure 112: Middle East and Africa Market Y-o-Y Growth Comparison by Application, 2025-2035
  • Figure 113: Middle East and Africa Market Attractiveness Analysis by Application
  • Figure 114: Middle East and Africa Market Value Share and BPS Analysis by Distribution Channel, 2025 and 2035
  • Figure 115: Middle East and Africa Market Y-o-Y Growth Comparison by Distribution Channel, 2025-2035
  • Figure 116: Middle East and Africa Market Attractiveness Analysis by Distribution Channel
  • Figure 117: Global Market - Tier Structure Analysis
  • Figure 118: Global Market - Company Share Analysis

Frequently Asked Questions

How big is the torula yeast market in 2025?

The global torula yeast market is estimated to be valued at USD 2.6 billion in 2025.

What will be the size of torula yeast market in 2035?

The torula yeast market size is projected to reach USD 3.7 billion by 2035.

How much will be the torula yeast market growth between 2025 and 2035?

The torula yeast market is expected to grow at a 3.7% CAGR between 2025 and 2035.

Which application segment is projected to lead in the torula yeast market in 2025?

The food industry segment is projected to lead in the torula yeast market with 65% market share in 2025.

Which distribution channel is expected to contribute significant share in the torula yeast market in 2025?

In terms of distribution channel, store-based retail is expected to command 60% share in the torula yeast market in 2025.

Explore Similar Insights

Future Market Insights

Torula Yeast Market