
- Market Size (2026)
- USD 2093.8 Mn
- Forecast (2036)
- USD 4690.6 Mn
- CAGR (2026 to 2036)
- 8.4%
How big is the UK photovoltaic mounting system market in 2026?
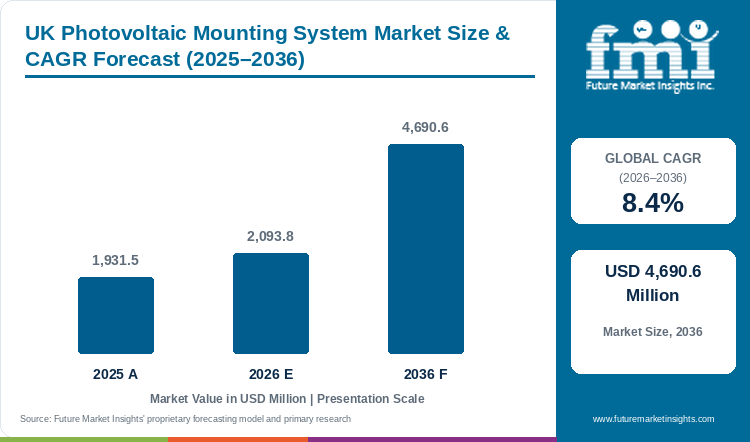
The market was valued at USD 1,931.5 million in 2025 and is estimated to reach USD 2,093.8 million in 2026. It is projected to grow at a CAGR of 8.4% from 2026 to 2036 and reach USD 4,690.6 million by 2036.
In the United Kingdom, demand for photovoltaic mounting systems follows the number and type of solar installations, and rooftop projects are now the main source of orders. New-build requirements, higher energy prices and an official 2030 capacity goal are reinforcing that demand, and the market is expected to keep growing steadily through 2036. The government reports nearly 172,000 solar installations across the UK since the start of 2026, and capacity reached 22.3 GW at the end of April 2026, a rise of 2.3 GW over the previous 12 months, against an ambition of 45.0 to 47.0 GW by 2030. Higher energy prices after the outbreak of war in Iran earlier in 2026 have added to interest in solar, and each of these installations needs a mounting kit that suits the roof or the site. Because the structure carries the panels for the life of the system, installers choose kits on compatibility, wind resistance and clear fitting instructions as well as on price. Against that background, the market is estimated to grow by 8.4% in 2026, from USD 1,931.5 million to USD 2,093.8 million, as installation numbers rise.
Market Size & Forecast
Table 1: UK Photovoltaic Mounting System Market Size and Forecast (USD million and CAGR percentage), 2025 to 2036
| Market size and forecast | Value |
|---|---|
| 2025 Value | USD 1,931.5 million |
| Estimated market size in 2026 | USD 2,093.8 million |
| Projected market size by 2036 | USD 4,690.6 million |
| CAGR (2026-2036) | 8.4% |
| Added revenue, 2026 to 2036 | USD 2,596.8 million |
Capacity by site type shows where mounting orders will come from. Under the current-policy scenario in the Solar Roadmap, about 60% to 65% of 2030 solar capacity is in large-scale projects, about 20% on domestic rooftops and 15% to 20% on commercial rooftops and ground-mounted sites, so the USD 2,596.8 million added between 2026 and 2036 combines many small rooftop orders with fewer, larger orders for ground-mounted structures.
Market Value and Growth
Table 2: Market Value and Growth for the UK Photovoltaic Mounting System Market (USD million and CAGR percentage), 2025 to 2036
| Market size and forecast | Value |
|---|---|
| 2025 Value | USD 1,931.5 million |
| 2026 Value | USD 2,093.8 million |
| 2036 Value | USD 4,690.6 million |
| 2026 to 2036 CAGR | 8.4% |
Key Market Trends & Insights
- Rooftop systems are expected to lead the product type segment in 2026, while ground-mounted and carport structures serve sites where panels stand apart from a building.
- Rooftop solar accounted for more than seven in ten solar installations in July 2026.
- Business-to-business sales are the most significant channel, as professional installers, distributors and project developers buy the kits.
Regional Highlights
- The South East recorded 22,628 installations so far in 2026, taking its total to 305,101, while the East of England recorded 18,109, taking its total to 241,195.
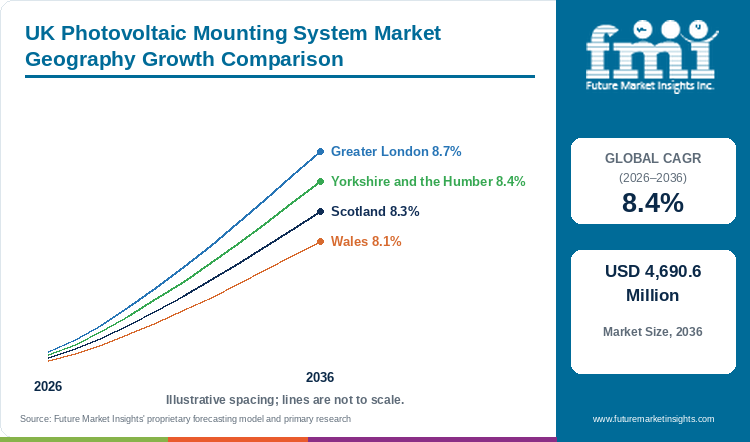
- Greater London is likely to grow at an 8.7% CAGR during the forecast period, followed by Yorkshire and the Humber at 8.4%, Scotland at 8.3% and Wales at 8.1%.
Analyst Perspective
“Mounting is the part of a solar project that has to fit the building or the site, so compatibility and clear fixing details count for as much as price. Suppliers that give installers a complete kit, accurate documents and delivery timed to the job will earn repeat orders, whether the roof belongs to a house or a warehouse.”
- Nikhil Kaitwade, Principal Consultant, Future Market Insights.
How is the UK photovoltaic mounting system market segmented?
The UK photovoltaic mounting system market is segmented by product type, sales channel, material, technology, end use and region. By product type, the market is sub segmented into rooftop, ground-mounted and carport mounting structures. By sales channel, it is sub segmented into business to business and business to customer, and by material into aluminium, steel and other materials. By technology, it is sub segmented into fixed and tracking, by end use into residential, commercial, industrial, municipal and government facilities and other uses, and by region into Greater London, Yorkshire and the Humber, Scotland and Wales, among others.
Why are rooftop systems the leading segment by product type?
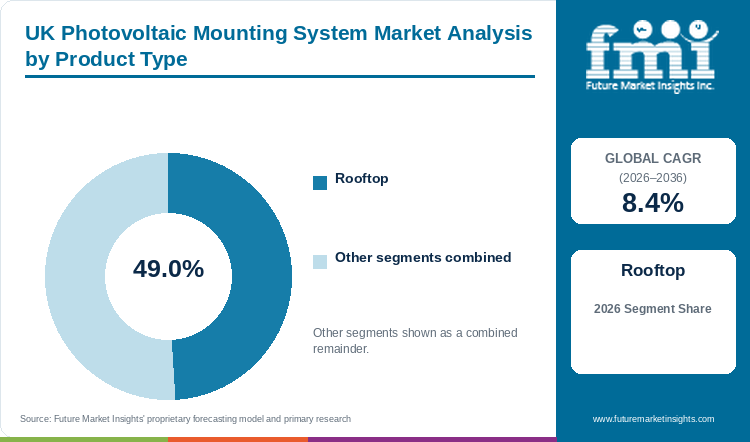
The rooftop segment is estimated to account for 49.0% of revenue by product type in 2026. This share is an FMI estimate.
Table 3: Product Type Share for the UK Photovoltaic Mounting System Market (percentage share of revenue), 2026 — FMI estimate
| Segment | Share (2026) |
|---|---|
| Rooftop | 49.0% |
| Other segments combined | 51.0% |
Source: Future Market Insights estimate.
A rooftop kit fixes panels to a building that already exists, so the roof sets what the kit has to do. MCS 012 Issue 3.0, the Solar Mounting Standard, requires guidance on compatible solar panels and roof systems, including the type and number of fixings and the maximum recommended spacing of brackets and rails. The installation instructions must also state the maximum wind load the system achieved and set out limits on the array, such as maximum module area and fixings per square metre. Kits that rely on through-bolts must not depend on site-applied silicone or mastic alone to keep the roof weathertight. These requirements put the information an installer needs in front of them before work starts, so a supplier’s rooftop offer is a kit together with the documents that let the installer match it to the roof and panel. Where a customer changes the panel, the same documents show whether the existing kit still fits.
Why is business to business the leading segment by sales channel?
The business to business segment is estimated to account for 61.0% of revenue by sales channel in 2026. This share is an FMI estimate.
Table 4: Sales Channel Share for the UK Photovoltaic Mounting System Market (percentage share of revenue), 2026 — FMI estimate
| Segment | Share (2026) |
|---|---|
| Business to business | 61.0% |
| Other segments combined | 39.0% |
Source: Future Market Insights estimate.
Business-to-business buyers are professional installers, distributors and project developers, and they purchase mounting kits as one part of a larger scope of work. Commercial roofs are becoming easier to equip: the Solar Roadmap records that the 1 MW cap that required planning permission for non-domestic rooftop solar has been removed, and that the UK Warehousing Association and the logistics industry will work on lease arrangements that accommodate rooftop solar. Each of these buyers needs technical information that supports specification and delivery that fits the construction schedule. A distributor needs to know which components belong together, and a developer needs to know when the complete structure can be installed. Clear component schedules and realistic availability therefore carry real weight in the purchase, and a continuing supplier relationship usually develops around accurate specifications and dependable fulfilment.
How does material shape mounting selection?
Material coverage includes aluminium, steel and other materials. Material choice affects structural design, corrosion protection and handling on site. Suppliers need to explain compatibility and the intended application of each product.
How does technology shape mounting design?
Technology coverage includes fixed and tracking systems. Fixed structures hold a set position, while tracking systems incorporate moving equipment. Site conditions, access for maintenance and the planned array layout influence the choice.
How does end use shape procurement?
End-use coverage includes residential, commercial, industrial, municipal and government facilities, and other uses. Customers need mounting products suited to the roof or site and information that supports their installation schedule. Larger developments can involve coordinated batch deliveries.
What are the drivers, restraints and opportunities in the UK photovoltaic mounting system market?
In the UK photovoltaic mounting system market, rooftop solar on new and existing buildings supports an 8.4% CAGR through 2036. At the same time, planning limits on ground-mounted sites, weather exposure and metal price swings restrain faster expansion.
Driver: Lower installed costs support solar deployment. Falling installed costs make solar worth fitting for more households and businesses, and every system needs a mounting kit. Median installed costs in 2025/26 were 9% lower for systems of 0 to 4 kW and 8% lower for 4 to 10 kW than in 2024/25, after inflation.
Restraint: Site requirements and metal costs constrain supply. Large ground-mounted projects face planning and land-use limits, Britain’s weather adds wind and rain requirements to every structure, and steel and aluminium prices move with commodity markets, so a kit priced well before delivery can cost more to make than planned. Each of these raises the cost or the lead time of a mounting order.
Opportunity: New-home standards support planned demand. New-build housing gives suppliers planned, repeat orders. In England, 55,773 new-build homes were fitted with solar in the first half of 2026, 58% of those built in the period, and England’s Future Homes and Buildings Standards introduce an on-site renewable electricity requirement for new dwellings. The changes take effect from 24 March 2027 for non-higher-risk building work and from 24 September 2027 for higher-risk building work, subject to transitional provisions.
UK Photovoltaic Mounting System Market by Region (2026 to 2036)
Table 5: Regional Growth Outlook for the UK Photovoltaic Mounting System Market (CAGR percentage), 2026 to 2036
| Region | CAGR (2026-2036) |
|---|---|
| Greater London | 8.7% |
| Yorkshire and the Humber | 8.4% |
| Scotland | 8.3% |
| Wales | 8.1% |
Source: Future Market Insights forecasts. The four regional profiles are selected markets within the United Kingdom.
How is mounting demand developing in Greater London?
Greater London is likely to grow at an 8.7% CAGR during the forecast period.
A mounting kit has to suit the roof it is fitted to, and the roof types found in a large city vary from one building to the next. MCS 012 Issue 3.0 covers building-roof mounting products, including flat-roof systems, so a supplier serving London installers needs to state the roof type each kit is designed for. Installations rose in every English region in the 12 months to July 2026, London included, and installers need kits that arrive complete for each job. Complete kit lists, compatible panel details and delivery that matches site access let an installer plan the work before arriving. For suppliers, the London opportunity lies in dependable fulfilment of varied orders, backed by documents that answer compatibility questions before the kit is ordered.
What does the consent pipeline mean for mounting demand in Yorkshire and the Humber?
Yorkshire and the Humber is likely to grow at an 8.4% CAGR during the forecast period.
Large ground-mounted schemes have recently won consent in the region. The Fenwick Solar Farm in South Yorkshire was granted development consent on 18 February 2026 for ground mounted solar panels, a battery energy storage system and a connection at Thorpe Marsh substation, and RWE’s Peartree Hill Solar Farm in the East Riding of Yorkshire, of up to 320 MW, was granted consent on 2 July 2026. Consent is the point from which developers plan procurement, so frames and foundations for such sites are bought in large batches and delivered in line with the construction programme. A supplier that can publish foundation and layout requirements early, and deliver structures in the order that site crews assemble them, is better placed to win these orders than one competing on unit price alone.
How are Scotland’s solar plans shaping demand for mounting systems?
Scotland is likely to grow at an 8.3% CAGR during the forecast period.
Scotland’s cumulative solar capacity stood at 0.9 GW at the end of the first quarter of 2026, with a pipeline of 3.4 GW, of which 0.2 GW is under construction and 1.7 GW awaiting construction. The projects awaiting construction are the main source of future structure orders, while Scotland’s total number of installations was 14% higher than a year earlier. Wind and rain make the weather performance of a mounting system part of the buying decision, so suppliers that explain wind resistance and corrosion protection clearly help customers compare offers. A fixed structure holds a set position, whereas a tracking design adds moving equipment that must be reached for servicing, and that choice matters more on exposed sites.
What does Wales’s installation growth mean for mounting suppliers?
Wales is likely to grow at an 8.1% CAGR during the forecast period.
Wales had 144,888 solar installations at the end of July 2026, up from 122,317 a year earlier, the fastest growth of any UK nation. A market made up of many individual installations rewards suppliers that deliver a complete kit for each job, because a missing bracket or rail can hold up a whole installation. Orders can also change between quotation and fitting, for example when a customer selects a different panel, so an up-to-date component list helps the installer confirm that the kit still fits. Suppliers serving Wales gain from handling these revisions promptly and keeping the agreed specification tied to the order.
Who are the notable companies in the UK photovoltaic mounting system market?
Mounting suppliers sell to installers, distributors and project developers, and their ranges differ by roof type, site type and the documents that come with the product. Solarport Systems, Esdec, K2 Systems and Viridian Solar are the companies covered in this report. Their offers differ: some focus on large ground-mounted structures, others on pitched roofs or roof-integrated panels.
Key Developments in the UK Photovoltaic Mounting System Market
- July 2026 was the third-highest month on record for UK solar installations, with nearly 28,000 completed, behind only March and June.
- A new permitted development right allows solar canopies on non-domestic off-street car parks in England, according to the Solar Roadmap.
- More mid-sized ground-mounted projects are now decided through local planning, after the threshold for national consent was raised from 50 MW to 100 MW.
Key Players in the UK Photovoltaic Mounting System Market
- Solarport Systems
- Esdec
- K2 Systems
- Viridian Solar
This Report Answers
- How large is the UK photovoltaic mounting system market in 2026?
- What is the 2036 forecast?
- What is the added revenue between 2026 and 2036?
- Which product type leads the market?
- Which sales channel leads the market?
- Which region is likely to grow the fastest?
UK Photovoltaic Mounting System Market - Report Scope
Table 6: Report Scope for the UK Photovoltaic Mounting System Market (coverage fields and definitions), 2026 to 2036
| Coverage field | Report scope |
|---|---|
| Market breakdown | Product Type (Rooftop, Ground Mounted, Carport Mounting Structure); Sales Channel (Business to Business, Business to Customer); Material (Aluminium, Steel, Others); Technology (Fixed, Tracking); End Use (Residential, Commercial, Industrial, Municipal and Government Facilities, Others) |
| Quantitative Units | Revenue in USD million and CAGR from 2026 to 2036 |
| Market Definition | Photovoltaic mounting systems sold in the United Kingdom for rooftop, ground-mounted and carport installations, by product type, sales channel, material, technology and end use |
| Regions Covered | United Kingdom, with Greater London, Yorkshire and the Humber, Scotland and Wales profiled |
| Key Companies Covered | Solarport Systems, Esdec, K2 Systems and Viridian Solar |
| Forecast Period | 2026 to 2036 (with 2025 historical baseline) |
| Approach | Combined primary interviews, secondary literature analysis, and top-down data triangulation |
| Countries Covered | United Kingdom |
| Regional Profiles | Greater London, Yorkshire and the Humber, Scotland, Wales |
| Geography Scope | The United Kingdom is the national market. Greater London and Yorkshire and the Humber are English regional profiles; Scotland and Wales are constituent nation profiles. These selected profiles do not exhaust UK coverage. |
UK Photovoltaic Mounting System Market - Research Methodology
The market assessment combines primary interviews with industry participants and secondary research drawn from company disclosures, trade data and industry publications. Market size is built from supply-side and demand-side estimates and validated top-down, and segment shares and competitive positioning are checked through data triangulation before publication.
UK Photovoltaic Mounting System Market by Segments
By Product Type
- Rooftop
- Ground mounted
- Carport mounting structure
By Sales Channel
- Business to business
- Business to customer
By Material
- Aluminium
- Steel
- Others
By Technology
- Fixed
- Tracking
By End Use
- Residential
- Commercial
- Industrial
- Municipal and government facilities
- Others
UK Photovoltaic Mounting System Market by Region
- Greater London
- Yorkshire and the Humber
- Scotland
- Wales
Research Sources and Bibliography
- [1] UK Department for Energy Security and Net Zero. First regional solar breakdown as installations hit record highs. 27 August 2026.
- [2] UK Government. Solar Roadmap: United Kingdom powered by solar. 2025.
- [3] MCS. MCS 012 Issue 3.0: The Solar Mounting Standard (Product), dated 10 May 2023; implementation 10 May 2025.
- [4] Ministry of Housing, Communities and Local Government. The Future Homes and Buildings Standards: Building Circular 01/2026. 24 March 2026.
- [5] Solar Power Portal. 2026 ‘record year’ for UK rooftop solar installations, as Iran war hikes energy prices. 16 September 2026.
- [6] pv magazine. UK hits 22.3 GW solar capacity as cost per kW falls. 4 June 2026.
- [7] pv magazine. Scotland’s solar capacity reaches 0.9 GW. 1 July 2026.
- [8] Nation.Cymru. Wales leads UK as solar installations rise by more than 18%. 28 August 2026.
- [9] RWE. Development consent order granted for RWE’s Peartree Hill Solar Farm project. 2 July 2026.
- [10] UK Government. Fenwick Solar Farm: development consent order, Planning Act 2008. 18 February 2026.
- [11] Energy Global. Solarport secures new funding and expands to new site. 3 October 2025.
- [12] Enstall. About Enstall (company website).
- [13] K2 Systems. Press and media, 2026 releases (company website).
- [14] pv magazine. Viridian Solar offers new solutions to integrate PV systems with roof windows. 20 November 2025.
Table of Content
- Key Takeaways
- Market Size and CAGR
- Top Growth Driver
- Fastest Growing Segment
- Leading Region
- Key Companies
- Emerging Opportunities
- Executive Summary
- Global Market Outlook
- Demand-side Trends
- Supply-side Trends
- Technology Roadmap Analysis
- Analysis and Recommendations
- Analyst Perspective (What is happening? Why now? What should investors know?)
- Key Questions Answered
- How large is the market?
- What is the CAGR?
- What are key trends?
- Which region dominates?
- Who are the leaders?
Read More...
- Market Overview
- Market Coverage / Taxonomy
- Market Definition / Scope / Limitations
- Research Methodology
- Chapter Orientation
- Analytical Lens and Working Hypotheses
- Market Structure, Signals, and Trend Drivers
- Benchmarking and Cross-market Comparability
- Market Sizing, Forecasting, and Opportunity Mapping
- Research Design and Evidence Framework
- Desk Research Programme (Secondary Evidence)
- Expert Input and Fieldwork (Primary Evidence)
- Tooling, Models, and Reference Databases
- Data Engineering and Model Build
- Quality Assurance and Audit Trail
- Market Background
- Market Dynamics (Drivers, Restraints, Opportunity, Trends)
- Scenario Forecast (Optimistic, Likely, Conservative)
- Impact Analysis
- AI Impact
- Sustainability Impact
- Regulatory Impact
- Technology Impact
- Consumer / Buyer Analysis
- Purchase Drivers
- Adoption Barriers
- Buyer Journey
- Opportunity Map Analysis
- Product Life Cycle Analysis
- Supply Chain Analysis
- Investment Feasibility Matrix
- Value Chain Analysis
- PESTLE and Porter's Analysis
- Regulatory Landscape
- Regional Parent Market Outlook
- Production and Consumption Statistics
- Import and Export Statistics
- Global Market Analysis and Forecast, 2021 to 2036
- Historical Market Size Value (USD Million) Analysis, 2021 to 2025
- Current and Future Market Size Value (USD Million) Projections, 2026 to 2036
- Y-o-Y Growth Trend Analysis
- Absolute $ Opportunity Analysis
- Global Market Pricing Analysis, 2021 to 2036
- Global Market Analysis and Forecast, By Product Type, 2021 to 2036
- Introduction / Key Findings
- Historical Market Size Value (USD Million) Analysis By Product Type, 2021 to 2025
- Current and Future Market Size Value (USD Million) Analysis and Forecast By Product Type, 2026 to 2036
- Rooftop
- Ground mounted
- Carport mounting structure
- Y-o-Y Growth Trend Analysis By Product Type, 2021 to 2025
- Absolute $ Opportunity Analysis By Product Type, 2026 to 2036
- Global Market Analysis and Forecast, By Sales Channel, 2021 to 2036
- Introduction / Key Findings
- Historical Market Size Value (USD Million) Analysis By Sales Channel, 2021 to 2025
- Current and Future Market Size Value (USD Million) Analysis and Forecast By Sales Channel, 2026 to 2036
- Business to business
- Business to customer
- Y-o-Y Growth Trend Analysis By Sales Channel, 2021 to 2025
- Absolute $ Opportunity Analysis By Sales Channel, 2026 to 2036
- Global Market Analysis and Forecast, By Material, 2021 to 2036
- Introduction / Key Findings
- Historical Market Size Value (USD Million) Analysis By Material, 2021 to 2025
- Current and Future Market Size Value (USD Million) Analysis and Forecast By Material, 2026 to 2036
- Aluminium
- Steel
- Others
- Y-o-Y Growth Trend Analysis By Material, 2021 to 2025
- Absolute $ Opportunity Analysis By Material, 2026 to 2036
- Global Market Analysis and Forecast, By Technology, 2021 to 2036
- Introduction / Key Findings
- Historical Market Size Value (USD Million) Analysis By Technology, 2021 to 2025
- Current and Future Market Size Value (USD Million) Analysis and Forecast By Technology, 2026 to 2036
- Fixed
- Tracking
- Y-o-Y Growth Trend Analysis By Technology, 2021 to 2025
- Absolute $ Opportunity Analysis By Technology, 2026 to 2036
- Global Market Analysis and Forecast, By End Use, 2021 to 2036
- Introduction / Key Findings
- Historical Market Size Value (USD Million) Analysis By End Use, 2021 to 2025
- Current and Future Market Size Value (USD Million) Analysis and Forecast By End Use, 2026 to 2036
- Residential
- Commercial
- Industrial
- Municipal and government facilities
- Others
- Y-o-Y Growth Trend Analysis By End Use, 2021 to 2025
- Absolute $ Opportunity Analysis By End Use, 2026 to 2036
- Global Market Analysis and Forecast, By Region, 2021 to 2036
- Introduction
- Historical Market Size Value (USD Million) Analysis By Region, 2021 to 2025
- Current Market Size Value (USD Million) Analysis and Forecast By Region, 2026 to 2036
- UK
- Market Attractiveness Analysis By Region
- UK Market Analysis and Forecast, By Region
- Historical Market Size Value (USD Million) Trend Analysis By Market Taxonomy, 2021 to 2025
- Market Size Value (USD Million) Forecast By Market Taxonomy, 2026 to 2036
- By Region
- Greater London
- Yorkshire and the Humber
- Scotland
- Wales
- By Product Type
- By Sales Channel
- By Material
- By Technology
- By End Use
- By Region
- Market Attractiveness Analysis
- By Country
- By Product Type
- By Sales Channel
- By Material
- By Technology
- By End Use
- Key Takeaways
- Key Regions Market Analysis
- Greater London
- Pricing Analysis
- Market Share Analysis, 2025
- By Product Type
- By Sales Channel
- By Material
- By Technology
- By End Use
- Yorkshire and the Humber
- Pricing Analysis
- Market Share Analysis, 2025
- By Product Type
- By Sales Channel
- By Material
- By Technology
- By End Use
- Scotland
- Pricing Analysis
- Market Share Analysis, 2025
- By Product Type
- By Sales Channel
- By Material
- By Technology
- By End Use
- Wales
- Pricing Analysis
- Market Share Analysis, 2025
- By Product Type
- By Sales Channel
- By Material
- By Technology
- By End Use
- Greater London
- Market Structure Analysis
- Competition Dashboard
- Competition Benchmarking
- Market Share Analysis of Top Players
- By Regional
- By Product Type
- By Sales Channel
- By Material
- By Technology
- By End Use
- Emerging Startups
- Innovation Benchmarking
- Competition Analysis
- Competition Deep Dive
- Solarport Systems
- Overview
- Product Portfolio
- Profitability by Market Segments
- Sales Footprint
- Strategy Overview
- Marketing Strategy
- Product Strategy
- Channel Strategy
- Esdec
- K2 Systems
- Viridian Solar
- Solarport Systems
- Case Studies
- Success Stories
- Recent Developments
- Competition Deep Dive
- Assumptions & Acronyms Used
List of Tables
- Table 1: Global Market Value (USD Million) Forecast by Region, 2021 to 2036
- Table 2: Global Market Value (USD Million) Forecast by Product Type, 2021 to 2036
- Table 3: Global Market Value (USD Million) Forecast by Sales Channel, 2021 to 2036
- Table 4: Global Market Value (USD Million) Forecast by Material, 2021 to 2036
- Table 5: Global Market Value (USD Million) Forecast by Technology, 2021 to 2036
- Table 6: Global Market Value (USD Million) Forecast by End Use, 2021 to 2036
- Table 7: UK Market Value (USD Million) Forecast by Country, 2021 to 2036
- Table 8: UK Market Value (USD Million) Forecast by Product Type, 2021 to 2036
- Table 9: UK Market Value (USD Million) Forecast by Sales Channel, 2021 to 2036
- Table 10: UK Market Value (USD Million) Forecast by Material, 2021 to 2036
- Table 11: UK Market Value (USD Million) Forecast by Technology, 2021 to 2036
- Table 12: UK Market Value (USD Million) Forecast by End Use, 2021 to 2036
List of Figures
- Figure 1: Global Market Pricing Analysis
- Figure 2: Global Market Value (USD Million) Forecast 2021-2036
- Figure 3: Global Market Value Share and BPS Analysis by Product Type, 2026 and 2036
- Figure 4: Global Market Y-o-Y Growth Comparison by Product Type, 2026-2036
- Figure 5: Global Market Attractiveness Analysis by Product Type
- Figure 6: Global Market Value Share and BPS Analysis by Sales Channel, 2026 and 2036
- Figure 7: Global Market Y-o-Y Growth Comparison by Sales Channel, 2026-2036
- Figure 8: Global Market Attractiveness Analysis by Sales Channel
- Figure 9: Global Market Value Share and BPS Analysis by Material, 2026 and 2036
- Figure 10: Global Market Y-o-Y Growth Comparison by Material, 2026-2036
- Figure 11: Global Market Attractiveness Analysis by Material
- Figure 12: Global Market Value Share and BPS Analysis by Technology, 2026 and 2036
- Figure 13: Global Market Y-o-Y Growth Comparison by Technology, 2026-2036
- Figure 14: Global Market Attractiveness Analysis by Technology
- Figure 15: Global Market Value Share and BPS Analysis by End Use, 2026 and 2036
- Figure 16: Global Market Y-o-Y Growth Comparison by End Use, 2026-2036
- Figure 17: Global Market Attractiveness Analysis by End Use
- Figure 18: Global Market Value (USD Million) Share and BPS Analysis by Region, 2026 and 2036
- Figure 19: Global Market Y-o-Y Growth Comparison by Region, 2026-2036
- Figure 20: Global Market Attractiveness Analysis by Region
- Figure 21: UK Market Incremental Dollar Opportunity, 2026-2036
- Figure 22: UK Market Value Share and BPS Analysis by Country, 2026 and 2036
- Figure 23: UK Market Value Share and BPS Analysis by Product Type, 2026 and 2036
- Figure 24: UK Market Y-o-Y Growth Comparison by Product Type, 2026-2036
- Figure 25: UK Market Attractiveness Analysis by Product Type
- Figure 26: UK Market Value Share and BPS Analysis by Sales Channel, 2026 and 2036
- Figure 27: UK Market Y-o-Y Growth Comparison by Sales Channel, 2026-2036
- Figure 28: UK Market Attractiveness Analysis by Sales Channel
- Figure 29: UK Market Value Share and BPS Analysis by Material, 2026 and 2036
- Figure 30: UK Market Y-o-Y Growth Comparison by Material, 2026-2036
- Figure 31: UK Market Attractiveness Analysis by Material
- Figure 32: UK Market Value Share and BPS Analysis by Technology, 2026 and 2036
- Figure 33: UK Market Y-o-Y Growth Comparison by Technology, 2026-2036
- Figure 34: UK Market Attractiveness Analysis by Technology
- Figure 35: UK Market Value Share and BPS Analysis by End Use, 2026 and 2036
- Figure 36: UK Market Y-o-Y Growth Comparison by End Use, 2026-2036
- Figure 37: UK Market Attractiveness Analysis by End Use
- Figure 38: Global Market - Tier Structure Analysis
- Figure 39: Global Market - Company Share Analysis
Frequently Asked Questions
How large is the UK photovoltaic mounting system market in 2026?
The UK photovoltaic mounting system market is estimated at USD 2,093.8 million in 2026.
What is the 2036 forecast?
The market is projected to reach USD 4,690.6 million by 2036 at an 8.4% CAGR from 2026 to 2036.
What is the added revenue between 2026 and 2036?
The market is projected to add USD 2,596.8 million between 2026 and 2036.
Which product type leads the market?
The rooftop segment is estimated to account for 49.0% of revenue by product type in 2026, based on FMI estimates.
Which sales channel leads the market?
The business to business segment is estimated to account for 61.0% of revenue by sales channel in 2026, based on FMI estimates.
Which region is likely to grow the fastest?
Greater London is likely to grow at an 8.7% CAGR during the forecast period, ahead of Yorkshire and the Humber at 8.4%, Scotland at 8.3% and Wales at 8.1%. Competitive Analysis of the UK Photovoltaic Mounting System Market Key Players
Preview the report firsthand - request a free sample
Get SampleGet the brochure for pricing and purchase details.
Get PDF
