The USA acetaminophen API demand is valued at USD 500 million in 2025 and is expected to reach USD 700 million by 2035, recording a CAGR of 3.2%. Demand is supported by stable consumption of analgesic and antipyretic products, continued use of combination formulations, and consistent requirements from pharmaceutical manufacturers supplying prescription and over-the-counter medicines. Acetaminophen remains a core active ingredient across adult and pediatric pain-relief products, reinforcing steady procurement from API suppliers.
Acetaminophen API combined with opioids represents the leading drug class, driven by its established role in controlled prescription formulations used for moderate pain management. These combinations require tightly controlled API specifications, production traceability, and compliance with regulatory standards governing potency, purity, and supply security. Manufacturers continue to prioritise quality assurance, validated synthesis routes, and contamination-free production environments.
Demand is strongest in the West, South, and Northeast, where pharmaceutical manufacturing capacity, distribution networks, and healthcare utilisation rates are concentrated. Key suppliers include Pfizer, Johnson & Johnson, Bayer AG, Sanofi S.A., and GlaxoSmithKline plc. Their activities focus on consistent API quality, regulatory-aligned production processes, and secure supply chain management for domestic formulation facilities.
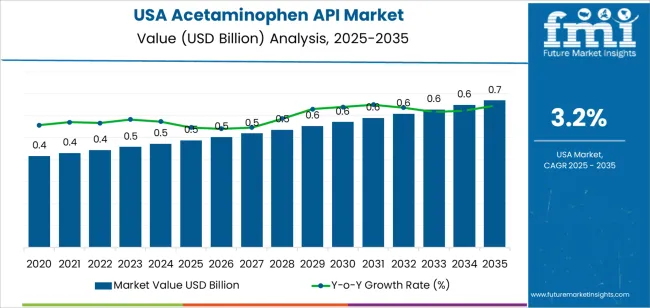
The early growth curve from 2025 to 2029 will show modest acceleration driven by steady demand for over-the-counter analgesics, stable domestic formulation activity, and ongoing efforts to diversify API sourcing. Investments in compliance, quality systems, and supply-chain resilience will shape early procurement cycles. Incremental shifts toward local production capacity will also support moderate early-stage gains.
From 2030 to 2035, the late growth curve will move toward a more stable, slower trajectory as consumption patterns in analgesics reach maturity and production capacity aligns with predictable domestic needs. Growth during this period will be anchored in replacement demand, regulatory maintenance costs, and routine manufacturing upgrades rather than large-scale expansion. Increased process efficiency and improved traceability systems will support consistent operations without materially altering volume trends. The comparison reflects a transition from early supply-chain-driven adjustments to a mature phase characterised by steady demand, long product lifecycles, and incremental modernisation across USA acetaminophen API production.
| Metric | Value |
|---|---|
| USA Acetaminophen API Sales Value (2025) | USD 500 million |
| USA Acetaminophen API Forecast Value (2035) | USD 700 million |
| USA Acetaminophen API Forecast CAGR (2025-2035) | 3.2% |
The demand for acetaminophen active pharmaceutical ingredient (API) in the USA is rising because manufacturers rely on this ingredient for widely used over-the-counter analgesic and antipyretic medications. Growth in chronic pain conditions, fever-related illnesses and combination drug formulations drives need for steady API supply. The expansion of generic pharmaceutical production and demand for efficient pain-management solutions encourage procurement of acetaminophen API.
Suppliers meeting stringent FDA quality standards also support higher usage in US pharmaceutical manufacturing. Advancements in API production methods and investment in domestic supply chains enhance accessibility. Growth is moderated by fluctuations in raw-material cost, regulatory scrutiny concerning manufacturing compliance and competition from alternative APIs or pain-relief technologies. Some formulators may shift toward newer molecules or combination therapies, which could limit long-term growth in pure acetaminophen API volumes.
Demand for acetaminophen API in the United States reflects its wide therapeutic use in analgesic and antipyretic formulations. Industry distribution across drug class, distribution channels, and sales types aligns with clinical demand patterns, purchasing structures, and the prominence of combination medicines in pain-management settings.
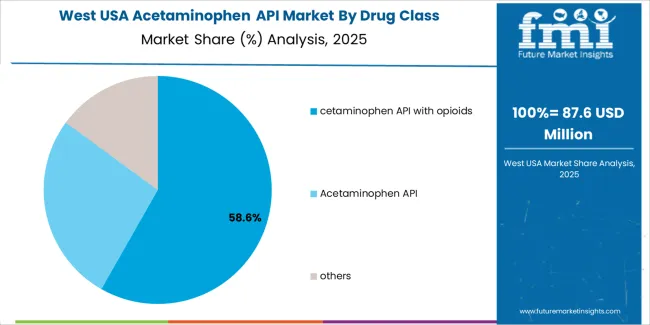
Acetaminophen API combined with opioids holds 58.0% of USA demand, representing the largest drug-class segment. These formulations are used in controlled clinical settings for moderate to severe pain management, where combination tablets and liquids offer synergistic analgesic effects. The high share reflects their continued prescription in postoperative care, injury treatment, and select chronic pain cases. Standalone acetaminophen API accounts for 27.0%, supporting over-the-counter pain and fever medications. These formulations maintain broad usage due to accessibility, established safety profiles, and their role as first-line analgesics. The remaining 15.0% comprises other combination or specialized formulations used in specific therapeutic cases.
Key drivers and attributes:
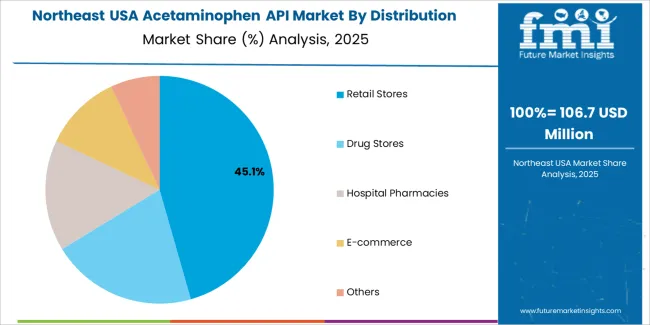
Retail stores hold 45.1% of USA demand for acetaminophen-containing formulations, making them the leading distribution channel. Their share reflects widespread consumer use of OTC acetaminophen products for self-managed pain and fever. Drug stores account for 20.5%, supported by pharmacist-led purchasing and routine consumer access. Hospital pharmacies represent 15.6%, reflecting inpatient and emergency care usage, particularly for combination analgesics. E-commerce channels hold 10.9%, driven by rising online purchasing of OTC medications. The remaining 6.9% includes institutional supply chains and specialty distributors.
Key drivers and attributes:
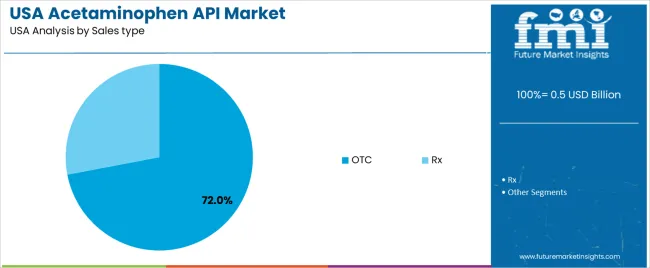
Over-the-counter formulations hold an estimated 72.0% share of USA demand for acetaminophen-based medicines. Their dominance reflects widespread consumer reliance on acetaminophen for common headaches, fevers, musculoskeletal discomfort, and cold symptoms. OTC availability supports frequent, small-quantity purchasing across retail and online channels. Prescription (Rx) products account for 28.0%, driven primarily by combination acetaminophen-opioid formulations used in controlled clinical scenarios. Rx demand reflects regulated prescribing patterns, documentation requirements, and clinical oversight.
Key drivers and attributes:
Demand for acetaminophen API in the United States is supported by its status as a key active pharmaceutical ingredient for over-the-counter analgesics and antipyretics. Drug manufacturers rely on acetaminophen API to formulate low-cost, high-volume tablets, capsules, and liquid syrups. Expanding capacity in generic drug production and increased manufacturing of combination formulations containing acetaminophen contribute to stable consumption of the API. Pharmaceutical companies seeking to maintain supply integrity, control costs, and respond to evolving regulatory and quality-standards requirements are reinforcing API demand in the domestic industry.
The acetaminophen API industry in the USA faces challenges due to reliance on global chemical supply chains, which may be affected by trade restrictions, raw-material price volatility or disruptions in major producing countries. API manufacturers must meet stringent regulatory standards for impurities, residual solvents and batch traceability, which raises production cost and complexity. Because acetaminophen is a mature and heavily commoditised API, pricing pressure from generics and cost-sensitive buyers limits margin expansion and slows growth in volume-based investments.
API producers are responding by offering higher-purity acetaminophen batches, improved crystallinity and tighter impurity profiles to support branded generics, specialty formulations, paediatric syrups and combination therapies. There is growing interest in domestic API manufacturing in the USA to reduce dependency on imports and improve supply chain resilience. Pharmaceutical companies are increasing development of fixed-dose combinations and novel delivery systems (e.g., fast-dissolve, sublingual, liquid suspensions) that use acetaminophen API, which supports diversified demand rather than purely volume-based growth.
Demand for acetaminophen API in the United States is rising through 2035, supported by consistent pharmaceutical manufacturing activity, stable demand for analgesics and antipyretics, and expanded use of domestic formulation facilities. Growth is shaped by regulatory requirements, supply-chain reliability, and sustained consumption of over-the-counter medicines across large population centers. Contract manufacturing organizations, generic-drug producers, and health-system suppliers rely on acetaminophen API for tablet, liquid, and combination-product formulations. Regional variation reflects differences in pharmaceutical-production clusters, distribution networks, and healthcare consumption rates. The West leads with a 3.7% CAGR, followed by the South (3.3%), the Northeast (3.0%), and the Midwest (2.6%).
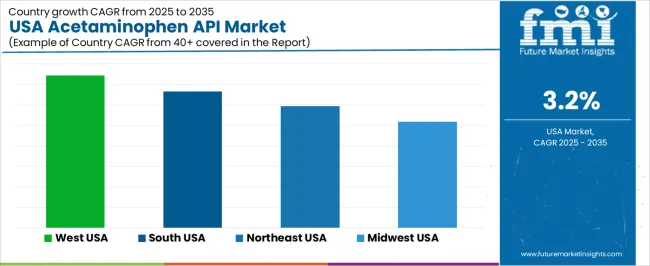
| Region | CAGR (2025-2035) |
|---|---|
| West | 3.7% |
| South | 3.3% |
| Northeast | 3.0% |
| Midwest | 2.6% |

The West grows at 3.7% CAGR, supported by active pharmaceutical-manufacturing operations, strong distribution networks, and high demand for over-the-counter pain-relief medications across populous states. Facilities in California, Washington, and Colorado rely on acetaminophen API for consistent production of tablets, caplets, and liquid formulations. Regional contract manufacturers incorporate API supplies into private-label and generic product lines, reinforcing steady procurement cycles. Healthcare systems and retail-pharmacy networks maintain stable consumption due to year-round demand for pain-management and fever-reduction products. Logistics hubs across the West facilitate reliable movement of raw materials and finished formulations.
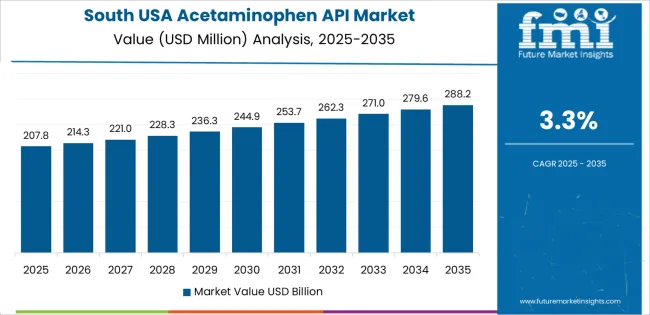
The South grows at 3.3% CAGR, driven by extensive generic-drug manufacturing, strong distribution corridors, and high consumer usage across growing population centers. States such as Texas, Florida, Georgia, and North Carolina host pharmaceutical manufacturers that use acetaminophen API for high-volume formulations. Contract manufacturing organizations support private-label analgesic production for retail chains and healthcare providers. Regional health systems maintain stable purchasing patterns tied to demand for essential analgesics. Efficient transportation networks enable consistent API inflow to manufacturing plants. Growth is reinforced by the South’s expanding demographics and broad availability of OTC pain-relief products.

The Northeast grows at 3.0% CAGR, supported by dense pharmaceutical-research hubs, strong hospital networks, and established manufacturing facilities producing OTC analgesics and combination medications. States including New York, New Jersey, and Pennsylvania operate formulation plants that use acetaminophen API for tablets, liquid suspensions, and dual-ingredient products. Hospital systems maintain steady consumption for inpatient and outpatient medication needs. Regional demand is reinforced by major distribution centers supplying retail-pharmacy networks across the Eastern corridor. Although manufacturing capacity is mature, regular production schedules sustain consistent API requirements.
The Midwest grows at 2.6% CAGR, supported by established pharmaceutical-processing facilities, healthcare networks, and consistent demand for essential analgesics across manufacturing-driven states. Illinois, Michigan, Ohio, and Wisconsin maintain formulation plants that integrate acetaminophen API into various dosage forms. Health systems and retail chains depend on acetaminophen as a core over-the-counter product, generating predictable consumption patterns. Industrial pharmacies and regional distributors maintain steady purchasing to meet baseline analgesic needs. Growth is moderate because the region houses mature production infrastructure, but ongoing replacement and volume-driven manufacturing support a stable demand profile.
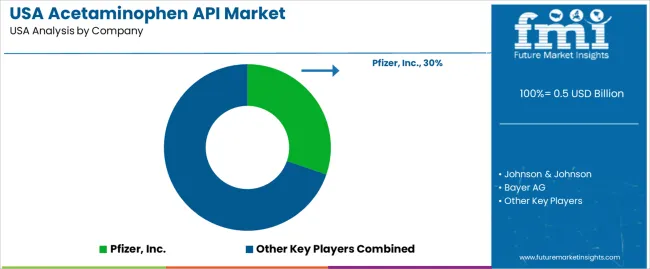
Demand for acetaminophen API in the USA is shaped by a concentrated group of multinational pharmaceutical manufacturers that supply large-volume active ingredients for OTC pain-relief and fever-reduction products. Pfizer, Inc. holds the leading position with an estimated 30.3% share, supported by its established production capacity, validated quality systems, and long-term distribution agreements with major formulators. Its position is reinforced by consistent batch purity and compliance with USA pharmacopoeial standards.
Johnson & Johnson and Bayer AG follow as prominent participants, sourcing and producing acetaminophen API for branded and private-label formulations. Their strengths include controlled supply chains, robust analytical testing frameworks, and integration with finished-dose manufacturing networks across the USA. Sanofi S.A. maintains a solid role through stable API sourcing strategies that support a wide range of analgesic and combination products.
GlaxoSmithKline plc. contributes additional capacity through established analgesic portfolios, emphasizing reliable procurement, global quality alignment, and consistent delivery of API volumes used in both adult and pediatric formulations.
Competition across this segment centers on API purity, regulatory compliance, supply continuity, and validated production processes. Demand remains strong due to steady consumption of OTC pain-relief medicines, seasonal spikes driven by flu and cold incidence, and ongoing reliance on trusted suppliers capable of delivering high-quality, pharmacopoeia-compliant acetaminophen API for large USA manufacturing operations.
| Items | Values |
|---|---|
| Quantitative Units | USD million |
| Drug Class | Acetaminophen API with Opioids, Acetaminophen API, Others |
| Distribution Channel | Retail Stores, Drug Stores, Hospital Pharmacies, E-commerce, Others |
| Sales Type | OTC, Rx |
| Regions Covered | West, Midwest, South, Northeast |
| Key Companies Profiled | Pfizer, Inc., Johnson & Johnson, Bayer AG, Sanofi S.A., GlaxoSmithKline plc. |
| Additional Attributes | Dollar sales by drug class, distribution channel, and sales type categories; regional adoption trends across West, Midwest, South, and Northeast; competitive landscape of API producers and pharmaceutical companies; developments in analgesic formulations, regulatory compliance, and supply chain resilience; integration with hospital procurement, drugstore chains, and online pharmacy platforms in the USA. |
The global demand for acetaminophen API in USA is estimated to be valued at USD 0.5 billion in 2025.
The market size for the demand for acetaminophen API in USA is projected to reach USD 0.7 billion by 2035.
The demand for acetaminophen API in USA is expected to grow at a 3.2% CAGR between 2025 and 2035.
The key product types in demand for acetaminophen API in USA are cetaminophen API with opioids, acetaminophen API and others.
In terms of distribution channel, retail stores segment to command 46.1% share in the demand for acetaminophen API in USA in 2025.


Our Research Products

The "Full Research Suite" delivers actionable market intel, deep dives on markets or technologies, so clients act faster, cut risk, and unlock growth.

The Leaderboard benchmarks and ranks top vendors, classifying them as Established Leaders, Leading Challengers, or Disruptors & Challengers.

Locates where complements amplify value and substitutes erode it, forecasting net impact by horizon

We deliver granular, decision-grade intel: market sizing, 5-year forecasts, pricing, adoption, usage, revenue, and operational KPIs—plus competitor tracking, regulation, and value chains—across 60 countries broadly.

Spot the shifts before they hit your P&L. We track inflection points, adoption curves, pricing moves, and ecosystem plays to show where demand is heading, why it is changing, and what to do next across high-growth markets and disruptive tech

Real-time reads of user behavior. We track shifting priorities, perceptions of today’s and next-gen services, and provider experience, then pace how fast tech moves from trial to adoption, blending buyer, consumer, and channel inputs with social signals (#WhySwitch, #UX).

Partner with our analyst team to build a custom report designed around your business priorities. From analysing market trends to assessing competitors or crafting bespoke datasets, we tailor insights to your needs.
Supplier Intelligence
Discovery & Profiling
Capacity & Footprint
Performance & Risk
Compliance & Governance
Commercial Readiness
Who Supplies Whom
Scorecards & Shortlists
Playbooks & Docs
Category Intelligence
Definition & Scope
Demand & Use Cases
Cost Drivers
Market Structure
Supply Chain Map
Trade & Policy
Operating Norms
Deliverables
Buyer Intelligence
Account Basics
Spend & Scope
Procurement Model
Vendor Requirements
Terms & Policies
Entry Strategy
Pain Points & Triggers
Outputs
Pricing Analysis
Benchmarks
Trends
Should-Cost
Indexation
Landed Cost
Commercial Terms
Deliverables
Brand Analysis
Positioning & Value Prop
Share & Presence
Customer Evidence
Go-to-Market
Digital & Reputation
Compliance & Trust
KPIs & Gaps
Outputs
Full Research Suite comprises of:
Market outlook & trends analysis
Interviews & case studies
Strategic recommendations
Vendor profiles & capabilities analysis
5-year forecasts
8 regions and 60+ country-level data splits
Market segment data splits
12 months of continuous data updates
DELIVERED AS:
PDF EXCEL ONLINE
Acetaminophen API Market Report – Demand, Trends & Industry Forecast 2025–2035
Demand for Acetaminophen API in Japan Size and Share Forecast Outlook 2025 to 2035
USA Medical Coding Market Size and Share Forecast Outlook 2025 to 2035
USA Labels Market Size and Share Forecast Outlook 2025 to 2035
USA Plant-based Creamers Market Size and Share Forecast Outlook 2025 to 2035
USA Barrier Coated Paper Market Size and Share Forecast Outlook 2025 to 2035
USA Electronic Health Records (EHR) Market Size and Share Forecast Outlook 2025 to 2035
Apigenin Market Size and Share Forecast Outlook 2025 to 2035
USA Animal Model Market Size and Share Forecast Outlook 2025 to 2035
USA and Canada Packer Bottle Market Size and Share Forecast Outlook 2025 to 2035
USA Stretch Hood Films Market Size and Share Forecast Outlook 2025 to 2035
USA and Canada Fence Screen Market Size and Share Forecast Outlook 2025 to 2035
USA Lubricant Contaminated HDPE Container Waste Market Size and Share Forecast Outlook 2025 to 2035
USA Commercial Walk-In Refrigeration Market Size and Share Forecast Outlook 2025 to 2035
USA & Canada Pre-painted Steel Roofing and Cladding Market Size and Share Forecast Outlook 2025 to 2035
USA Residential Cotton Candy Maker Market Size and Share Forecast Outlook 2025 to 2035
USA Faith Based Tourism Market Size and Share Forecast Outlook 2025 to 2035
United States NFC Lemon Juice Market Analysis - Size, Growth and Forecast 2025 to 2035
USA and Canada Copper Market Insights - Demand, Size & Industry Trends 2025 to 2035
USA Ground and Precipitated Calcium Carbonate Market Growth by Product Type, Application, End-Use, and Region in 2025 to 2035

Thank you!
You will receive an email from our Business Development Manager. Please be sure to check your SPAM/JUNK folder too.
Chat With
MaRIA