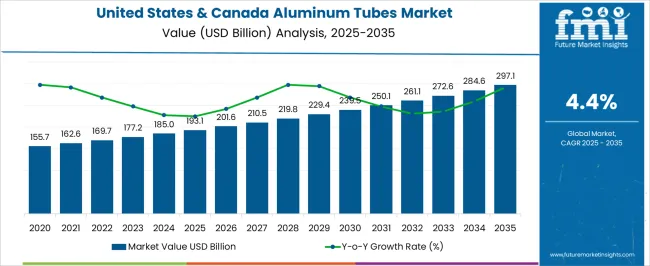
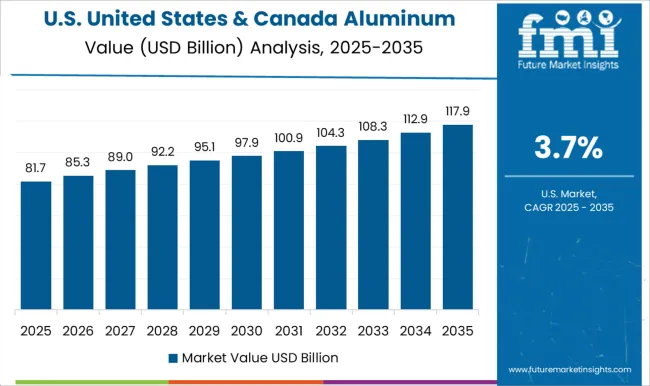
The United States & Canada Aluminum Tubes Market is estimated to be valued at USD 193.1 billion in 2025 and is projected to reach USD 297.1 billion by 2035, registering a compound annual growth rate (CAGR) of 4.4% over the forecast period.
| Metric | Value |
|---|---|
| United States & Canada Aluminum Tubes Market Estimated Value in (2025 E) | USD 193.1 billion |
| United States & Canada Aluminum Tubes Market Forecast Value in (2035 F) | USD 297.1 billion |
| Forecast CAGR (2025 to 2035) | 4.4% |
The United States and Canada aluminum tubes market is experiencing notable expansion driven by growing demand in cosmetics, pharmaceuticals, and personal care sectors. Rising consumer awareness around sustainable packaging has significantly boosted the adoption of aluminum tubes due to their recyclability, durability, and product protection properties.
Advancements in tube manufacturing technologies and design customization have enabled improved convenience and enhanced shelf appeal for end users. Increasing preference for lightweight, portable, and protective packaging has further supported market penetration across healthcare and beauty industries.
Regulatory emphasis on environmentally responsible materials and rising brand commitments to sustainable packaging strategies continue to accelerate adoption. The overall outlook remains positive as manufacturers focus on innovation, recyclability, and product differentiation to meet the evolving needs of consumers and regulatory frameworks in both countries.
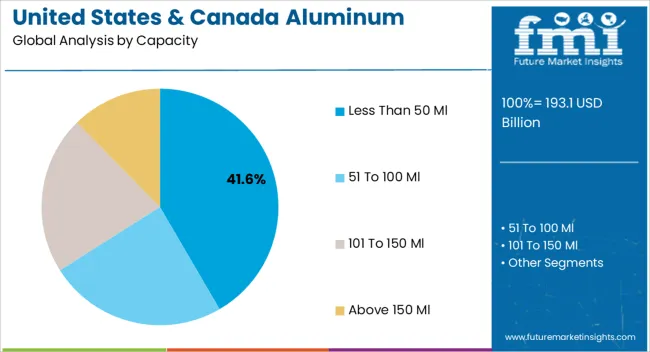
The less than 50 ml capacity segment is projected to account for 41.60% of total revenue by 2025 within the capacity category, making it a key driver of growth. This is supported by increasing demand for travel sized, single use, and sample packaging solutions across cosmetics and pharmaceuticals.
The smaller size allows for convenience, portability, and precise dosing, which has become highly valued by consumers. Additionally, rising trends in e commerce and subscription based beauty services have further increased the adoption of compact aluminum tubes.
Their ability to maintain product integrity while offering sustainability benefits has reinforced their strong market position.
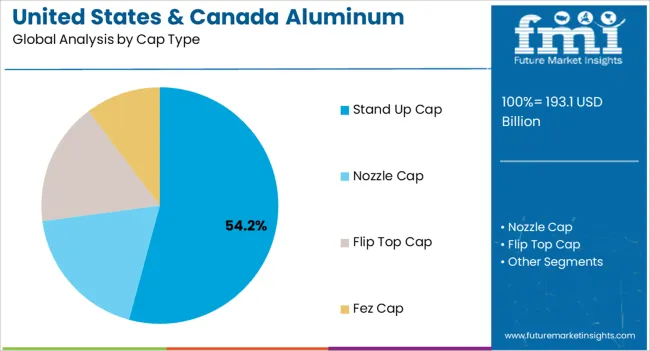
The stand up cap type segment is anticipated to contribute 54.20% of the market revenue by 2025 within the cap type category, establishing it as the leading design. Its popularity stems from ease of dispensing, improved product usage control, and consumer friendly functionality.
The design enhances convenience for personal care and healthcare applications while also minimizing wastage. Manufacturers have increasingly preferred this format as it allows for premium presentation and effective product protection.
Growing acceptance in high volume segments such as cosmetics and toothpaste has further accelerated adoption, making it the dominant cap type in the aluminum tubes market..
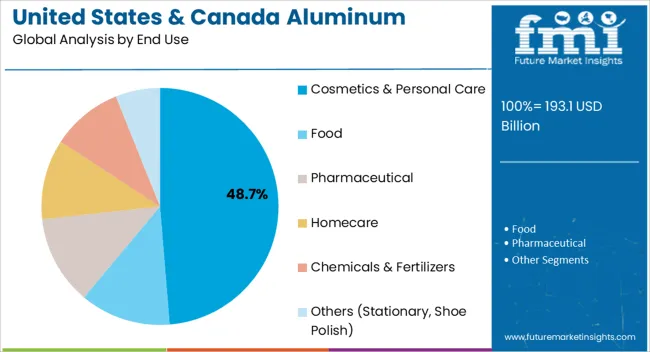
The cosmetics and personal care segment is expected to hold 48.70% of the total market revenue by 2025 under the end use category, positioning it as the largest application area. This dominance is attributed to high consumer spending on skincare, haircare, and beauty products across the United States and Canada.
Aluminum tubes offer superior product preservation by protecting formulations from light, air, and contamination, which is critical for premium cosmetic and personal care products. The segment has also benefited from the sustainability appeal of recyclable aluminum packaging, aligning with consumer and brand priorities.
With the growing popularity of portable, eco friendly, and premium packaging, cosmetics and personal care continue to represent the largest share of the aluminum tubes market.
Aluminum tubes are packaging solutions used for packaging, storing, and transporting numerous products across diverse industries. For instance, aluminum tubes are used for packaging ointments and toothpaste in the pharmaceutical industry.
Aluminum tubes are becoming ideal replacements for plastic tubes and other packaging solutions. This is due to their various attractive features. These tubes can effectively protect sensitive products such as pharmaceuticals and cosmetics from light, moisture, oxygen, and other factors.
Features of aluminum tubes that are making them popular:
Rising demand for safe, environmentally friendly, and convenient packaging solutions will boost the United States & Canada aluminum tubes industry.
Thanks to a wide range of benefits offered by aluminum tubes, they are gaining wider popularity across industries such as pharmaceutical and cosmetics. Hence, growth of these industries will eventually power up aluminum tube sales in the United States and Canada.
In cosmetic sector, aluminum tubes are being increasingly used for packaging haircare solutions, skincare products, makeup items, etc. Rising production and consumption of these cosmetics products is expected to fuel aluminum tube demand.
Similarly, growing popularity of collapsible aluminum tubes and aluminum barrier laminate (ABL) tubes across the United States and Canada will boost the market through 2035.
To attract more and more customers, leading aluminum tube manufacturing companies are focusing on making their products from post-consumer recycled (PCR) aluminum. This is due to the rising demand for sustainable packaging from conscious consumers.
Modern consumers are demanding the use of sustainable packaging that is kinder to the environment and designed for an efficient circular economy. To address this, companies are coming up with new innovations.
For instance, recently Blue Tube, the world’s most sustainable aluminum tube brand was launched by TUBEX. It is made of 100% recycled aluminum which makes it attractive to customers.
The United States & Canada aluminum tubes market witnessed a CAGR of 2.5% during the historic period (2020 to 2025). Total market valuation at the end of 2025 reached around USD 171.0 million.
Over the next decade (2025 to 2035), aluminum tube sales in the United States & Canada market are expected to soar at 4.4% CAGR. The United States & Canada aluminum tubes market is projected to generate an incremental growth opportunity of USD 297.1 million by 2035.
Rising demand for aluminum tubes from diverse industries, including food & beverage, pharmaceutical, and cosmetics is a prominent factor driving the market forward.
Aluminum tubes are becoming ideal packaging solutions across various industries. This is due to their unique characteristics, such as their low weight, durability, and flexibility. These tubes are also eco-friendly which makes them suitable alternatives for plastic tubes.
Rising demand for eco-friendly and sustainable packaging solutions will continue to fuel aluminum tube sales across the United States and Canada.
Improvements in printing and coating technologies have improved the packaging's aesthetic appeal and functionality. This in turn is creating new growth opportunities for the market.
Rising Popularity of Personal Care in Youth Boosting the Aluminum Tubes Industry
The quick rise of the aluminum tubes market in the United States and Canada has been significantly fueled by the rising popularity of personal care products among young people.
Demand for personal care items including toothpaste, skin care creams, and hair care products has increased as a result of young people's rising concern for their looks and hygiene. This in turn is creating a need for sustainable packaging solutions such as aluminum tubes.
Aluminum tubes are becoming ideal choices for packaging numerous personal care products. This is due to their lightweight, durable, and flexible qualities, as well as their capacity to shield the contents from outside elements including moisture, light, and air.
Rising production and consumption of personal care products across the United States and Canada will therefore continue to elevate aluminum tube demand through 2035.
Rising Awareness About Sustainable Packaging to Bolster Aluminum Tube Sales
As more customers and organizations look for environmentally friendly packaging options, the market for aluminum tubes in the United States & Canada will witness a positive growth trajectory.
Customers are seeking sustainable and environmentally friendly packaging options, as they grow more concerned about the effects of packaging waste on the environment. This is putting sustainable tube packaging including aluminum tubes into spotlight.
Aluminum tube manufacturers are integrating cutting-edge technology and using eco-friendly & recyclable materials for the creation of novel products. Usage of 100% PCR (post-consumer recycled) aluminum is emerging as a key trend in the market.
| Country | United States |
|---|---|
| Market Share (2025) | 87.7% |
| Market Share (2035) | 85.9% |
| BPS Analysis | -180 |
| Country | Canada |
|---|---|
| Market Share (2025) | 12.3% |
| Market Share (2035) | 14.1% |
| BPS Analysis | +180 |
Booming Pharmaceutical Industry Fueling Aluminum Tube Demand in the United States
The United States aluminum tubes market is experiencing significant growth due to rising demand from the pharmaceutical industry. According to the USA Department of Commerce, the pharmaceutical industry is one of the leading manufacturing industries in the United States, accounting for USD 135 billion.
Increasing demand for innovative and convenient packaging solutions across the thriving pharmaceutical industry will boost the United States market through 2035.
Aluminum tubes are a popular choice for pharmaceutical packaging due to their ability to protect products from light, air, and moisture. These tubes are lightweight and easy to transport, making them ideal for pharmaceutical products that need to be shipped and stored.
According to Future Market Insights, the United States aluminum tubes industry is expected to progress at 4.2% CAGR. It will hold a total share of 85.9% of the North American aluminum tubes market in 2035.
Favorable Government Support & Thriving Manufacturing Sector Making Canada a Lucrative Market
Canada is emerging as a very profitable market for aluminum tubes because of its robust economy, expanding population, and supportive political climate. Aluminum tube demand in Canada is expected to rise at a CAGR of 5.8% through 2035.
According to Statistics Canada, in 2024, total revenue for Canadian manufacturing reached USD787.3 billion. Further, the Canadian government has put in place several programs to encourage innovation and competitiveness, as well as the expansion of the manufacturing sector.
For instance, the Canadian government offers funding initiatives such as the Strategic Innovation Fund and the Innovation Superclusters Initiative. This gives businesses financial support for joint research & development projects.
Similarly, the expansion of food & beverage and cosmetic & personal care sectors along with the growing need for sustainable tube packaging will boost the Canadian market.
Stand-Up Caps Remain the Most Popular Type in the United States & Canada Market
Due to their distinctive shape and usefulness, stand up tube caps have become the most profitable packaging option in the United States and Canada aluminum tubes market. The fact that these tubes can stand up straight on their own gives users convenience and ease of usage.
Further, stand-up cap tubes include a cap that is simple to open and close, enabling frequent use and content preservation. They are therefore perfect for packing goods such as cosmetics, medicines, and food and beverage products that need to be used repeatedly or preserved.
Stand-up tube caps have several advantages for producers. They can be personalized with cutting-edge printing and coating technologies to improve their aesthetic appeal and usefulness. They are lightweight, making shipping and handling less expensive.
The stand-up cap is anticipated to dictate the United States & Canada aluminum tubes market with almost 38.5% share in terms of revenue by 2025 end.
Adoption of Aluminum Tubes to Remain High in Pharmaceutical Industry Through 2035
Based on end use, pharmaceutical sector is likely to remain the leading user of aluminum tubes across the United States and Canada. The target segment is expected to thrive at 4.8% CAGR through 2035. This is attributed to rising need for high-quality pharmaceutical tube packaging solutions.
Expansion of pharmaceutical business due to rising geriatric population and increasing prevalence of chronic diseases will further boost growth of the target segment.
Aluminum tubes have become ideal pharmaceutical packaging solutions across the United States & Canada. This is due to their ability to shield the contents from external elements such as moisture, light, and air, which can impair the quality and shelf life of the product.
Further, aluminum tubes can be easily customized using cutting-edge printing and coating technologies and are lightweight, making them economical to ship and handle.
Cosmetic & personal care sector will also play a key role in bolstering aluminum tube sales in the United States & Canada. This is due to growing popularity of cosmetic tube packaging on account of its various benefits. A CAGR of 4.6% has been predicted by Future Market Insights for the same segment.
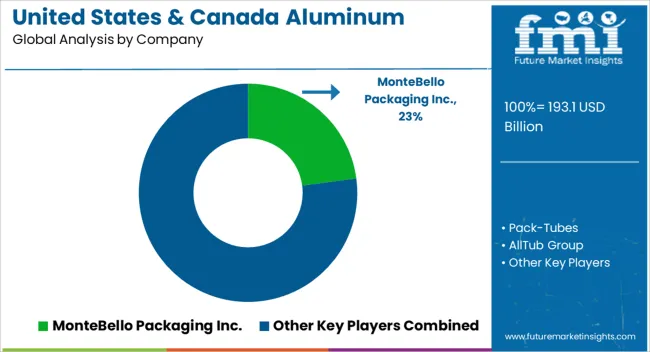
Leading aluminum tube manufacturers are attempting to provide new technologies within that industry, which is attracting the interest of many consumer companies. New products with enhanced features to meet customer requirements as well as comply with government regulations are being introduced.
Companies are also focusing on adopting strategies such as mergers, partnerships, facility expansions, and acquisitions to gain a competitive edge in the market.
Recent developments by the leading players are as follows:
| Attribute | Details |
|---|---|
| Estimated Market Value (2025) | USD 193.1 billion |
| Projected Market Value (2035) | USD 297.1 billion |
| Anticipated Growth Rate (2025 to 2035) | 4.4% CAGR |
| Historical Data | 2020 to 2025 |
| Forecast Period | 2025 to 2035 |
| Quantitative Units | Revenue in USD Million, Volume in Units, and CAGR from 2025 to 2035 |
| Report Coverage | Revenue Forecast, Volume Forecast, Company Ranking, Competitive Landscape, Growth Factors, Trends, and Pricing Analysis |
| Segments Covered | Capacity, Cap Type, End Use, Country |
| Key Countries Covered | United States, Canada |
| Key Companies Profiled | MonteBello Packaging Inc.; Pack-Tubes; AllTub Group; AmberTube; Linhardt GmbH & Co. KG; Sonic Packaging Industries Inc.; Apackaging Group LLC; AndPack Inc.; Paket Corporation; LAGEENTUBES; Clt-Th Packaging Sl |
The global united states & Canada aluminum tubes market is estimated to be valued at USD 193.1 billion in 2025.
The market size for the united states & Canada aluminum tubes market is projected to reach USD 297.1 billion by 2035.
The united states & Canada aluminum tubes market is expected to grow at a 4.4% CAGR between 2025 and 2035.
The key product types in united states & Canada aluminum tubes market are less than 50 ml, 51 to 100 ml, 101 to 150 ml and above 150 ml.
In terms of cap type, stand up cap segment to command 54.2% share in the united states & Canada aluminum tubes market in 2025.


Our Research Products

The "Full Research Suite" delivers actionable market intel, deep dives on markets or technologies, so clients act faster, cut risk, and unlock growth.

The Leaderboard benchmarks and ranks top vendors, classifying them as Established Leaders, Leading Challengers, or Disruptors & Challengers.

Locates where complements amplify value and substitutes erode it, forecasting net impact by horizon

We deliver granular, decision-grade intel: market sizing, 5-year forecasts, pricing, adoption, usage, revenue, and operational KPIs—plus competitor tracking, regulation, and value chains—across 60 countries broadly.

Spot the shifts before they hit your P&L. We track inflection points, adoption curves, pricing moves, and ecosystem plays to show where demand is heading, why it is changing, and what to do next across high-growth markets and disruptive tech

Real-time reads of user behavior. We track shifting priorities, perceptions of today’s and next-gen services, and provider experience, then pace how fast tech moves from trial to adoption, blending buyer, consumer, and channel inputs with social signals (#WhySwitch, #UX).

Partner with our analyst team to build a custom report designed around your business priorities. From analysing market trends to assessing competitors or crafting bespoke datasets, we tailor insights to your needs.
Supplier Intelligence
Discovery & Profiling
Capacity & Footprint
Performance & Risk
Compliance & Governance
Commercial Readiness
Who Supplies Whom
Scorecards & Shortlists
Playbooks & Docs
Category Intelligence
Definition & Scope
Demand & Use Cases
Cost Drivers
Market Structure
Supply Chain Map
Trade & Policy
Operating Norms
Deliverables
Buyer Intelligence
Account Basics
Spend & Scope
Procurement Model
Vendor Requirements
Terms & Policies
Entry Strategy
Pain Points & Triggers
Outputs
Pricing Analysis
Benchmarks
Trends
Should-Cost
Indexation
Landed Cost
Commercial Terms
Deliverables
Brand Analysis
Positioning & Value Prop
Share & Presence
Customer Evidence
Go-to-Market
Digital & Reputation
Compliance & Trust
KPIs & Gaps
Outputs
Full Research Suite comprises of:
Market outlook & trends analysis
Interviews & case studies
Strategic recommendations
Vendor profiles & capabilities analysis
5-year forecasts
8 regions and 60+ country-level data splits
Market segment data splits
12 months of continuous data updates
DELIVERED AS:
PDF EXCEL ONLINE
United States & Canada Pest Control Services Market Size and Share Forecast Outlook 2025 to 2035
United States & Canada Collation Shrink Films Market Size and Share Forecast Outlook 2025 to 2035
United States & Canada Cold Chain Packaging Market Insights- Demand and Growth Forecast 2025 to 2035
United States & Canada Hair Salon Services Market Analysis by Growth, Trends and Forecast from 2025 to 2035
United States & Canada Foundation Repair Services Market Analysis by Growth, Trends and Forecast from 2025 to 2035
United States and Canada Tray Sealing Machines Market Size and Share Forecast Outlook 2025 to 2035
United States and Canada Collision Repair Parts Market Size and Share Forecast Outlook 2025 to 2035
United States and Canada Child Resistant Bottles Market Size and Share Forecast Outlook 2025 to 2035
United States and Canada Educational Tourism Market Growth, Trends and Forecast from 2025 to 2035
United States and Canada Residential Lighting Fixture Market Growth, Trends and Forecast from 2025 to 2035
Paper Tubes & Core Industry Analysis in United States Trends, Size, and Forecast for 2025-2035
Degassing Valves Industry Analysis in United States & Canada - Size, Share, and Forecast 2025 to 2035
Protective Packaging Industry Analysis in United States and Canada - Size, Share, and Forecast 2025 to 2035
United States Hand Holes Market Size and Share Forecast Outlook 2025 to 2035
United States Walk-in Cooler and Freezer Market Size and Share Forecast Outlook 2025 to 2035
United States Commercial Refrigeration Equipment Market Forecast and Outlook 2025 to 2035
United States Dog Toys Market Size and Share Forecast Outlook 2025 to 2035
United States Biodegradable Cups and Lids Market Size and Share Forecast Outlook 2025 to 2035
United States Green Tea Supplement Market Size and Share Forecast Outlook 2025 to 2035
United States Hispanic Novelties Market Size and Share Forecast Outlook 2025 to 2035

Thank you!
You will receive an email from our Business Development Manager. Please be sure to check your SPAM/JUNK folder too.
Chat With
MaRIA