Hispanic Novelties in the USA Size, Share, and Forecast Outlook 2025 to 2035

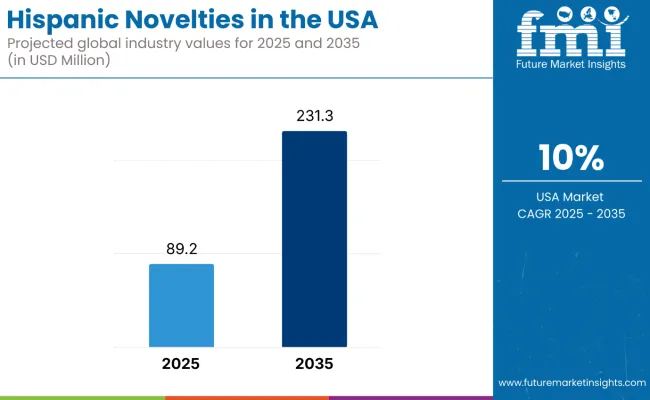
Sales of Hispanic novelties in the USA are estimated at USD 89.2 million in 2025 and projected to reach USD 231.3 million by 2035, reflecting a CAGR of 10% over the forecast period.
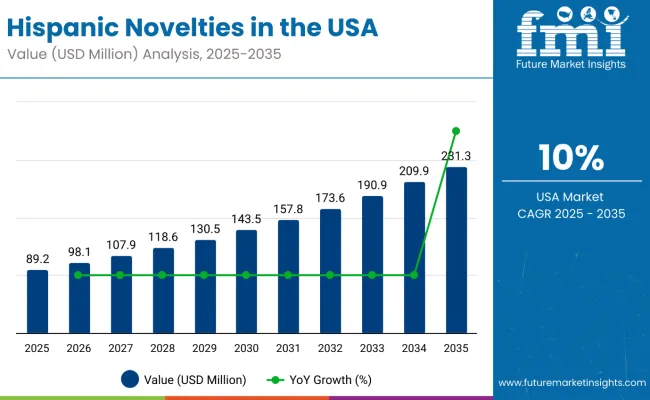
United States Hispanic Novelties Market

Quick Stats for Hispanic Novelties Sales in the USA

  • Hispanic Novelties Sales in the USA Value (2025): USD 89.2 million
  • Hispanic Novelties Sales in the USA Forecast Value (2035): USD 231.3 million
  • Hispanic Novelties Sales in the USA Forecast CAGR (2025 to 2035): 10%
  • Leading Segment in USA Hispanic Novelties Category by Distribution Channel (2025): Retail/Household (48% share)
  • Key Players in USA Hispanic Novelties Sales: Palacana, Royal Tropicale Foods LLC, Pepitos Paletas, Masterpaletas, La Brisa Ice Cream Operating Company, Paletas Morelia, Raspados Lolys, Simple Truth Organic™ (Kroger), Lanewyorkina

United States Hispanic Novelties Market 2

Metric Value
Estimated Size (2025E) USD 89.2 million
Projected Value (2035F) USD 231.3 million
CAGR (2025 to 2035) 10%

This growth is driven by rising demand for culturally authentic products, increasing Hispanic population demographics, expanding availability through modern retail and e-commerce platforms, and growing interest in traditional fruit-based frozen treats. The clean-label movement and consumer preference for authentic, heritage-inspired products are expected to accelerate market adoption across key urban markets further.

Raspados are poised to remain the leading product segment with a 22% share in 2025, owing to their traditional appeal, refreshing nature, and widespread cultural recognition among Hispanic consumers. Other conventional products, including paletas, chamoyadas, limber, Nieve de garrafa, cremoladas, and granizados, continue to gain traction as consumers seek authentic taste experiences that connect them to their cultural heritage.

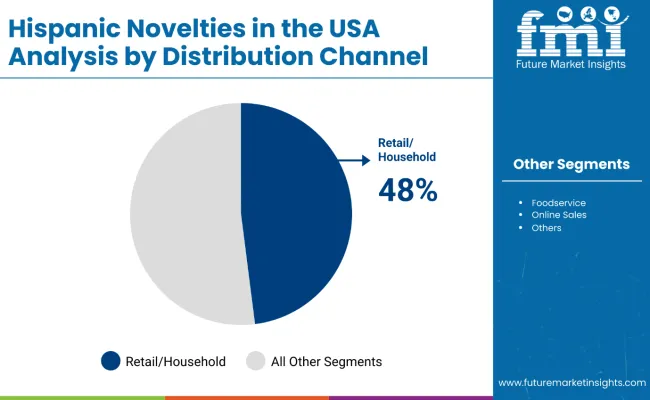
By distribution channel, retail/household will continue to drive the highest demand, with a 48% share in 2025, supported by increased mainstream retail adoption, growing Hispanic household purchasing power, and expanded product availability in grocery chains. Foodservice, ice-cream parlours, travel retail, and online sales channels are also experiencing robust growth, driven by increased cultural awareness and product accessibility.

Adoption is concentrated among Hispanic communities seeking cultural authenticity, health-conscious individuals preferring fruit-based options, and mainstream consumers exploring diverse flavors. The expansion of specialized retailers, growing presence in mainstream grocery chains, and increased e-commerce availability are expected to broaden market reach and accelerate adoption across diverse consumer segments.

Segmental Analysis

The USA Hispanic novelties are analyzed across several major segments such as product type, flavor, and distribution channel. By product type, the categories include paletas, chamoyadas, limber, raspados, nieve de garrafa, cremoladas, granizados, and other products (cholados). By flavor, it is segmented into fruits (berry, banana, orange, coconut, others), herbs & spices (cinnamon, mint, peppermint, and others), dry fruits & nuts (cashew, almond, hazelnut, and others), beans (chocolate, coffee, and others), and flower (lavender, rose, hibiscus). By distribution channel, key segments include foodservice, travel retail, ice-cream parlour, retail/household (via hypermarket/supermarket, convenience store, grocery store, specialty store, discount store, departmental store), and online sales (mass merchandiser, company website).
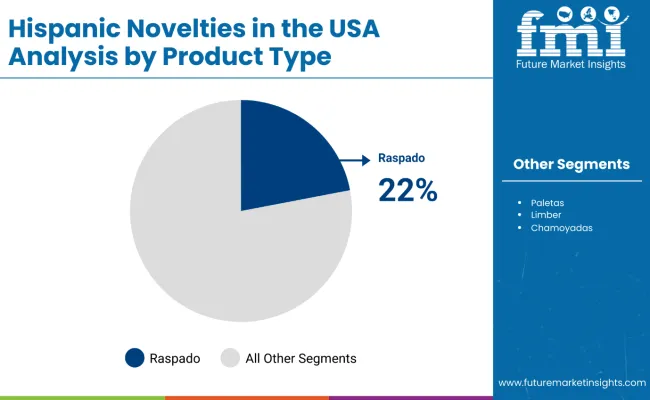
By Product Type, Raspados to Lead with 22% Share

United States Hispanic Novelties Market By Product

Raspados are projected to dominate with a 22% value share by 2025, driven by their cultural significance, affordability, and high customization potential. These traditional shaved ice desserts resonate strongly with Hispanic consumers while attracting mainstream audiences seeking authentic and refreshing treats.
  • Raspados are expected to hold a 22% value share by 2035, supported by their nostalgic appeal, compatibility with clean-label natural ingredients, and widespread availability through diverse vendor channels.
  • Customizable toppings, including chamoy, tamarind, and fresh fruits, enhance consumer appeal and allow for premium pricing strategies, particularly during peak summer demand periods.
  • The preference for raspados is reinforced by their cultural authenticity, relatively low cost compared to other novelties, and strong regional presence in key Hispanic markets, including California, Texas, and Florida.

By Distribution Channel, Retail/Household to Lead with 48% Share

United States Hispanic Novelties Market By Distibution

Retail/household channels are projected to account for the largest share of 48% by 2035, driven by improved product accessibility, impulse purchasing behavior, and expanding shelf space in mainstream grocery chains. This segment benefits from higher foot traffic and promotional opportunities that boost visibility among both Hispanic and non-Hispanic consumers.

  • Retail/household channels are expected to hold a 48% value share by 2035, supported by wide product availability in hypermarkets and supermarkets, along with increased placement in frozen snack sections.
  • Specialty and ethnic stores continue to build loyal consumer bases by offering authentic and premium Hispanic novelty options, while mainstream retailers drive volume through impulse purchases and seasonal promotions.
  • The dominance of retail channels is reinforced by improved discoverability, price discount strategies, and promotional bundling opportunities that enhance consumer trial and repeat purchase behavior across diverse demographic segments.

Consumer Profile Analysis: Cultural Heritage and Health-Conscious Consumers Drive Adoption

The Hispanic novelties category in the USA attracts a diverse range of culturally connected, health-conscious, and adventurous consumers seeking authentic frozen treats that deliver traditional flavors and cultural experiences. While motivations range from nostalgic connections to health benefits to artistic exploration, demand is concentrated among several key consumer segments. Each segment demonstrates distinct adoption behaviors, product preferences, and purchasing considerations.

  • Hispanic millennials and Gen Z consumers represent the largest consumer base, prioritizing authentic cultural experiences, natural fruit-based ingredients, and traditional flavor profiles. These consumers actively seek Hispanic novelties to maintain cultural connections, share heritage with family members, and support businesses that reflect their cultural identity.
  • Health-conscious individuals show consistent demand for fruit-based, natural ingredient alternatives that provide refreshing satisfaction without artificial additives. Their purchasing decisions are influenced by clean-label formulations, natural sweeteners, and perceived health benefits of traditional fruit-based preparations.
  • Adventurous mainstream consumers increasingly choose Hispanic novelties to explore diverse flavor experiences and authentic cultural products. Their adoption is driven by curiosity about traditional treats, social media influence, and growing appreciation for authentic ethnic foods and beverages.
  • Families with children, including both Hispanic and non-Hispanic households, adopt Hispanic novelties as affordable, shareable treats that provide cultural education and unique taste experiences. These consumers often prioritize value pricing, family-friendly flavors, and products that create memorable cultural moments.

Collectively, these segments drive demand for Hispanic novelties in the USA, with adoption patterns shaped by cultural authenticity, health considerations, flavor exploration, and family bonding experiences.
Notable Players and Strategies in the USA Hispanic Novelties

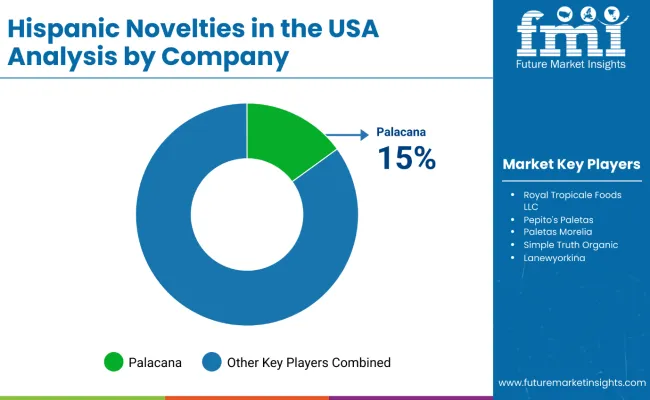
United States Hispanic Novelties Market By Company

The competitive environment in the USA Hispanic novelties sector is characterized by a mix of established frozen dessert manufacturers expanding into authentic ethnic products and specialized Hispanic-focused brands. Success depends more on innovation in authentic flavors, cultural connection, and distribution accessibility than on conventional frozen dessert expertise such as the top suppliers collectively serve millions of Hispanic and mainstream consumers across retail and foodservice channels nationwide and account for the majority of market distribution.

  • Tropicale Foods LLC is among the most prominent players, claiming the #1 Hispanic frozen novelty position in the country with USD 408.9 million annual revenue and 1,059 employees. The company focuses on authentic recipes under Helados Mexico and La Michoacana brands, investing $75M in a new 227,000 square-foot facility in Lubbock, Texas, to meet rapidly growing demand. Their strategy emphasizes capacity expansion, national distribution across grocery, mass, club, convenience and value channels, and maintaining traditional authenticity with flavors like Strawberry, Coconut, Mango, and Arroz con Leche.
  • Palacana and Master Paletas provide comprehensive traditional product portfolios with strong cultural positioning and premium artisanal offerings. The strategy of Palacana emphasizes organic growth through 18 years of operation, expanding from one flagship Kansas City store to four company-owned and two partnership locations, plus a dedicated production facility, "Paletas, LLC" for wholesale operations. Master Paletas focuses on gourmet positioning with handmade ice pops using fresh natural ingredients, such as Nutella and Oreo, targeting profitable distribution solutions from their Miami headquarters.
  • Pepito's Paletas leverages its worker-owned cooperative model alongside targeted marketing to health-conscious consumers, focusing on 100% real fruit products with agave honey sweeteners and innovative eco-friendly packaging through their signature storage box that eliminates plastic and freezer dependency. Their strategy includes bulk sales to major corporations like Facebook and Google, as well as catering services.
  • The next tier includes La Brisa Ice Cream Operating Company, Paletas Morelia, Raspados Loly's, Simple Truth Organic™ (Kroger), and Lanewyorkina. La Brisa has focused on family-owned operations since 1982, with SQF Level 3 and Kosher certifications, offering natural ingredient products and comprehensive services, including party cart rentals and event catering. These companies focus on specialized formulations, regional market penetration, and niche positioning within specific Hispanic communities.

Innovation and strategic partnerships are expected to continue, as expertise in authentic flavor development, cultural marketing, and eco-friendly distribution becomes increasingly critical for sustaining consumer loyalty and expanding presence across retail and foodservice sectors, targeting both Hispanic heritage consumers and mainstream audiences seeking authentic cultural experiences.

Scope of Report in USA’s Hispanic Novelties Space

Items Values
Quantitative Units USD 89.2 Million
Product Type Paletas, Chamoyadas, Limber, Raspados, Nieve de Garrafa, Cremoladas, Granizados, Otros Productos (Cholados)
Flavor Fruits (Berry, Banana, Orange, Coconut, Others), Herbs & Spices (Cinnamon, Mint, Peppermint and Others), Dry Fruits & Nuts (Cashew, Almond, Hazelnuts and Others), Beans (Chocolate, Coffee and Others), Flowers (Lavender, Rose, Hibiscus)
Distribution Channels Foodservice (Cafes, Quick-service Restaurants, Full-service Restaurants, Bakeries & Patisseries), Travel Retail, Ice-cream Parlour, Retail/Household (Hypermarket/Supermarket, Convenience Store, Grocery Store, Specialty Store, Discount Store, Departmental Store), Online Sales (Mass Merchandiser, Company Website)
Regions Covered North America
Country Covered United States
Key Companies Profiled Palacana, Royal Tropicale Foods LLC, Pepito's Paletas, Masterpaletas, La Brisa Ice Cream Operating Company, Paletas Morelia, Raspados Loly's, Simple Truth Organic™ (Kroger), Lanewyorkina
Additional Attributes Dollar sales by product type and flavor, regional consumption trends, competitive landscape, consumer preferences for traditional versus innovative flavors, integration with health and wellness positioning, innovations in reduced-sugar and fortified formulations, and quality standardization across diverse distribution channels

Key Segments

By Product Type:

  • Paletas
  • Chamoyadas
  • Limber
  • Raspados
  • Nieve de Garrafa
  • Cremoladas
  • Granizados
  • Other Products (Cholados, etc.)

By Flavor:

  • Fruits
    • Berry
    • Banana
    • Orange
    • Coconut
    • Others
  • Herbs & Spices
    • Cinnamon
    • Mint
    • Peppermint and Others
  • Dry Fruits & Nuts
    • Cashew
    • Almond
    • Hazelnuts and Others
  • Beans
    • Chocolate
    • Coffee and Others
  • Flowers (Lavender, Rose, Hibiscus)

By Distribution Channel:

  • Foodservice
    • Cafes
    • Quick-service Restaurants
    • Full-service Restaurants
    • Bakeries & Patisseries
  • Travel Retail
  • Ice-cream Parlour
  • Retail/ Household
    • Hypermarket/ Supermarket
    • Convenience Store
    • Grocery Store
    • Specialty Store
    • Discount Store
    • Departmental Store
  • Online Sales
    • Mass Merchandiser
    • Company Website

Table of Content

  1. Executive Summary
    • Sales Outlook
    • Demand-side Trends
    • Supply-side Trends
    • Technology Roadmap Analysis
    • Analysis and Recommendations
  2. Sales Overview
    • Sales Coverage / Taxonomy
    • Sales Definition / Scope / Limitations
  3. Sales Background
    • Sales Dynamics
      • Drivers
      • Restraints
      • Opportunity
      • Trends
    • Scenario Forecast
      • Demand in Optimistic Scenario
      • Demand in Likely Scenario
      • Demand in Conservative Scenario
    • Opportunity Map Analysis
    • Product Life Cycle Analysis
    • Supply Chain Analysis
      • Supply Side Participants and their Roles
        • Producers
        • Mid-Level Participants (Traders/ Agents/ Brokers)
        • Wholesalers and Distributors
      • Value Added and Value Created at Node in the Supply Chain
      • List of Raw Material Suppliers
      • List of Existing and Potential Buyer’s
    • Investment Feasibility Matrix
    • Value Chain Analysis
      • Profit Margin Analysis
      • Wholesalers and Distributors
      • Retailers
    • PESTLE and Porter’s Analysis
    • Regulatory Landscape
      • By Key Regions
      • By Key Countries
    • Parent Sales Outlook
    • Production and Consumption Statistics
    • Import and Export Statistics
  4. United States Sales Analysis 2020 to 2024 and Forecast, 2025 to 2035
    • Historical Sales Size Value (USD Million) & Volume (Metric Tons) Analysis, 2020 to 2024
    • Current and Future Sales Size Value (USD Million) & Volume (Metric Tons) Projections, 2025 to 2035
      • Y-o-Y Growth Trend Analysis
      • Absolute $ Opportunity Analysis
  5. United States Sales Pricing Analysis 2020 to 2024 and Forecast 2025 to 2035
  6. United States Sales Analysis 2020 to 2024 and Forecast 2025 to 2035, By Product Type
    • Introduction / Key Findings
    • Historical Sales Size Value (USD Million) & Volume (Metric Tons) Analysis By Product Type, 2020 to 2024
    • Current and Future Sales Size Value (USD Million) & Volume (Metric Tons) Analysis and Forecast By Product Type, 2025 to 2035
      • Paletas
      • Chamoyadas
      • Limber
      • Raspados
      • Nieve de Garrafa
      • Cremoladas
      • Granizados
      • Other Products
        • Cholados
    • Y-o-Y Growth Trend Analysis By Product Type, 2020 to 2024
    • Absolute $ Opportunity Analysis By Product Type, 2025 to 2035
  7. United States Sales Analysis 2020 to 2024 and Forecast 2025 to 2035, By Flavor
    • Introduction / Key Findings
    • Historical Sales Size Value (USD Million) & Volume (Metric Tons) Analysis By Flavor, 2020 to 2024
    • Current and Future Sales Size Value (USD Million) & Volume (Metric Tons) Analysis and Forecast By Flavor, 2025 to 2035
      • Fruits
        • Berry
        • Banana
        • Orange
        • Coconut
        • Others
      • Herbs & Spices
        • Cinnamon
        • Mint
        • Peppermint and Others
      • Dry Fruits & Nuts
        • Cashew
        • Almond
        • Hazelnut and Others
      • Beans
        • Chocolate
        • Coffee and Others
        • Flower (Lavender, Rose, Hibiscus)
    • Y-o-Y Growth Trend Analysis By Flavor, 2020 to 2024
    • Absolute $ Opportunity Analysis By Flavor, 2025 to 2035
  8. United States Sales Analysis 2020 to 2024 and Forecast 2025 to 2035, By Distribution Channel
    • Introduction / Key Findings
    • Historical Sales Size Value (USD Million) & Volume (Metric Tons) Analysis By Distribution Channel, 2020 to 2024
    • Current and Future Sales Size Value (USD Million) & Volume (Metric Tons) Analysis and Forecast By Distribution Channel, 2025 to 2035
      • Foodservice
        • Cafes
        • Quick-service Restaurants
        • Full-service Restaurants
        • Bakeries & Patiserries
      • Travel Retail
      • Ice-cream Parlour
      • Retail/ Household
        • HyperSales/ SuperSales
        • Convenience Store
        • Grocery Store
        • Specialty Store
        • Discount Store
        • Departmental Store
      • Online Sales
        • Mass Merchandiser
        • Company Website
    • Y-o-Y Growth Trend Analysis By Distribution Channel, 2020 to 2024
    • Absolute $ Opportunity Analysis By Distribution Channel, 2025 to 2035
  9. United States Sales Analysis 2020 to 2024 and Forecast 2025 to 2035, By Region
    • Introduction
    • Historical Sales Size Value (USD Million) & Volume (Metric Tons) Analysis By Region, 2020 to 2024
    • Current Sales Size Value (USD Million) & Volume (Metric Tons) Analysis and Forecast By Region, 2025 to 2035
      • North America
    • Sales Attractiveness Analysis By Region
  10. North America United States Sales Analysis 2020 to 2024 and Forecast 2025 to 2035, By Country
    • Historical Sales Size Value (USD Million) & Volume (Metric Tons) Trend Analysis By Sales Taxonomy, 2020 to 2024
    • Sales Size Value (USD Million) & Volume (Metric Tons) Forecast By Sales Taxonomy, 2025 to 2035
      • By Country
        • USA
      • By Product Type
      • By Flavor
      • By Distribution Channel
    • Sales Attractiveness Analysis
      • By Country
      • By Product Type
      • By Flavor
      • By Distribution Channel
    • Key Takeaways
  11. Key Countries United States Sales Analysis
    • USA
      • Pricing Analysis
      • Sales Share Analysis, 2024
        • By Product Type
        • By Flavor
        • By Distribution Channel
  12. Sales Structure Analysis
    • Competition Dashboard
    • Competition Benchmarking
    • Sales Share Analysis of Top Players
      • By
      • By Product Type
      • By Flavor
      • By Distribution Channel
  13. Competition Analysis
    • Competition Deep Dive
      • Palacana
        • Overview
        • Product Portfolio
        • Profitability by Sales Segments (Product/Age /Sales Channel/Region)
        • Sales Footprint
        • Strategy Overview
          • Salesing Strategy
          • Product Strategy
          • Channel Strategy
      • Royal Tropicale Foods LLC
        • Overview
        • Product Portfolio
        • Profitability by Sales Segments (Product/Age /Sales Channel/Region)
        • Sales Footprint
        • Strategy Overview
          • Salesing Strategy
          • Product Strategy
          • Channel Strategy
      • Pepito's Paletas
        • Overview
        • Product Portfolio
        • Profitability by Sales Segments (Product/Age /Sales Channel/Region)
        • Sales Footprint
        • Strategy Overview
          • Salesing Strategy
          • Product Strategy
          • Channel Strategy
      • Masterpaletas
        • Overview
        • Product Portfolio
        • Profitability by Sales Segments (Product/Age /Sales Channel/Region)
        • Sales Footprint
        • Strategy Overview
          • Salesing Strategy
          • Product Strategy
          • Channel Strategy
      • La Brisa Ice Cream Operating Company
        • Overview
        • Product Portfolio
        • Profitability by Sales Segments (Product/Age /Sales Channel/Region)
        • Sales Footprint
        • Strategy Overview
          • Salesing Strategy
          • Product Strategy
          • Channel Strategy
      • Paletas Morelia
        • Overview
        • Product Portfolio
        • Profitability by Sales Segments (Product/Age /Sales Channel/Region)
        • Sales Footprint
        • Strategy Overview
          • Salesing Strategy
          • Product Strategy
          • Channel Strategy
      • Raspados Loly's
        • Overview
        • Product Portfolio
        • Profitability by Sales Segments (Product/Age /Sales Channel/Region)
        • Sales Footprint
        • Strategy Overview
          • Salesing Strategy
          • Product Strategy
          • Channel Strategy
      • Simple Truth Organic™ (Kroger)
        • Overview
        • Product Portfolio
        • Profitability by Sales Segments (Product/Age /Sales Channel/Region)
        • Sales Footprint
        • Strategy Overview
          • Salesing Strategy
          • Product Strategy
          • Channel Strategy
      • Lanewyorkina
        • Overview
        • Product Portfolio
        • Profitability by Sales Segments (Product/Age /Sales Channel/Region)
        • Sales Footprint
        • Strategy Overview
          • Salesing Strategy
          • Product Strategy
          • Channel Strategy
  14. Assumptions & Acronyms Used
  15. Research Methodology

List of Tables

  • Table 1: Sales in United States Value (USD Million) Forecast by Region, 2020-2035
  • Table 2: Sales in United States Volume (Metric Tons) Forecast by Region, 2020-2035
  • Table 3: Sales in United States Value (USD Million) Forecast by Product Type, 2020-2035
  • Table 4: Sales in United States Volume (Metric Tons) Forecast by Product Type, 2020-2035
  • Table 5: Sales in United States Value (USD Million) Forecast by Flavor, 2020-2035
  • Table 6: Sales in United States Volume (Metric Tons) Forecast by Flavor, 2020-2035
  • Table 7: Sales in United States Value (USD Million) Forecast by Distribution Channel, 2020-2035
  • Table 8: Sales in United States Volume (Metric Tons) Forecast by Distribution Channel, 2020-2035
  • Table 9: Sales in United States Value (USD Million) Forecast by Country, 2020-2035
  • Table 10: Sales in United States Volume (Metric Tons) Forecast by Country, 2020-2035
  • Table 11: Sales in United States Value (USD Million) Forecast by Product Type, 2020-2035
  • Table 12: Sales in United States Volume (Metric Tons) Forecast by Product Type, 2020-2035
  • Table 13: Sales in United States Value (USD Million) Forecast by Flavor, 2020-2035
  • Table 14: Sales in United States Volume (Metric Tons) Forecast by Flavor, 2020-2035
  • Table 15: Sales in United States Value (USD Million) Forecast by Distribution Channel, 2020-2035
  • Table 16: Sales in United States Volume (Metric Tons) Forecast by Distribution Channel, 2020-2035

List of Figures

  • Figure 1: Sales in United States Volume (Metric Tons) Forecast 2020-2035
  • Figure 2: Sales in United States Pricing Analysis
  • Figure 3: Sales in United States Value (USD Million) Forecast 2020-2035
  • Figure 4: Sales in United States Value Share and BPS Analysis by Product Type, 2025 and 2035
  • Figure 5: Sales in United States Y-o-Y Growth Comparison by Product Type, 2025-2035
  • Figure 6: Sales in United States Attractiveness Analysis by Product Type
  • Figure 7: Sales in United States Value Share and BPS Analysis by Flavor, 2025 and 2035
  • Figure 8: Sales in United States Y-o-Y Growth Comparison by Flavor, 2025-2035
  • Figure 9: Sales in United States Attractiveness Analysis by Flavor
  • Figure 10: Sales in United States Value Share and BPS Analysis by Distribution Channel, 2025 and 2035
  • Figure 11: Sales in United States Y-o-Y Growth Comparison by Distribution Channel, 2025-2035
  • Figure 12: Sales in United States Attractiveness Analysis by Distribution Channel
  • Figure 13: Sales in United States - Tier Structure Analysis
  • Figure 14: Sales in United States - Company Share Analysis

Frequently Asked Questions

What is the projected sales value of Hispanic novelties in the USA by 2025?

In 2025, the total sales of Hispanic novelties in the USA will be valued at USD 89.2 million.

In 2025, the total sales of Hispanic novelties in the USA will be valued at USD 89.2 million.

By 2035, the sales of Hispanic novelties in the USA are forecasted to reach USD 231.3 million, reflecting a CAGR of 10% from 2025 to 2035.

Which product segment dominates the Hispanic novelties space in the USA in 2025?

Raspados lead the product segment with a 22% market share in 2025.

Which distribution channel is projected to drive the highest sales for Hispanic novelties in the USA?

Retail/household channels are expected to lead with a 48% share in 2025.

Who are the key players in the USA Hispanic novelties market?

Key players include Palacana, Royal Tropicale Foods LLC, Pepito's Paletas, Masterpaletas, La Brisa Ice Cream Operating Company, Paletas Morelia, Raspados Loly's, Simple Truth Organic™ (Kroger), and Lanewyorkina.

Explore Similar Insights

Future Market Insights

United States Hispanic Novelties Market