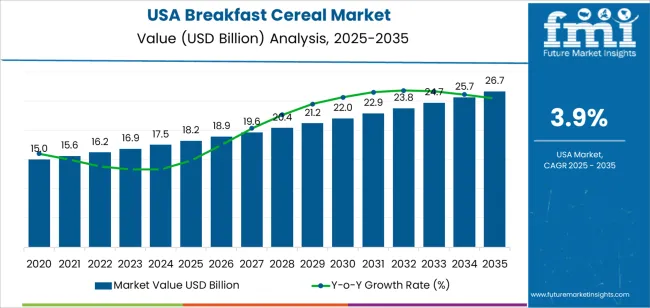
The USA breakfast cereal demand is valued at USD 18.2 billion in 2025 and is forecasted to reach USD 26.7 billion by 2035, reflecting a CAGR of 3.9%. Demand is influenced by steady consumption of packaged grain-based foods, continued reliance on convenience formats, and ongoing diversification of cereal formulations. Expanded distribution across retail chains, private-label participation, and the availability of products designed for specific dietary preferences support category stability. Product innovation involving whole grains, protein-fortified blends, and reduced-sugar formulations also contributes to sustained utilization across households.
Ready-to-eat cereal leads the product landscape. This segment remains established due to its portability, shelf life, and suitability for broad demographic groups. Manufacturers continue to adjust ingredient profiles and portion formats to meet regulatory requirements and shifting consumer expectations. Ready-to-eat cereal retains strong penetration within family households, institutional channels, and organized retail formats.
West USA, South USA, and Northeast USA record the highest utilization levels, supported by dense retail networks, established grocery distribution, and sustained demand for packaged convenience foods. These regions also maintain strong participation from supermarkets, club stores, and e-commerce platforms that distribute branded and private-label cereal varieties. Key suppliers include WK Kellogg Co., General Mills Inc., Nestlé’s CPW, Post Holdings, Inc., and PepsiCo (Quaker Oats). These companies provide ready-to-eat cereals, hot cereals, and grain-based blends used across household consumption, institutional food service, and retail distribution channels.
The growth-rate volatility index indicates a low-to-moderate fluctuation range, shaped by stable household purchasing patterns and mature product penetration. From 2025 to 2029, annual growth remains steady as ready-to-eat cereals and hot-cereal formats maintain consistent retail turnover. Demand is supported by routine breakfast habits, predictable procurement by large retailers, and gradual adoption of higher-fibre, reduced-sugar, and protein-fortified variants. These factors create a stable early-period profile with limited year-to-year variation.
Between 2030 and 2035, volatility remains contained as consumption patterns settle into long-term routines. Growth is shaped by incremental product reformulation, modest expansions in premium and organic lines, and steady participation in club stores, online grocery platforms, and value-focused channels. Annual changes avoid sharp swings because cereal demand is influenced more by dietary continuity than by seasonal or economic shocks. The resulting volatility index reflects a mature, demand-stable category marked by predictable replenishment cycles, long product lifespans in distribution, and consistent household utilisation across the United States.
| Metric | Value |
|---|---|
| USA Breakfast Cereal Sales Value (2025) | USD 18.2 billion |
| USA Breakfast Cereal Forecast Value (2035) | USD 26.7 billion |
| USA Breakfast Cereal Forecast CAGR (2025-2035) | 3.9% |
Demand for breakfast cereals in the USA is increasing in specific segments as consumers look for convenient, shelf-stable foods that fit busy routines. Growth is strongest in whole-grain, high-protein, low-sugar and fortified cereal lines that align with nutrition-focused purchasing. Many USA households continue to rely on ready-to-eat cereals because they offer fast preparation and long storage life, which supports consistent baseline demand. Manufacturers introduce cereals with higher fibre, plant-based ingredients and clean-label formulations to appeal to health-conscious Americans.
Expanded distribution through club stores, online grocery platforms and subscription models also reinforces volume in premium and speciality cereal categories. Constraints include competition from alternative breakfast options such as yogurt, breakfast bars and quick-serve items, which reduces traditional cereal consumption. Some consumers limit packaged foods due to sugar content or preference for fresh meals. Price fluctuations in grains and packaging materials also affect purchasing decisions in cost-sensitive USA households.
Demand for breakfast cereal in the United States reflects long-established consumption habits, interest in convenience-oriented meals, and growing adoption of alternative grain-based options. Nature-based preferences capture how consumers distribute purchases between conventional and organic variants. Product-type selection corresponds to preparation time, texture expectations, and dietary patterns across households. Sales-channel patterns highlight how Americans access cereal through retail environments that differ in assortment depth, pricing consistency, and brand visibility.
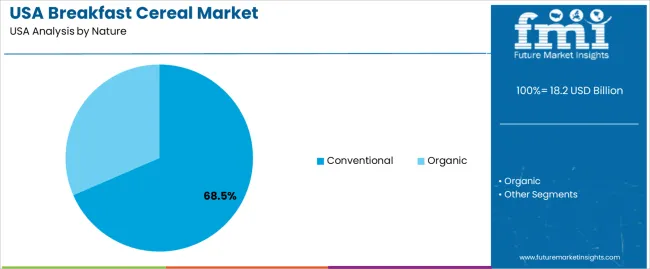
Conventional cereal holds 68.5% of national demand and represents the leading nature category. These products remain widely consumed due to availability, price accessibility, and established placement across major retail outlets. Organic cereal accounts for 31.5%, supporting consumers who priorities reduced synthetic additives and certified-production standards. Nature-based distribution reflects differences in cost tolerance, dietary choices, and household purchasing patterns influenced by ingredient profiles and labelling requirements.
Conventional products remain prominent due to broad brand portfolios and consistent supply, while organic products gain traction among health-conscious buyers. Both categories support varied formulations, including whole grains, multigrain blends, and fortified options used across USA households.
Key drivers and attributes:

Ready-to-eat cereal holds 72.8% of national demand and represents the dominant product type. Its convenience, minimal preparation requirements, and broad flavor range support widespread adoption among children and adults. Hot cereal accounts for 27.2%, serving consumers who prefer warm, fibre-rich options such as oatmeal and multigrain porridges. Product-type distribution reflects time constraints, meal-planning habits, and nutritional expectations across age groups. Ready-to-eat variants support quick consumption during morning routines, while hot cereal appeals to consumers seeking traditional textures or slower-digesting grains. Both categories contribute to breakfast diversity across USA households.
Key drivers and attributes:
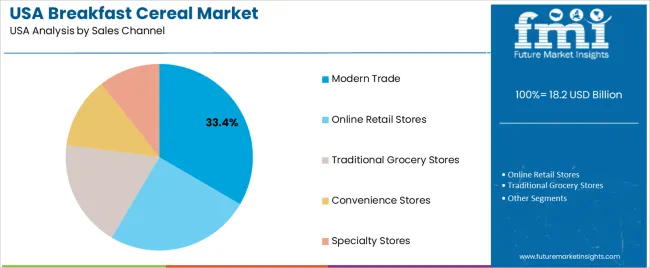
Modern trade channels hold 33.4% of national demand and represent the leading distribution pathway. Supermarkets and hypermarkets provide broad assortments, competitive pricing, and category visibility. Online retail stores account for 25.1%, supporting subscription purchasing and access to specialized products. Traditional grocery stores represent 18.6%, providing routine access within local neighbourhoods. Convenience stores hold 12.3%, supporting quick purchases during travel or work routines. Specialty stores account for 10.6%, offering premium, organic, and imported varieties. Channel distribution reflects shopping behaviour, price sensitivity, and product discovery patterns across USA consumers selecting cereals during routine or planned purchases.
Key drivers and attributes:
Rising adoption of portable breakfast formats, growth in USA whole-grain labeling programs and expansion of large grocery chains are driving demand.
In the United States, breakfast cereal demand is supported by strong participation in the Whole Grain Stamp program which encourages use of whole grain ingredients in packaged cereals. Major USA retailers such as Walmart, Kroger and Target allocate extensive shelf space to cereal, allowing national and regional brands to maintain visibility and high rotation. School breakfast programs and WIC eligibility for certain cereal types sustain stable baseline demand among families with children. Growth in ready-to-eat options aligns with American commuting habits where a significant share of workers prefers fast and portable early-morning foods, supporting category consumption.
High sensitivity to sugar content scrutiny, competition from USA breakfast substitutes and declining traditional breakfast routines restrain growth.
Public health discussions in the United States about sugar intake influence purchasing behaviour, especially among parents who monitor ingredient lists closely. Availability of USA breakfast substitutes such as breakfast sandwiches, protein shakes, bars and yogurt bowls reduces consumer reliance on cereal alone. Many Americans skip breakfast entirely or shift consumption to late-morning or snack occasions which decreases volume for traditional cereal formats. Retail promotions in large USA chains heavily influence demand patterns and reduced promotional frequency can lower household purchasing cycles, especially in price-sensitive segments.
Growth of high-protein cereal clusters, increased adoption of allergen-friendly and plant-based formulations and expansion of online club-store and subscription models define key USA trends.
Protein-fortified cereals and grain-free blends are gaining traction as USA consumers pursue fitness and weight-management goals. Allergen-friendly cereals free from gluten, dairy or soy see higher uptake in regions with strong health-food retail presence such as California and the Pacific Northwest. Online club-store formats and subscription delivery services have become meaningful distribution channels as American households buy cereals in bulk or through customized monthly boxes. These trends support continued evolution of the breakfast cereal category within the United States.
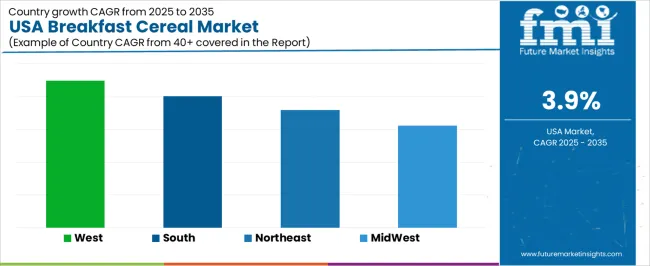
Demand for breakfast cereal in the USA continues to rise through 2035 as households, retailers, and food-service programs maintain stable interest in convenient, fortified, and shelf-stable morning foods. USA consumers increasingly adopt cereals as multipurpose items suitable for breakfast, snacking, and meal supplementation, strengthening demand for whole-grain, low-sugar, and fiber-enriched varieties. School breakfast programs, private-label expansion, and broader distribution through supermarkets and convenience stores support consistent category growth. Regional differences reflect demographic composition, income profiles, and the structure of local retail networks. West USA leads with 4.5%, followed by South USA (4.0%), Northeast USA (3.6%), and Midwest USA (3.1%).
| Region | CAGR (2025-2035) |
|---|---|
| West USA | 4.5% |
| South USA | 4.0% |
| Northeast USA | 3.6% |
| Midwest USA | 3.1% |
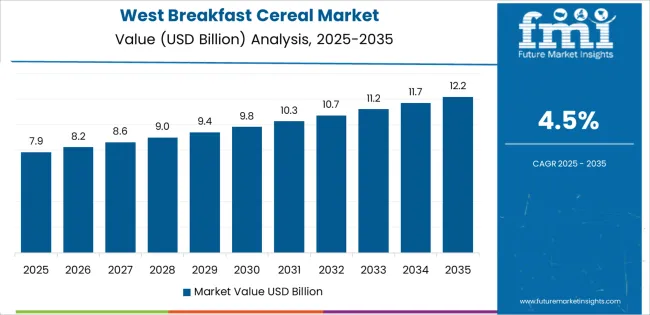
West USA grows at 4.5% CAGR, supported by strong demand for organic, whole-grain, and clean-label cereals across California, Washington, Oregon, Colorado, Nevada, and Arizona. Retail networks, including natural-food chains and large grocery cooperatives, expand selections of cereals containing oats, flaxseed, chia, nuts, and reduced-sugar grain blends. Higher adoption of health-focused diets in West Coast metropolitan areas strengthens demand for cereals fortified with fiber, plant protein, and functional ingredients.
Remote work patterns increase reliance on ready-to-eat items for morning meals. Public school districts in the region incorporate fortified cereals into federally supported breakfast programs, maintaining steady year-round volume. Outdoor recreation culture and fitness participation encourage consumption of granola and nutrient-dense cereal formats used as portable snacks.
South USA grows at 4.0% CAGR, driven by population growth, high household formation, and strong participation in value-oriented food categories across Texas, Florida, Georgia, North Carolina, Tennessee, and Alabama. The region’s larger average household size supports steady demand for family-size cereal boxes and cost-efficient private-label varieties. Retailers broaden offerings of multigrain, fiber-focused, and heart-health-positioned cereals as interest in nutritious but affordable breakfast routines increases. Convenience stores across intercity highways and commuter corridors expand single-serve cereal cups for on-the-go consumption. Rapid suburban expansion across Southern metropolitan areas increases overall category volume as new households adopt convenient breakfast formats.
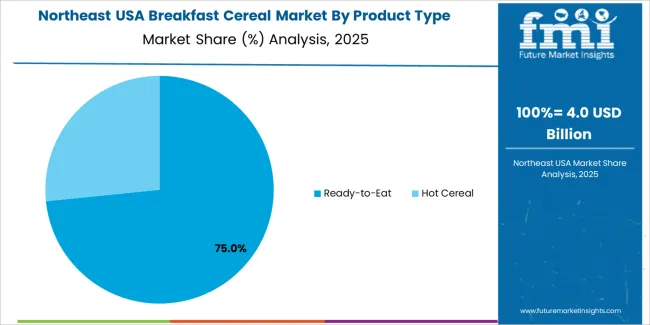
Northeast USA grows at 3.6% CAGR, shaped by dense urban centers, strong interest in premium food categories, and widespread access to natural-food retailers across New York, Massachusetts, Pennsylvania, New Jersey, and Connecticut. Consumers in this region show high adoption of whole-grain, organic, reduced-sugar, and allergen-sensitive cereal products. Retailers promote granola, muesli, and protein-enhanced cereals to meet the preferences of health-focused urban households. Universities, hospitals, and corporate cafeterias offer cereals through quick-service breakfast stations, supporting consistent demand during weekday mornings. Growing consumer attention to gluten-free and allergen-friendly diets reinforces the expansion of specialty cereal lines.
Midwest USA grows at 3.1% CAGR, supported by longstanding cereal-consumption patterns, strong grain-processing infrastructure, and widespread availability of traditional cereal varieties across Illinois, Ohio, Michigan, Minnesota, Wisconsin, and Iowa. Households purchase a mix of classic oat- and corn-based cereals along with gradually increasing adoption of whole-grain and fortified varieties. Supermarkets expand value-priced and family-size packs to align with cost-sensitive purchasing behavior. Local grain processors supply raw materials for cereal manufacturing, reinforcing stable regional distribution networks. Retailers in suburban and rural communities position cereals as affordable breakfast and snack options suited to diverse household needs, supporting steady year-round category performance.
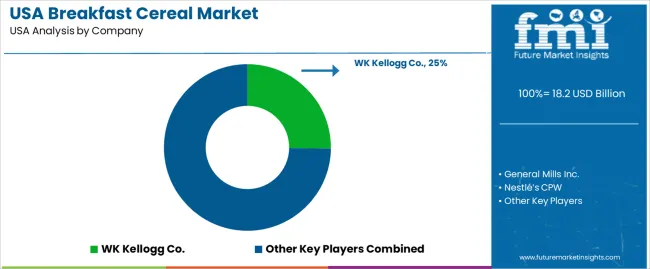
Demand for breakfast cereal in the USA is shaped by a group of national and multinational food manufacturers with long-established production, distribution, and retail footprints. WK Kellogg Co. holds the leading position with an estimated 25.2% share, supported by controlled grain-processing capability, consistent flavor and texture standards, and strong placement across supermarkets, club stores, and convenience outlets. Its position is reinforced by predictable product quality and wide adoption of established ready-to-eat cereal lines.
General Mills Inc. follows as a major participant, supplying oat- and corn-based cereals with stable moisture control, dependable shelf life, and consistent sensory characteristics suited to high-turnover USA retail channels. Nestlé’s CPW maintains a presence in the USA through selective product lines distributed via licensed and co-manufacturing arrangements, offering cereals with controlled whole-grain content and verified formulation standards.
Post Holdings, Inc. contributes significant volume across family, value, and specialty cereal formats, supported by reliable production capability and a broad retailer network. PepsiCo (Quaker Oats) adds depth through hot-cereal and oat-based products characterized by predictable cooking performance and consistent nutritional profiles.
Competition across this segment centers on grain-quality control, flavor consistency, nutritional positioning, packaging reliability, and distribution efficiency. Demand remains steady as USA households continue to purchase ready-to-eat and hot-cereal products that offer familiar taste profiles, convenient preparation, and consistent performance across diverse consumption patterns.
| Items | Values |
|---|---|
| Quantitative Units | USD billion |
| Nature | Conventional, Organic |
| Product Type | Ready-to-Eat, Hot Cereal |
| Sales Channel | Modern Trade, Online Retail Stores, Traditional Grocery Stores, Convenience Stores, Specialty Stores |
| Regions Covered | West USA, South USA, Northeast USA, Midwest USA |
| Key Companies Profiled | WK Kellogg Co., General Mills Inc., Nestlé’s CPW, Post Holdings, Inc., PepsiCo (Quaker Oats) |
| Additional Attributes | Dollar sales by nature, product type, and sales channel; regional consumption trends across West USA, South USA, Northeast USA, and Midwest USA; competitive landscape of breakfast cereal manufacturers; insights into clean-label cereals, whole-grain fortified products, and growing organic cereal demand; integration with retail distribution, online grocery channels, and health-oriented consumer segments in the USA. |
The demand for breakfast cereal in usa is estimated to be valued at USD 18.2 billion in 2025.
The market size for the breakfast cereal in usa is projected to reach USD 26.7 billion by 2035.
The demand for breakfast cereal in usa is expected to grow at a 3.9% CAGR between 2025 and 2035.
The key product types in breakfast cereal in usa are conventional and organic.
In terms of product type, ready-to-eat segment is expected to command 72.8% share in the breakfast cereal in usa in 2025.


Our Research Products

The "Full Research Suite" delivers actionable market intel, deep dives on markets or technologies, so clients act faster, cut risk, and unlock growth.

The Leaderboard benchmarks and ranks top vendors, classifying them as Established Leaders, Leading Challengers, or Disruptors & Challengers.

Locates where complements amplify value and substitutes erode it, forecasting net impact by horizon

We deliver granular, decision-grade intel: market sizing, 5-year forecasts, pricing, adoption, usage, revenue, and operational KPIs—plus competitor tracking, regulation, and value chains—across 60 countries broadly.

Spot the shifts before they hit your P&L. We track inflection points, adoption curves, pricing moves, and ecosystem plays to show where demand is heading, why it is changing, and what to do next across high-growth markets and disruptive tech

Real-time reads of user behavior. We track shifting priorities, perceptions of today’s and next-gen services, and provider experience, then pace how fast tech moves from trial to adoption, blending buyer, consumer, and channel inputs with social signals (#WhySwitch, #UX).

Partner with our analyst team to build a custom report designed around your business priorities. From analysing market trends to assessing competitors or crafting bespoke datasets, we tailor insights to your needs.
Supplier Intelligence
Discovery & Profiling
Capacity & Footprint
Performance & Risk
Compliance & Governance
Commercial Readiness
Who Supplies Whom
Scorecards & Shortlists
Playbooks & Docs
Category Intelligence
Definition & Scope
Demand & Use Cases
Cost Drivers
Market Structure
Supply Chain Map
Trade & Policy
Operating Norms
Deliverables
Buyer Intelligence
Account Basics
Spend & Scope
Procurement Model
Vendor Requirements
Terms & Policies
Entry Strategy
Pain Points & Triggers
Outputs
Pricing Analysis
Benchmarks
Trends
Should-Cost
Indexation
Landed Cost
Commercial Terms
Deliverables
Brand Analysis
Positioning & Value Prop
Share & Presence
Customer Evidence
Go-to-Market
Digital & Reputation
Compliance & Trust
KPIs & Gaps
Outputs
Full Research Suite comprises of:
Market outlook & trends analysis
Interviews & case studies
Strategic recommendations
Vendor profiles & capabilities analysis
5-year forecasts
8 regions and 60+ country-level data splits
Market segment data splits
12 months of continuous data updates
DELIVERED AS:
PDF EXCEL ONLINE
Breakfast Cereal Market Trends – Healthy & Indulgent Options Driving Growth 2025 to 2035
Demand for Breakfast Cereal in Japan Size and Share Forecast Outlook 2025 to 2035
Demand for Breakfast Takeout in USA Size and Share Forecast Outlook 2025 to 2035
USA Medical Coding Market Size and Share Forecast Outlook 2025 to 2035
Breakfast Drinks Market Size and Share Forecast Outlook 2025 to 2035
USA Labels Market Size and Share Forecast Outlook 2025 to 2035
USA Plant-based Creamers Market Size and Share Forecast Outlook 2025 to 2035
USA Barrier Coated Paper Market Size and Share Forecast Outlook 2025 to 2035
USA Electronic Health Records (EHR) Market Size and Share Forecast Outlook 2025 to 2035
USA Animal Model Market Size and Share Forecast Outlook 2025 to 2035
Cereal Flour Market Size and Share Forecast Outlook 2025 to 2035
USA and Canada Packer Bottle Market Size and Share Forecast Outlook 2025 to 2035
USA Stretch Hood Films Market Size and Share Forecast Outlook 2025 to 2035
USA and Canada Fence Screen Market Size and Share Forecast Outlook 2025 to 2035
USA Lubricant Contaminated HDPE Container Waste Market Size and Share Forecast Outlook 2025 to 2035
USA Commercial Walk-In Refrigeration Market Size and Share Forecast Outlook 2025 to 2035
USA & Canada Pre-painted Steel Roofing and Cladding Market Size and Share Forecast Outlook 2025 to 2035
USA Residential Cotton Candy Maker Market Size and Share Forecast Outlook 2025 to 2035
USA Faith Based Tourism Market Size and Share Forecast Outlook 2025 to 2035
United States NFC Lemon Juice Market Analysis - Size, Growth and Forecast 2025 to 2035

Thank you!
You will receive an email from our Business Development Manager. Please be sure to check your SPAM/JUNK folder too.
Chat With
MaRIA