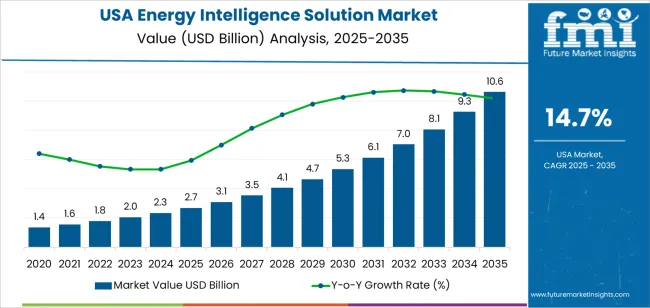
The USA energy intelligence solution demand is valued at USD 2.7 billion in 2025 and is forecasted to reach USD 10.6 billion by 2035, recording a CAGR of 14.7%. Demand is shaped by increased adoption of digital tools that monitor, analyse, and optimise energy consumption across commercial, industrial, and institutional facilities. Organisations use these systems to manage load profiles, control operational costs, and comply with efficiency-focused regulatory frameworks. Growth is reinforced by expanded deployment of sensors, smart meters, distributed-energy resources, and connected building-management platforms that depend on continuous data acquisition.
Energy management systems represent the leading solution category due to their broad role in integrating metering data, equipment-level performance signals, and predictive-analytics outputs. These systems support real-time monitoring, automated control strategies, and energy-use benchmarking across multi-site operations. Their use extends across manufacturing plants, data centres, healthcare facilities, and corporate campuses where structured optimisation tools reduce inefficiencies and support long-term operational planning.
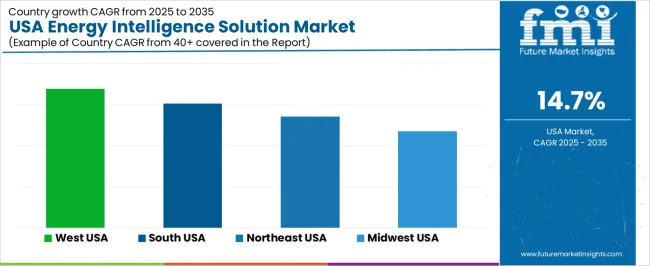
Demand is strongest in the West, South, and Northeast, where commercial-building density, industrial energy loads, and distributed-generation assets drive adoption. Key suppliers include Schneider Electric, Siemens, ABB Ltd, Emerson, General Electric, and Honeywell International Inc. These companies offer software platforms, monitoring hardware, and integration tools used to manage complex energy environments across enterprise facilities.
The growth contribution index shows that industrial and commercial users will account for the largest share of incremental expansion during the early period from 2025 to 2029. Manufacturing facilities, logistics centres, and large commercial buildings will drive adoption through monitoring of real-time loads, equipment-efficiency profiling, and automated demand-response programs. Utilities’ increasing use of grid-visualisation tools and advanced metering data will further strengthen early contributions.
Between 2030 and 2035, contributions broaden across municipal infrastructure, mid-sized enterprises, and distributed energy operators. Growth during this phase is shaped by lifecycle upgrades, predictive-maintenance systems, and integration with energy-storage platforms. Wider deployment of building-management systems and standardised interoperability with HVAC, lighting, and process-control equipment will add steady incremental contributions. Residential participation remains smaller but gradually expanding through smart-home energy dashboards and appliance-level monitoring. The contribution pattern overall reflects a segment driven first by high-load industrial and commercial users, then by diversified adoption across grid, building, and distributed-energy applications as intelligence solutions become embedded components of USA energy-management practice.
| Metric | Value |
|---|---|
| USA Energy Intelligence Solution Sales Value (2025) | USD 2.7 billion |
| USA Energy Intelligence Solution Forecast Value (2035) | USD 10.6 billion |
| USA Energy Intelligence Solution Forecast CAGR (2025-2035) | 14.7% |
Demand for energy intelligence solutions in the USA is increasing because businesses and utilities require advanced tools to monitor, analyse and optimise energy consumption across buildings, industrial sites and grid infrastructure. Growth in data-driven asset management, smart metering, and IoT connectivity supports adoption of platforms that deliver real-time insights, predictive analytics and automated control of energy systems. Rising electricity prices, regulatory pressure on emissions, and corporate ecofriendly goals drive investment in solutions that reduce energy cost, enhance resilience and support decarbonisation.
The expansion of cloud services and data-centre infrastructure places greater emphasis on energy-efficiency and dynamic demand-response strategies that energy intelligence systems enable. Constraints include high implementation cost, integration complexity with legacy systems, data-security and privacy concerns, and the requirement for skilled professionals to interpret insights and act on them. Some organisations may delay deployment until business cases are fully established.
Demand for energy-intelligence solutions in the United States reflects growing attention to operational efficiency, utility-cost management, and structured monitoring across commercial, industrial, public-sector, and residential environments. Adoption patterns differ by facility type, solution functionality, and deployment architecture. These systems support energy-use visibility, carbon-tracking requirements, and digital management of HVAC, lighting, and equipment loads. Distribution across end-use groups, solution categories, and deployment formats illustrates how organisations apply analytics, control tools, and ecofriendly platforms to support performance objectives and regulatory expectations.
Commercial buildings hold 35.0% of national demand and form the leading end-use segment. Offices, retail complexes, hospitals, and educational buildings rely on energy-intelligence tools for real-time monitoring, load optimisation, and consumption reporting across large facility footprints. Government and public-sector buildings represent 28.0%, using solutions to coordinate energy performance across administrative facilities, transport hubs, and public infrastructure. Residential buildings hold 18.6%, supported by connected-home systems and utility-linked dashboards that improve household consumption awareness. Industrial facilities account for 18.4%, integrating energy-intelligence functions into production lines and equipment schedules. End-use distribution reflects differences in building size, operational continuity, and performance-monitoring requirements.
Key drivers and attributes:
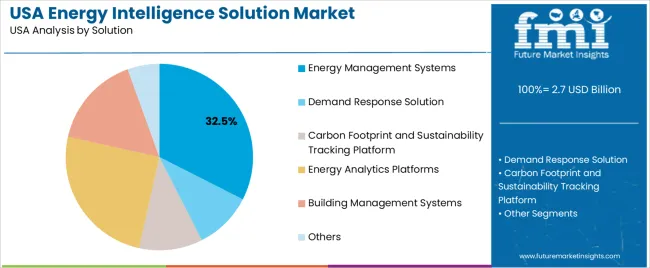
Energy-management systems hold 32.5% of USA demand and represent the leading solution category. These platforms support real-time metering, automated control, historical-trend analysis, and efficiency-improvement planning across diverse facilities. Energy-analytics platforms account for 25.0%, enabling consumption forecasting and anomaly detection. Building-management systems represent 16.0%, providing integrated control of HVAC, lighting, and equipment loads. Carbon-footprint and sustainability-tracking tools hold 11.0%, supporting reporting requirements and emissions-reduction initiatives. Demand-response solutions represent 10.0%, enabling load-shifting during peak-price events. The remaining 5.5% includes specialised optimisation and monitoring tools. Solution distribution reflects requirements for visibility, automation, and structured performance oversight.
Key drivers and attributes:
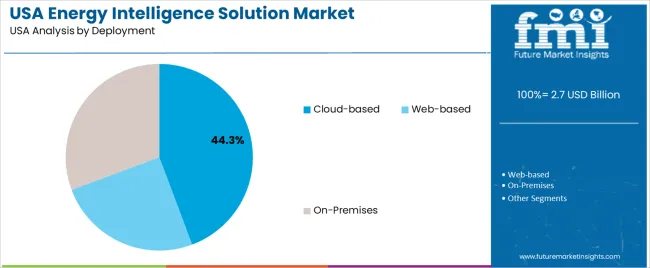
Cloud-based systems hold 44.3% of national demand and form the leading deployment format. These platforms support remote monitoring, scalable analytics, and frequent software updates, making them suitable for organisations with distributed assets or multi-site portfolios. On-premises deployments represent 30.7%, serving facilities requiring full internal control of data storage, network security, and system governance. Web-based platforms account for 25.0%, offering core functionality through browser-based interfaces with minimal installation requirements. Deployment distribution reflects security preferences, facility-management practices, and integration constraints across different user groups. Organisational priorities such as interoperability, operational continuity, and data-handling protocols shape adoption of each deployment type.
Key drivers and attributes:
Rising focus on ecofriendly, decarbonisation goals, and complex energy-use patterns are driving demand.
In the United States, demand for energy intelligence solutions is growing as commercial, industrial and institutional users seek platforms to monitor, analyse and optimise energy consumption across diverse assets. Corporate commitments to net-zero emissions, mandates for energy reporting and pressure to reduce operational cost create strong incentive for tools that provide real-time visibility, analytics and actionable insights. The growth of distributed energy resources (DERs), microgrids, renewable integration and flexible load management increases system complexity and amplifies the need for intelligence platforms that can handle multiple data sources and optimise dynamically. Enhanced capabilities in cloud analytics, IoT sensor networks and AI algorithms reinforce this trend.
Data-integration complexity, budget constraints and unclear ROI slowdown broader adoption.
Deploying energy intelligence solutions often requires integration of disparate systems (meters, building automation, production equipment), secure data handling and ongoing analytics which can increase implementation cost and effort. Smaller facilities may face budget restrictions and prioritise simpler energy-management measures rather than advanced intelligence platforms. Some users remain uncertain about the clear financial return on investment, especially when many benefits (e.g., resilience, sustainability) are harder to quantify in short term, which may delay decision-making.
Expansion of AI-driven energy analytics, growth in hybrid grid architecture support and rising demand in commercial real-estate and manufacturing sectors define key trends.
Solution vendors are increasingly embedding machine-learning and AI models into energy intelligence platforms to detect anomalies, predict equipment failures, recommend operational adjustments and provide forecasting. As grid architecture becomes more hybrid with DERs, energy storage and demand response programs, intelligence solutions that orchestrate these components are gaining traction. Demand is especially notable in commercial real-estate (CRE) portfolios and large manufacturing sites where energy spend is a major cost centre and performance gains are measurable. Vendor models are evolving from standalone software to platform-as-a-service and subscription models which improve accessibility and scalability.
Demand for energy intelligence solutions in the USA is rising through 2035 as commercial buildings, industrial facilities, utilities, and large campuses adopt data-driven platforms for monitoring, optimization, and predictive analysis of energy usage. Energy-intelligence systems support real-time metering, equipment-level diagnostics, automated alerts, and integrated reporting used to reduce operating costs and improve system reliability. Adoption also expands through ESG reporting needs, smart-grid integration, and wider installation of connected sensors across industrial and commercial environments. Regional growth reflects differences in energy-management investment, technology readiness, and infrastructure modernization. The West leads with a 16.9% CAGR, followed by the South (15.2%), the Northeast (13.5%), and the Midwest (11.8%).
| Region | CAGR (2025-2035) |
|---|---|
| West | 16.9% |
| South | 15.2% |
| Northeast | 13.5% |
| Midwest | 11.8% |
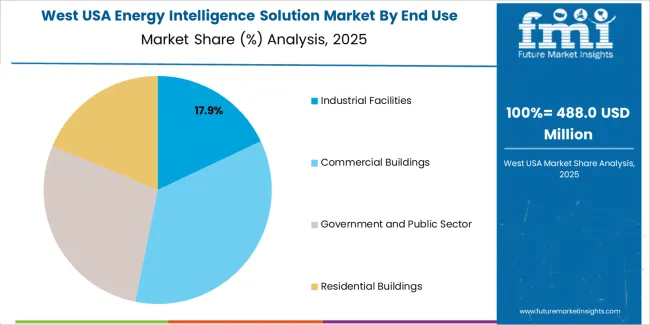
The West grows at 16.9% CAGR, supported by strong adoption across technology campuses, large commercial buildings, utilities, and industrial energy users in California, Washington, and Oregon. Data-center clusters use energy-intelligence platforms to optimize power usage effectiveness and oversee cooling-system performance. Utilities implement advanced metering, grid-analytics tools, and load-forecasting systems to balance renewable-energy inputs from solar and wind installations. Commercial real-estate operators monitor HVAC performance, lighting loads, and building-automation systems through consolidated dashboards. Industrial facilities use predictive-analysis tools to identify inefficiencies in motors, compressors, and production equipment. Strong emissions-reduction and efficiency-compliance requirements reinforce sustained adoption.
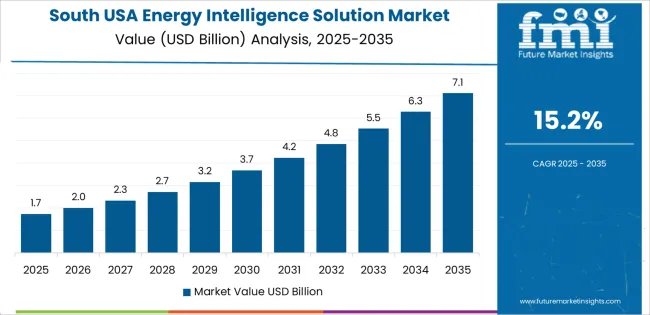
The South grows at 15.2% CAGR, supported by large energy-using industries, expanding data-center construction, and strong utility-modernization programs across Texas, Florida, Georgia, and North Carolina. Industrial plants deploy intelligence systems to monitor equipment loads, track fuel consumption, and identify efficiency gains across continuous-operation environments. Utilities adopt energy-management platforms to support grid-modernization efforts and manage variable-generation sources. Commercial buildings use real-time monitoring tools to improve HVAC efficiency during peak-temperature periods. Logistic hubs implement energy-intelligence systems for warehouse lighting and refrigeration oversight. Broad electrification initiatives across manufacturing and transport networks maintain long-term adoption.
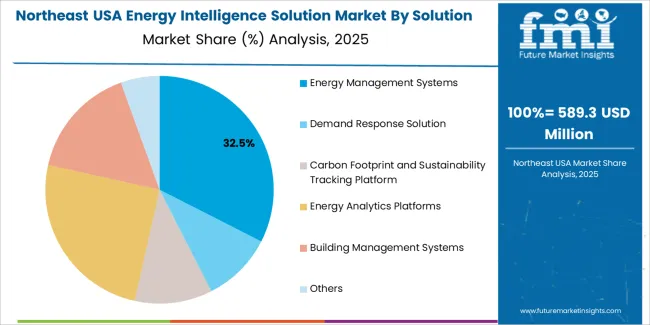
The Northeast grows at 13.5% CAGR, supported by adoption across financial institutions, research campuses, healthcare networks, and multi-facility commercial real-estate groups in New York, Massachusetts, and Pennsylvania. Large buildings use intelligence systems to meet energy-performance disclosure requirements and oversee carbon-reduction initiatives. Universities and research centers apply energy-monitoring tools to manage laboratories, data rooms, and specialized equipment with high energy intensity. Hospitals adopt energy-intelligence systems to track HVAC, sterilization, and backup-power usage. Regional utilities implement digital platforms to manage distributed-energy resources and improve load forecasting. Dense building stock with high energy needs maintains consistent demand.
The Midwest grows at 11.8% CAGR, supported by manufacturing operations, food-processing facilities, transportation hubs, and institutional buildings across Illinois, Michigan, Ohio, and Minnesota. Manufacturers rely on energy-intelligence systems to monitor compressed-air networks, heating loads, and production-line consumption. Food-processing facilities use real-time analytics to optimize refrigeration, boilers, and thermal-processing equipment. Universities and government buildings adopt monitoring tools to meet energy-management targets and track equipment performance. Utilities implement digital systems for load analysis and efficiency programs across industrial corridors. Although growth is slower compared with coastal regions, large energy-using facilities maintain steady demand.
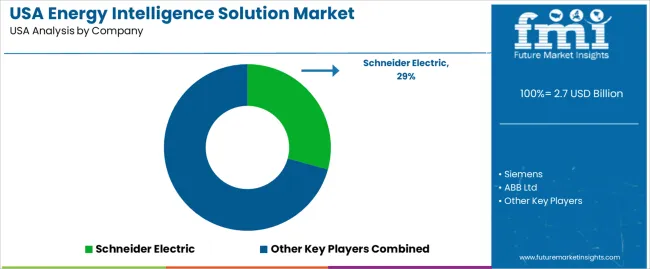
Demand for energy-intelligence solutions in the USA is shaped by a concentrated group of industrial-technology providers supporting grid operations, building-automation systems, manufacturing facilities, and large commercial campuses. Schneider Electric holds the leading position with an estimated 29.2% share, supported by its established energy-management platforms, stable hardware–software integration, and long-term relationships with utilities and enterprise clients. Its position is reinforced by consistent data-acquisition accuracy, reliable load-monitoring capability, and strong interoperability across electrical-distribution systems.
Siemens and ABB Ltd follow as significant participants, offering analytics platforms and monitoring systems that support demand forecasting, asset efficiency, and distributed-energy control. Their strengths include dependable sensor technologies, scalable supervisory frameworks, and alignment with USA industrial and commercial energy-efficiency requirements. Emerson maintains a notable presence through monitoring and optimisation tools used in manufacturing, process industries, and performance-critical infrastructure.
General Electric contributes additional capability with grid-focused energy-intelligence systems that support outage prediction, asset health assessment, and real-time grid visualisation. Honeywell International Inc. provides building-centric energy-intelligence platforms, focusing on HVAC optimisation, consumption analytics, and integrated building-performance systems.
Competition across this segment centers on data-accuracy performance, system interoperability, cybersecurity controls, analytics depth, and stability of real-time monitoring. Demand continues to expand as USA utilities, industrial operators, and commercial facilities pursue energy-efficiency improvements, grid-modernisation priorities, and data-driven operational optimisation supported by dependable, high-resolution energy-intelligence platforms.
| Items | Values |
|---|---|
| Quantitative Units | USD billion |
| End Use | Industrial Facilities, Commercial Buildings, Government and Public Sector, Residential Buildings |
| Solution | Energy Management Systems, Demand Response Solution, Carbon Footprint and Sustainability Tracking Platform, Energy Analytics Platforms, Building Management Systems, Others |
| Deployment | Cloud-based, Web-based, On-Premises |
| Regions Covered | West, Midwest, South, Northeast |
| Key Companies Profiled | Schneider Electric, Siemens, ABB Ltd, Emerson, General Electric, Honeywell International Inc. |
| Additional Attributes | Dollar sales by end-use, solution, and deployment categories; regional adoption trends across West, Midwest, South, and Northeast; competitive landscape of energy intelligence and smart building solution providers; advancements in real-time energy analytics, automated demand response, carbon tracking, and IoT-enabled building controls; integration with commercial buildings, industrial energy monitoring, public sector eco-friendly programs, and residential energy optimization across the USA. |
The global demand for energy intelligence solution in USA is estimated to be valued at USD 2.7 billion in 2025.
The market size for the demand for energy intelligence solution in USA is projected to reach USD 10.6 billion by 2035.
The demand for energy intelligence solution in USA is expected to grow at a 14.7% CAGR between 2025 and 2035.
The key product types in demand for energy intelligence solution in USA are industrial facilities , commercial buildings, government and public sector and residential buildings.
In terms of solution, energy management systems segment to command 32.5% share in the demand for energy intelligence solution in USA in 2025.


Our Research Products

The "Full Research Suite" delivers actionable market intel, deep dives on markets or technologies, so clients act faster, cut risk, and unlock growth.

The Leaderboard benchmarks and ranks top vendors, classifying them as Established Leaders, Leading Challengers, or Disruptors & Challengers.

Locates where complements amplify value and substitutes erode it, forecasting net impact by horizon

We deliver granular, decision-grade intel: market sizing, 5-year forecasts, pricing, adoption, usage, revenue, and operational KPIs—plus competitor tracking, regulation, and value chains—across 60 countries broadly.

Spot the shifts before they hit your P&L. We track inflection points, adoption curves, pricing moves, and ecosystem plays to show where demand is heading, why it is changing, and what to do next across high-growth markets and disruptive tech

Real-time reads of user behavior. We track shifting priorities, perceptions of today’s and next-gen services, and provider experience, then pace how fast tech moves from trial to adoption, blending buyer, consumer, and channel inputs with social signals (#WhySwitch, #UX).

Partner with our analyst team to build a custom report designed around your business priorities. From analysing market trends to assessing competitors or crafting bespoke datasets, we tailor insights to your needs.
Supplier Intelligence
Discovery & Profiling
Capacity & Footprint
Performance & Risk
Compliance & Governance
Commercial Readiness
Who Supplies Whom
Scorecards & Shortlists
Playbooks & Docs
Category Intelligence
Definition & Scope
Demand & Use Cases
Cost Drivers
Market Structure
Supply Chain Map
Trade & Policy
Operating Norms
Deliverables
Buyer Intelligence
Account Basics
Spend & Scope
Procurement Model
Vendor Requirements
Terms & Policies
Entry Strategy
Pain Points & Triggers
Outputs
Pricing Analysis
Benchmarks
Trends
Should-Cost
Indexation
Landed Cost
Commercial Terms
Deliverables
Brand Analysis
Positioning & Value Prop
Share & Presence
Customer Evidence
Go-to-Market
Digital & Reputation
Compliance & Trust
KPIs & Gaps
Outputs
Full Research Suite comprises of:
Market outlook & trends analysis
Interviews & case studies
Strategic recommendations
Vendor profiles & capabilities analysis
5-year forecasts
8 regions and 60+ country-level data splits
Market segment data splits
12 months of continuous data updates
DELIVERED AS:
PDF EXCEL ONLINE
Energy Intelligence Solution Market - Growth & Forecast 2025 to 2035
Demand for Energy Intelligence Solution in Japan Size and Share Forecast Outlook 2025 to 2035
USA Energy Gel Market Outlook – Size, Share & Forecast 2025–2035
Building Energy Management Solutions Market Size and Share Forecast Outlook 2025 to 2035
Industrial Operational Intelligence Solutions Market Size and Share Forecast Outlook 2025 to 2035
Demand for 3D Imaging Surgical Solution in USA Size and Share Forecast Outlook 2025 to 2035
Demand for Preoperative Bathing Solution in USA Size and Share Forecast Outlook 2025 to 2035
Demand for Hydrocarbon Accounting Solution in USA Size and Share Forecast Outlook 2025 to 2035
Energy-saving Constant Humidity Storage Cabinet Market Size and Share Forecast Outlook 2025 to 2035
Energy Efficient Window and Door Market Size and Share Forecast Outlook 2025 to 2035
Energy Efficient Motor Market Size and Share Forecast Outlook 2025 to 2035
Energy Gel Product Market Size and Share Forecast Outlook 2025 to 2035
Energy Dispersive X-ray Spectrometer Market Size and Share Forecast Outlook 2025 to 2035
USA Medical Coding Market Size and Share Forecast Outlook 2025 to 2035
Intelligence Surveillance Reconnaissance (ISR) Market Size and Share Forecast Outlook 2025 to 2035
USA Labels Market Size and Share Forecast Outlook 2025 to 2035
Energy Gel Product Market Analysis - Size, Share, and Forecast Outlook 2025 to 2035
USA Plant-based Creamers Market Size and Share Forecast Outlook 2025 to 2035
USA Barrier Coated Paper Market Size and Share Forecast Outlook 2025 to 2035
USA Electronic Health Records (EHR) Market Size and Share Forecast Outlook 2025 to 2035

Thank you!
You will receive an email from our Business Development Manager. Please be sure to check your SPAM/JUNK folder too.
Chat With
MaRIA