The demand for labelling machines in USA is valued at USD 4.2 billion in 2025 and is projected to reach USD 5.7 billion by 2035, reflecting a compound annual growth rate of 3.1%. Growth is shaped by steady requirements across food, beverage, pharmaceutical and household product facilities where automated labelling supports consistent package identification and compliance. As production lines increase throughput and expand format variations, manufacturers invest in systems that offer reliable placement, clearer print quality and improved changeover efficiency. Broader interest in serialization, barcoding and traceability strengthens procurement cycles. These factors reinforce a measured rise in adoption as companies maintain packaging accuracy and adapt equipment to evolving product portfolios throughout USA’s manufacturing landscape.
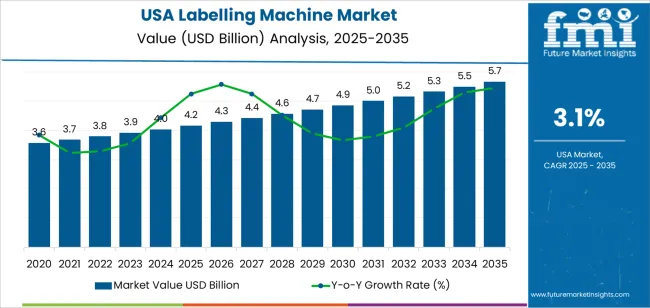
The growth curve shows a gradual upward progression beginning at USD 3.6 billion in earlier years and advancing to USD 4.2 billion in 2025 before moving toward USD 5.7 billion by 2035. Annual increases remain steady, with values rising from USD 4.3 billion in 2026 to USD 4.4 billion in 2027 and continuing with consistent spacing across subsequent years. This pattern reflects predictable equipment replacement, incremental capacity expansion and ongoing line modernization across multiple industries. As packaging demands broaden and production workflows adopt higher levels of automation, labelling machines maintain firm relevance, supporting a stable and sustained growth trajectory across USA’s industrial and consumer goods sectors.

Demand in USA for labelling machines is projected to grow from USD 4.2 billion in 2025 to USD 5.7 billion by 2035, reflecting a compound annual growth rate (CAGR) of approximately 3.1%. Starting at USD 3.6 billion in 2020, the value rises gradually USD 4.0 billion by 2024 and USD 4.2 billion in 2025 and then continues upward to USD 4.9 billion by 2030 and ultimately USD 5.7 billion by 2035. Growth is driven by ongoing automation in packaging operations, rising demand for traceability and smart labelling systems, and increased replacement of legacy equipment across food, beverage, pharmaceutical and consumer goods sectors.
Over the forecast period the value uplift from USD 4.2 billion to USD 5.7 billion an increase of USD 1.5 billion will be supported by both volume growth and rising per unit value. In the early years the increase is predominantly volume led as more production lines adopt labelling machines and retrofit older units. In the latter years’ value growth becomes more significant as machines incorporate advanced features such as vision inspection, IoT connectivity, faster changeovers and higher precision, supporting higher average selling prices. Suppliers focusing on high spec, intelligent labelling systems are best positioned to capture the incremental opportunity toward USD 5.7 billion by 2035.
| Metric | Value |
|---|---|
| Industry Value (2025) | USD 4.2 billion |
| Forecast Value (2035) | USD 5.7 billion |
| Forecast CAGR (2025 to 2035) | 3.1% |
The demand for labelling machines in USA is rising as manufacturers across food & beverage, pharmaceuticals, cosmetics, and consumer goods apply stricter regulations on traceability, batch identification, and product safety. Firms are investing in labelling machines that can handle diverse label formats, high-speed throughput, and variable data printing. E-commerce growth also fuels demand for flexible packaging lines that can adapt quickly to changing SKUs and direct-to-consumer shipment formats. Automation is increasingly preferred to reduce manual labour, minimise errors and integrate with digital production systems.
In addition, brand differentiation and customisation are influencing demand for labelling machines in USA. Companies seek machines capable of applying high-quality labels, sleeves or print-and-apply formats on bottles, tubs, flexible pouches and cartons. The shift to smaller batch runs, more frequent product updates and sustainability-oriented packaging (e.g., lighter weight or mono-material formats) increases the need for flexible labelling equipment. Although cost of new equipment, integration complexity and skill requirements can delay purchases in smaller operations, the broader need for efficiency, compliance and production agility supports steady growth in demand for labelling machines in USA.
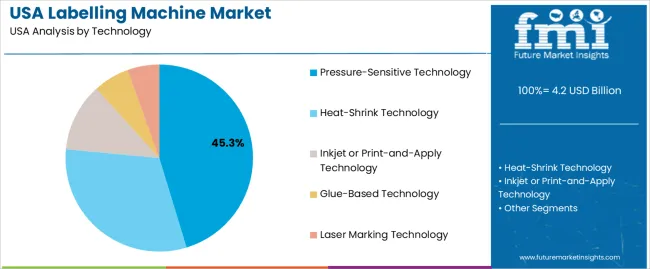
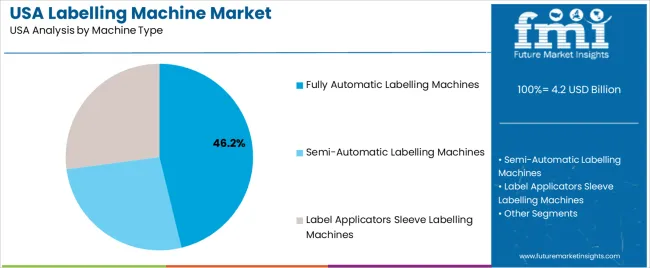
The demand for labelling machines in USA is shaped by the technologies applied in product identification and the machine types selected to match production requirements. Technologies include pressure-sensitive, heat-shrink, inkjet or print-and-apply, glue-based and laser marking systems, each supporting different material characteristics and line speeds. Machine types such as fully automatic labelling machines, semi-automatic models and label applicator or sleeve systems reflect varying throughput needs across manufacturing environments. As producers emphasize consistent presentation, reliable adhesion and efficient line integration, the combination of suitable technology and practical machine configuration guides adoption across food, beverage, pharmaceutical and consumer goods operations in USA.

Pressure-sensitive technology accounts for 45% of total demand for labelling machines in USA. This leading share reflects its compatibility with diverse container shapes and its stable adhesion on glass, plastic and metal surfaces. The technology supports clear placement at varied speeds and requires minimal cleanup, making it practical for busy packaging lines. Users value its ability to handle frequent label changes while maintaining steady alignment and print clarity. These characteristics suit sectors that depend on predictable labelling performance across large production volumes. Its straightforward operation and broad material handling further strengthen routine use in packaging environments.
Demand continues to grow as producers incorporate packaging designs that require flexible label formats. Pressure-sensitive systems maintain accuracy during rapid production cycles and support visually clean presentation across retail categories. Their alignment with automated inspection systems helps maintain consistent product appearance. Facilities rely on these systems to reduce downtime and simplify training for production staff. As manufacturers expand product ranges and maintain high throughput expectations, pressure-sensitive technology remains the preferred method for dependable label application across USA.

Fully automatic labelling machines account for 46.2% of total demand in USA. Their leading position reflects strong industry preference for high-capacity systems that support continuous production with minimal manual handling. These machines provide precise placement at consistent speeds, which helps maintain uniform product presentation. Fully automatic equipment integrates smoothly with conveyors, fillers and inspection units, making it suitable for large manufacturing operations. Production teams value the reduced variability and stable output these systems deliver during long cycles, reinforcing their role in environments with demanding volume requirements.
Demand for fully automatic machines increases as manufacturers focus on improving efficiency and reducing dependence on manual processes. Automated systems lower operating costs over time and support predictable label application for complex product lines. Their compatibility with multiple label materials and container shapes helps producers manage diverse packaging portfolios. Facilities also benefit from reduced error rates and improved workflow consistency. As companies upgrade packaging operations to meet growing production needs, fully automatic labelling machines remain central to high-performance labelling across USA.
Demand for labelling machines in the USA is rising as manufacturers across food & beverage, pharmaceuticals, personal care, and logistics sectors seek higher throughput, better accuracy and regulatory compliance. Automation, digital printing integration and traceability systems are driving newer equipment purchases. At the same time, barriers include high capital investment, tight margins for smaller producers and retrofit challenges in older production lines. These factors together influence how rapidly labelling machines are adopted across US manufacturing and packaging operations.
In the USA, stringent regulations around product labelling (including batch codes, safety information and traceability), combined with the shift to e-commerce and varied packaging formats, are prompting increased investment in modern labelling machines. Manufacturers are adopting print-and-apply systems, vision inspection and IoT-capable machines to meet these demands. The need for flexible labelling across diverse SKUs and fewer manual interventions is further accelerating demand. However, older plants with manual systems may delay investment due to integration cost and downtime concerns.
Growth opportunities in the USA lie in niche segments such as small-batch production, personalised packaging, contract manufacturing and line upgrades in existing plants. As consumer demand shifts to customised products-such as premium beverages, health-foods and private-label lines-labelling machines that can quickly change formats and print variable data become more attractive. Moreover, companies looking to adopt “smart factory” models seek labelling equipment with connectivity, predictive maintenance and analytics. Suppliers who offer modular, scalable and service-ready solutions are well positioned.
Despite strong demand drivers, several challenges limit broader adoption of labelling machines in the USA. Larger investments required for advanced machines discourage smaller manufacturers or those with older production lines from upgrading. Space constraints, integration with legacy equipment and the need for staff training for new systems add complexity. Also, the cost-benefit calculation may not favour full automation in low-volume or highly variable SKU environments. These factors moderate how quickly labelling machines become standard across all manufacturing tiers.

| Region | CAGR (%) |
|---|---|
| West | 3.6% |
| South | 3.2% |
| Northeast | 2.9% |
| Midwest | 2.5% |
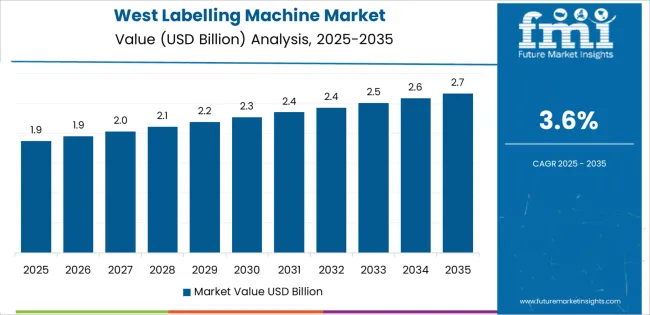
Demand for labelling machines in the USA is increasing at a steady pace across regions. The West leads at 3.6%, supported by active food processing, beverage production, and strong adoption of automated packaging systems. The South follows at 3.2%, driven by expanding manufacturing operations and steady upgrades to packaging lines across consumer goods industries. The Northeast records 2.9%, shaped by dense industrial clusters and consistent use of labelling equipment in pharmaceuticals, retail packaging, and specialty food sectors. The Midwest grows at 2.5%, where regional producers adopt automated labelling solutions to improve throughput and reduce handling time. These regional patterns reflect stable industrial activity and ongoing modernization of packaging operations across the country.

West USA is projected to grow at a CAGR of 3.6% through 2035 in demand for labelling machines. California and neighboring states are increasingly adopting automatic and semi-automatic labelling equipment for food, beverage, and pharmaceutical packaging. Rising demand for production efficiency, accuracy, and regulatory compliance drives adoption. Manufacturers provide machines suitable for bottles, cartons, and flexible packaging. Retailers and distributors ensure availability across urban and industrial facilities. Industrial expansion, packaging modernization, and increasing production volumes support steady adoption of labelling machines in West USA.
South USA is projected to grow at a CAGR of 3.2% through 2035 in demand for labelling machines. Texas, Florida, and Georgia are increasingly adopting automated labelling equipment for food, beverage, and pharmaceutical production lines. Rising need for accurate packaging, production efficiency, and error reduction drives adoption. Manufacturers provide versatile machines compatible with multiple container types. Retailers and distributors expand accessibility across urban and suburban production facilities. Industrial growth, packaging modernization, and consumer demand for consistent product presentation support steady adoption of labelling machines in South USA.

Northeast USA is projected to grow at a CAGR of 2.9% through 2035 in demand for labelling machines. New York, Boston, and Philadelphia are increasingly using automatic and semi-automatic labelling equipment for food, beverage, and pharmaceutical packaging. Rising production volumes, demand for consistent quality, and regulatory compliance drive adoption. Manufacturers provide machines suitable for bottles, cartons, and flexible packaging. Retailers and distributors expand access across commercial and industrial production facilities. Industrial expansion, packaging modernization, and urban consumption trends support steady adoption of labelling machines across Northeast USA.
Midwest USA is projected to grow at a CAGR of 2.5% through 2035 in demand for labelling machines. Chicago, Detroit, and Minneapolis are gradually adopting automatic and semi-automatic labelling equipment for food, beverage, and pharmaceutical production. Rising focus on accuracy, compliance, and efficiency drives adoption. Manufacturers provide machines compatible with multiple packaging formats. Retailers and distributors expand access across urban and semi-urban industrial facilities. Industrial modernization, packaging upgrades, and increased production volumes ensure steady adoption of labelling machines across Midwest USA.

The demand for labelling machines in the United States is driven by multiple industrial and regulatory factors. Growth in the packaged-goods sector especially in food & beverage, pharmaceuticals and consumer products underpins need for faster, more flexible and accurate labelling systems. Increased e-commerce and logistics activity also require variable data printing and change-over speed in labelling operations. Stringent regulatory mandates for traceability, batch codes and product safety are compelling manufacturers to adopt automation, vision inspection and smart labelling technologies. Automation and labour-efficiency goals further support investment in high-speed labelling machines to reduce downtime and meet diverse SKU demands.
Key companies active in the USA labelling-machine segment include I.M.A. Industries Macchine Automatiche S.p.A., Krones AG, SACMI Imola S.C., Sato Holdings Corporation and ProMach Inc. These firms supply labelling machines and integrated systems tailored to USA production environments and supply-chain demands. Their offerings include self-adhesive label applicators, wrap-around machines, print-and-apply systems and servo-driven models suited to high throughput. Through global engineering, local support services and alignment with automation trends, they help shape how labelling machinery is selected and deployed across USA manufacturing operations.
| Items | Values |
|---|---|
| Quantitative Units (2025) | USD billion |
| Technology | Pressure-Sensitive Technology, Heat-Shrink Technology, Inkjet or Print-and-Apply Technology, Glue-Based Technology, Laser Marking Technology |
| Machine Type | Fully Automatic Labelling Machines, Semi-Automatic Labelling Machines, Label Applicators Sleeve Labelling Machines |
| Label Type | Pressure-Sensitive Labels, Shrink Sleeves, Thermal Transfer Labels, Glue-Based Labels |
| End Use | Food & Beverages, Pharmaceuticals & Healthcare, Cosmetics & Personal Care, Industrial & Chemicals, Logistics & Warehousing, Retail & Consumer Goods |
| Region | Northeast, West, Midwest, South |
| Countries Covered | USA |
| Key Companies Profiled | I.M.A. Industries Macchine Automatiche S.p.A., Krones AG, SACMI Imola S.C., Sato Holdings Corporation, ProMach Inc. |
| Additional Attributes | Dollar by sales by technology, machine type, and label type; regional CAGR and growth trends; adoption across food, beverage, pharmaceutical, cosmetics, industrial, and logistics sectors; integration with automated packaging lines, vision inspection, and IoT-enabled smart systems; regulatory compliance and traceability requirements; adoption in e-commerce packaging and custom SKU production; retrofit and replacement cycles of legacy equipment; automation and labor efficiency drivers; demand for high-speed, high-precision systems; supplier service and maintenance support; scalability and modularity of labelling solutions across US manufacturing facilities. |
The demand for labelling machine in usa is estimated to be valued at USD 4.2 billion in 2025.
The market size for the labelling machine in usa is projected to reach USD 5.7 billion by 2035.
The demand for labelling machine in usa is expected to grow at a 3.1% CAGR between 2025 and 2035.
The key product types in labelling machine in usa are pressure-sensitive technology, heat-shrink technology, inkjet or print-and-apply technology, glue-based technology and laser marking technology.
In terms of machine type, fully automatic labelling machines segment is expected to command 46.2% share in the labelling machine in usa in 2025.


Our Research Products

The "Full Research Suite" delivers actionable market intel, deep dives on markets or technologies, so clients act faster, cut risk, and unlock growth.

The Leaderboard benchmarks and ranks top vendors, classifying them as Established Leaders, Leading Challengers, or Disruptors & Challengers.

Locates where complements amplify value and substitutes erode it, forecasting net impact by horizon

We deliver granular, decision-grade intel: market sizing, 5-year forecasts, pricing, adoption, usage, revenue, and operational KPIs—plus competitor tracking, regulation, and value chains—across 60 countries broadly.

Spot the shifts before they hit your P&L. We track inflection points, adoption curves, pricing moves, and ecosystem plays to show where demand is heading, why it is changing, and what to do next across high-growth markets and disruptive tech

Real-time reads of user behavior. We track shifting priorities, perceptions of today’s and next-gen services, and provider experience, then pace how fast tech moves from trial to adoption, blending buyer, consumer, and channel inputs with social signals (#WhySwitch, #UX).

Partner with our analyst team to build a custom report designed around your business priorities. From analysing market trends to assessing competitors or crafting bespoke datasets, we tailor insights to your needs.
Supplier Intelligence
Discovery & Profiling
Capacity & Footprint
Performance & Risk
Compliance & Governance
Commercial Readiness
Who Supplies Whom
Scorecards & Shortlists
Playbooks & Docs
Category Intelligence
Definition & Scope
Demand & Use Cases
Cost Drivers
Market Structure
Supply Chain Map
Trade & Policy
Operating Norms
Deliverables
Buyer Intelligence
Account Basics
Spend & Scope
Procurement Model
Vendor Requirements
Terms & Policies
Entry Strategy
Pain Points & Triggers
Outputs
Pricing Analysis
Benchmarks
Trends
Should-Cost
Indexation
Landed Cost
Commercial Terms
Deliverables
Brand Analysis
Positioning & Value Prop
Share & Presence
Customer Evidence
Go-to-Market
Digital & Reputation
Compliance & Trust
KPIs & Gaps
Outputs
Full Research Suite comprises of:
Market outlook & trends analysis
Interviews & case studies
Strategic recommendations
Vendor profiles & capabilities analysis
5-year forecasts
8 regions and 60+ country-level data splits
Market segment data splits
12 months of continuous data updates
DELIVERED AS:
PDF EXCEL ONLINE
Labelling Machine Market Growth & Industry Trends through 2035
C Wrap Labelling Machine Market
Wet Glue Labelling Machines Market
Clamshell Labelling Machines Market Growth - Trends & Forecast 2022 to 2032
Demand for Labelling Machine in Japan Size and Share Forecast Outlook 2025 to 2035
Wrap Around Labelling Machine Market
Semi Automatic Labelling Machines Market Size and Share Forecast Outlook 2025 to 2035
Bottle Sticker Labelling Machine Market Size and Share Forecast Outlook 2025 to 2035
Demand for Bandsaw Machines in USA Size and Share Forecast Outlook 2025 to 2035
USA Beauty and Personal Care (BPC) Retail Vending Machine Market Outlook 2025 to 2035
Demand for Slitting Machine in USA Size and Share Forecast Outlook 2025 to 2035
Demand for Box Sealing Machines in USA Size and Share Forecast Outlook 2025 to 2035
Demand for Tire Marking Machine in USA Size and Share Forecast Outlook 2025 to 2035
Hot Food Vending Machine Industry Analysis in USA & Canada - Size, Share, and Forecast 2025 to 2035
Demand for Feed Preparation Machine in USA Size and Share Forecast Outlook 2025 to 2035
Demand for Cup Fill and Seal Machine in USA Size and Share Forecast Outlook 2025 to 2035
Demand for Trash Rack Cleaning Machine in USA Size and Share Forecast Outlook 2025 to 2035
Demand for Softgel Encapsulation Machine in USA Size and Share Forecast Outlook 2025 to 2035
Demand for Corrugated Cardboard Cutting Machine in USA Size and Share Forecast Outlook 2025 to 2035
Demand for Hand Towel Automatic Folding Machine in USA Size and Share Forecast Outlook 2025 to 2035

Thank you!
You will receive an email from our Business Development Manager. Please be sure to check your SPAM/JUNK folder too.
Chat With
MaRIA