The demand for native advertising in the USA is projected to reach USD 230.9 billion by 2035, reflecting an absolute increase of USD 195.5 billion over the forecast period. Starting at USD 35.4 billion in 2025, the demand is expected to grow at a robust CAGR of 20.6%. Native advertising is a form of online advertising that matches the form and function of the platform on which it appears, providing a more seamless and engaging user experience. This method has gained significant traction due to its ability to deliver more organic and less intrusive advertising content compared to traditional display ads.
The key drivers for the growth of native advertising include the increasing shift of advertising budgets from traditional media to digital platforms, rising consumer demand for non-disruptive ad formats, and the growing effectiveness of personalized and targeted advertising. As digital consumption continues to rise, especially on mobile devices and social media, advertisers are investing more in native advertising to engage users within the content they are already consuming. Advancements in data analytics, artificial intelligence, and machine learning allow for more precise targeting, further driving the adoption of native advertising.
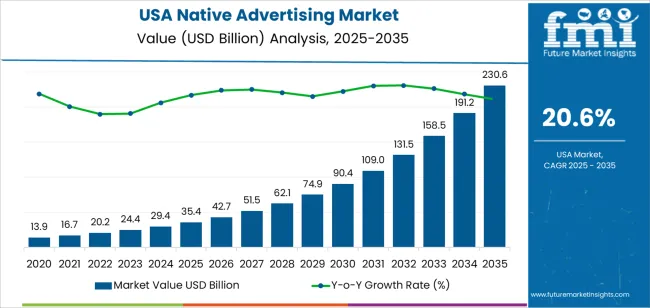
The breakpoint analysis for native advertising in the USA shows key inflection points that highlight significant shifts in the industry growth dynamics over the forecast period. From 2025 to 2030, the demand for native advertising will grow from USD 35.4 billion to USD 42.7 billion. This initial phase will be marked by gradual adoption as brands recognize the value of seamless, non-intrusive advertising formats. Growth will be driven by the increasing shift from traditional advertising methods to digital platforms, particularly in social media and content-driven websites. The transition to mobile-first advertising and the rising importance of personalized ad experiences will contribute to steady, though moderate, growth during this period.
From 2030 to 2035, the demand for native advertising will experience a sharp acceleration, growing from USD 42.7 billion to USD 230.9 billion. This rapid growth phase will be driven by the increasing dominance of digital and mobile platforms in advertising, alongside advancements in technology that enable more personalized and engaging ad formats. The rise in programmatic advertising and AI-driven targeting capabilities will lead to a boom in native advertising spending, allowing brands to reach more precise audiences. The growing preference for non-disruptive ad experiences and the integration of native ads into a wide array of content platforms will further fuel this growth. The acceleration during this phase reflects the maturation of native advertising as a mainstream strategy within digital promotion.
| Metric | Value |
|---|---|
| USA Native Advertising Sale Value (2025) | USD 35.4 billion |
| USA Native Advertising Forecast Value (2035) | USD 230.9 billion |
| USA Native Advertising Forecast CAGR (2025 2035) | 20.6% |
The demand for native advertising in the USA is accelerating as brands and advertisers shift toward formats that blend seamlessly into digital content environments rather than interrupting user experience. Native ads such as in‑feed placements, sponsored articles, recommendation widgets, and in‑app content all aim to match the look and feel of the platform where they appear. As consumers increasingly block or ignore traditional banners, native formats offer a way to engage users with less friction and higher relevance.
Mobile and social media usage have seen significant growth, which is further driving the adoption of native advertising. Consumers spend more time on mobile apps, social feeds, and content platforms where native ads perform better than standard display formats. Brands are leveraging native ads to provide storytelling, product discovery, and transactional opportunities directly within content streams, helping drive conversion and build stronger brand‑consumer relationships.
Advancements in artificial intelligence (AI), machine learning, and programmatic ad platforms are enhancing the targeting, personalization, and measurement capabilities of native advertising. These technological improvements make native ad campaigns more efficient, measurable, and cost‑effective. As data privacy regulations tighten and third‑party cookies become less reliable, advertisers are turning to native formats that rely on contextual relevance and first‑party data. Together, these factors underpin the strong growth projected for native advertising in the USA through the coming decade.
Demand for native advertising is segmented by type and platform. By type, demand is divided into in-feed ad units, search ads, promoted listings, recommendation units, and in-ad custom content, with in-feed ad units holding the largest share. The demand is also segmented by platform, including closed platforms, open platforms, and hybrid platforms, with closed platforms leading the demand. Regionally, demand is divided into West, South, Northeast, and Midwest.
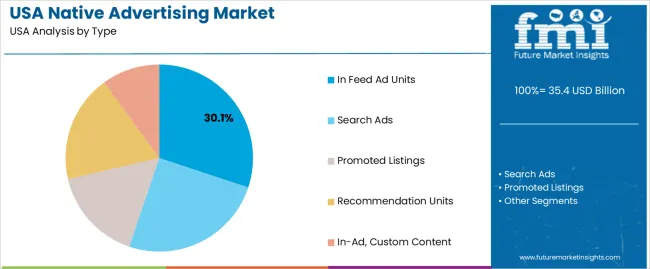
In feed ad units account for 30% of the demand for native advertising in the USA. These ads are seamlessly integrated into the content feeds of websites, social media platforms, or news articles, making them appear as part of the regular content rather than traditional advertisements. This format enhances the user experience by offering a more natural and less disruptive way for ads to be viewed. As a result, in-feed ads are more likely to be seen, leading to higher click-through rates and better overall performance compared to more intrusive ad formats.
The demand for in-feed ad units is driven by their ability to blend into content in a way that feels organic to users. As users have become more adept at blocking or ignoring traditional display ads, in-feed units provide a more effective alternative for advertisers. With increasing preference for non-intrusive advertising, in-feed ad units will continue to dominate the native advertising space in the coming years.
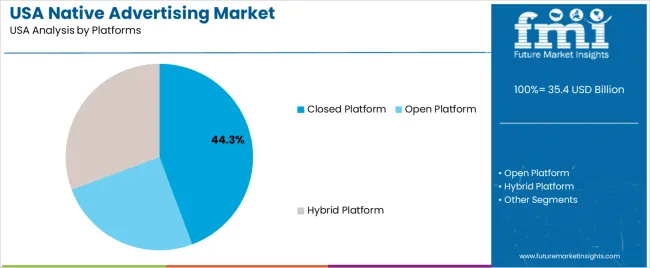
Closed platforms account for 44.3% of the demand for native advertising in the USA. Platforms like Facebook, Instagram, and LinkedIn offer advertisers a highly controlled, targeted environment for placing native ads. The closed nature of these platforms enables precise targeting based on extensive user data, including behavior, interests, and demographics. This level of targeting makes them highly effective for advertisers looking to reach specific, engaged audiences with tailored ad content.
The dominance of closed platforms in native advertising is driven by their ability to gather vast amounts of data, allowing advertisers to create highly relevant and personalized ad experiences. The platforms’ large, engaged user bases further enhance the potential for engagement and conversions. As targeted advertising continues to grow in importance, closed platforms are expected to remain the preferred choice for native ads, providing unmatched control and effectiveness for advertisers looking to maximize their reach and return on investment.
Native ads combine seamlessly with editorial, social or app content and deliver a less disruptive user experience. Key drivers include the shift of ad budgets to digital media, growing importance of storytelling and content promoting, advances in personalization through AI/data analytics, and regulatory pressure pushing salespersons toward context‑rich vs behavioral targeting. Restraints include consumer fatigue or mistrust when the “sponsored” nature of native content isn’t clearly disclosed, measurement and attribution challenges, and increasing competition among publishers for ad space leading to rising costs and diminishing differentiation.
Why is Demand for Native Advertising Growing in USA?
Demand in the USA is growing because digital consumption continues to rise sharply, especially via smartphones, apps and social platforms, making traditional banner or pop‑up ads less effective. Native advertising fits well into feeds, content streams and mobile experiences, appearing more natural and less jarring to users this improves engagement and conversion potential. As regulatory frameworks around user data (such as limits on third‑party cookies) tighten, dealers favour ad formats that rely more on contextual relevance and first‑party data rather than invasive tracking. The convergence of mobile‑first behavior, content consumption patterns and brand desire for subtle yet measurable engagement is driving growth in native advertising.
How are Technological Innovations Driving Growth of Native Advertising in the USA?
Technological innovations are accelerating growth by making native advertising smarter, more scalable and more personalized. Advances in AI, machine‑learning and programmatic ad‑tech enable dynamic creative optimization, real‑time bidding, and micro‑targeting of native ad placements. Data‑driven tools allow brands to deliver contextually relevant messages that match the user’s content environment, improving user experience and ad effectiveness. Mobile app environments, video‑first formats, in‑feed and recommendation widgets broaden the ad‑format palette. Also, as closed‑platform ecosystems (social media apps, content platforms) enhance their ad‑tech stack, native ads become more integrated and easier to deploy at scale, driving further adoption.
What are the Key Challenges Limiting Adoption of Native Advertising in the USA?
Even with strong growth, there are notable hurdles. One major challenge is transparency and consumer trust: when native ads aren’t clearly labelled, users may feel misled and publishers risk reputational damage. Measurement and attribution remain complex-since native ads merge with editorial content, tracking conversion paths and comparing ROI with traditional formats can be difficult. There is also rising competition for premium placement and increased costs as demand climbs. Finally, regulatory requirements around disclosures, data usage and consumer protection (e.g., from the California Consumer Privacy Act) impose constraints on how native advertising can be executed, limiting flexibility and increasing compliance costs.
| Region | CAGR (%) |
|---|---|
| West | 23.7% |
| South | 21.2% |
| Northeast | 19.0% |
| Midwest | 16.5% |
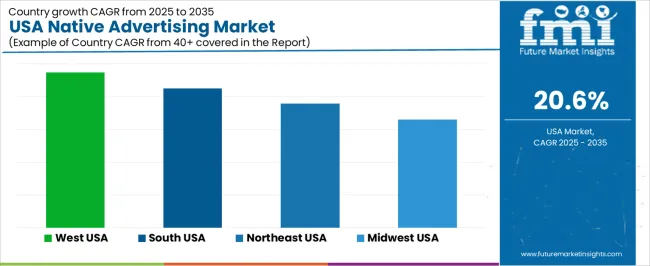
The demand for native advertising in the USA is growing rapidly across all regions, with the West leading at a 23.7% CAGR. This growth is primarily driven by the increasing use of content-driven, non-intrusive advertising strategies in digital promoting. The South follows with a 21.2% CAGR, fueled by a growing e-commerce industry and the adoption of innovative promoting methods. The Northeast shows a 19.0% CAGR, influenced by its strong tech and media sectors. The Midwest experiences a more moderate growth rate of 16.5%, supported by the ongoing digital transformation in traditional industries.
The West is experiencing the highest demand for native advertising in the USA, with a 23.7% CAGR. This growth can be attributed to the region’s dominance in the technology and digital promoting sectors. Major tech hubs like Silicon Valley, San Francisco, and Seattle are home to companies that are at the forefront of digital promoting innovations, driving the widespread adoption of native advertising strategies. Companies in the West are leveraging the growing trend of personalized and content-driven promoting to create more meaningful interactions with consumers.
As digital platforms and social media continue to evolve, native advertising has become a preferred format due to its non-disruptive nature, allowing advertisers to blend seamlessly into content. The region’s active focus on environmental responsibility and consumer engagement has made it a natural leader in adopting content-based, less intrusive forms of advertising. As the West leads in the adoption of new digital advertising techniques, the demand for native advertising is expected to remain robust.
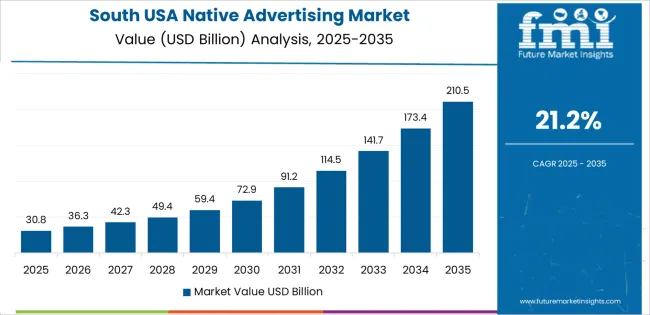
The South is seeing strong growth in demand for native advertising, with a 21.2% CAGR. This is largely driven by the region’s fast-growing e-commerce and tech industries, particularly in states like Texas, Georgia, and Florida. With a large consumer base and increasing investment in digital promoting strategies, businesses in the South are rapidly adopting native advertising to engage their audiences in a more authentic and personalized manner.
As the region continues to focus on expanding its tech and digital infrastructure, native advertising is gaining traction in sectors such as retail, real estate, and healthcare. The South’s expanding media presence, coupled with the growing popularity of digital content and mobile usage, has created a favorable environment for the rise of native advertising. The demand for seamless, engaging, and non-intrusive advertisements in the South is expected to continue to grow as businesses increasingly recognize the value of connecting with their customers in subtler and engaging ways.
The Northeast is experiencing steady growth in demand for native advertising, with a 19.0% CAGR. The region’s high concentration of media companies, digital publishers, and advertisers in cities like New York, Boston, and Philadelphia has created an ideal environment for the adoption of native advertising. With an established reputation for innovation, the Northeast has become a key player in the digital promoting landscape, where native ads are increasingly used to enhance user engagement.
The Northeast’s focus on media, technology, and content-driven advertising plays a significant role in the growing demand for native ads. As more brands turn to content that aligns with consumer preferences, native advertising, which blends seamlessly with editorial content, has become a favored option. The region’s evolving promoting strategies, combined with a tech-savvy and media-driven consumer base, ensures that the demand for native advertising will continue to grow at a strong pace in the coming years.
The Midwest is seeing moderate growth in demand for native advertising, with a 16.5% CAGR. This is largely due to the ongoing digital transformation of industries in the region, particularly in sectors like automotive, manufacturing, and agriculture. As businesses in these industries seek more innovative and effective ways to reach consumers, they are increasingly turning to native advertising to deliver content that resonates with their audience in a non-intrusive manner.
The region’s focus on digital promoting, especially in cities like Chicago, Detroit, and St. Louis, is driving the adoption of native ads, with companies recognizing the importance of integrating their promoting efforts into the digital content that consumers are already engaging with. Although the growth rate in the Midwest is more moderate compared to the West and South, the ongoing investment in digital platforms and content promoting ensures that the region’s demand for native advertising will continue to grow steadily, as businesses evolve with the changing promoting landscape.
The demand for native advertising in the USA is surging as brands and dealers pivot toward advertising formats that blend seamlessly into content, thereby delivering higher engagement and less disruption to user experience. Native ads such as sponsored articles, in‑feed promotions, and embedded multi‑media content are increasingly favoured within digital promoting strategies because they align more naturally with editorial environments and offer measurable outcomes.
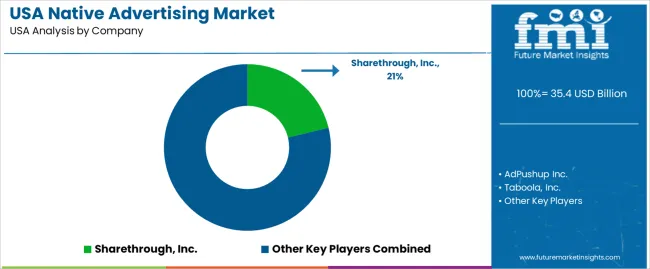
In the USA demand landscape, Sharethrough, Inc. holds a significant share of approximately 21.2%, reflecting its strong position in delivering in‑feed native advertising solutions and helping publishers monetize content while enabling brands to amplify reach. Other prominent companies offering native advertising solutions in the U.S. include AdPushup Inc., Taboola, Inc., IAB Playbook, Instinctive Inc., and Nativo, Inc., each supporting a mix of publisher monetisation, ad‑technology platforms and brand‑sponsored content programs.
The increasing consumer resistance to traditional banner formats and ad‑blocking; the rise of mobile‑first and social‑native experiences; and the need for brands to create contextually relevant messaging that matches content consumption patterns. Evolving privacy regulation and the phasing‑out of third‑party cookies are encouraging advertisers to lean into native formats that depend less on intrusive tracking and more on contextual and first‑party data. Challenges remain, including ensuring transparency in ad labelling, measuring performance reliably, and integrating native formats with broader programmatic campaigns. Nonetheless, the demand for native advertising in the U.S. is poised to grow further as digital media consumption continues to evolve.
| Items | Values |
|---|---|
| Quantitative Unit | USD billion |
| Product Type | In Feed Ad Units, Search Ads, Promoted Listings, Recommendation Units, In-Ad, Custom Content |
| Platforms | Closed Platform, Open Platform, Hybrid Platform |
| Regions Covered | West, South, Northeast, Midwest |
| Key Players Profiled | Sharethrough, Inc., AdPushup Inc., Taboola, Inc., IAB Playbook, Instinctive Inc., Nativo, Inc. |
| Additional Attributes | Dollar sales for USA native advertising are driven by various ad types such as in-feed ad units, search ads, promoted listings, recommendation units, and in-ad custom content. The industry is segmented into closed, open, and hybrid platforms, with regional trends showing strong demand across the West, South, Northeast, and Midwest. Focus is on digital promoting sectors driving growth. |
The global demand for native advertising in USA is estimated to be valued at USD 35.4 billion in 2025.
The market size for the demand for native advertising in USA is projected to reach USD 230.6 billion by 2035.
The demand for native advertising in USA is expected to grow at a 20.6% CAGR between 2025 and 2035.
The key product types in demand for native advertising in USA are in feed ad units, search ads, promoted listings, recommendation units and in-ad, custom content.
In terms of platforms, closed platform segment to command 44.3% share in the demand for native advertising in USA in 2025.


Our Research Products

The "Full Research Suite" delivers actionable market intel, deep dives on markets or technologies, so clients act faster, cut risk, and unlock growth.

The Leaderboard benchmarks and ranks top vendors, classifying them as Established Leaders, Leading Challengers, or Disruptors & Challengers.

Locates where complements amplify value and substitutes erode it, forecasting net impact by horizon

We deliver granular, decision-grade intel: market sizing, 5-year forecasts, pricing, adoption, usage, revenue, and operational KPIs—plus competitor tracking, regulation, and value chains—across 60 countries broadly.

Spot the shifts before they hit your P&L. We track inflection points, adoption curves, pricing moves, and ecosystem plays to show where demand is heading, why it is changing, and what to do next across high-growth markets and disruptive tech

Real-time reads of user behavior. We track shifting priorities, perceptions of today’s and next-gen services, and provider experience, then pace how fast tech moves from trial to adoption, blending buyer, consumer, and channel inputs with social signals (#WhySwitch, #UX).

Partner with our analyst team to build a custom report designed around your business priorities. From analysing market trends to assessing competitors or crafting bespoke datasets, we tailor insights to your needs.
Supplier Intelligence
Discovery & Profiling
Capacity & Footprint
Performance & Risk
Compliance & Governance
Commercial Readiness
Who Supplies Whom
Scorecards & Shortlists
Playbooks & Docs
Category Intelligence
Definition & Scope
Demand & Use Cases
Cost Drivers
Market Structure
Supply Chain Map
Trade & Policy
Operating Norms
Deliverables
Buyer Intelligence
Account Basics
Spend & Scope
Procurement Model
Vendor Requirements
Terms & Policies
Entry Strategy
Pain Points & Triggers
Outputs
Pricing Analysis
Benchmarks
Trends
Should-Cost
Indexation
Landed Cost
Commercial Terms
Deliverables
Brand Analysis
Positioning & Value Prop
Share & Presence
Customer Evidence
Go-to-Market
Digital & Reputation
Compliance & Trust
KPIs & Gaps
Outputs
Full Research Suite comprises of:
Market outlook & trends analysis
Interviews & case studies
Strategic recommendations
Vendor profiles & capabilities analysis
5-year forecasts
8 regions and 60+ country-level data splits
Market segment data splits
12 months of continuous data updates
DELIVERED AS:
PDF EXCEL ONLINE
Native Advertising Market Analysis - Trends & Forecast 2025 to 2035
Native Video Advertising Market Size and Share Forecast Outlook 2025 to 2035
Demand for Native Advertising in Japan Size and Share Forecast Outlook 2025 to 2035
USA Medical Coding Market Size and Share Forecast Outlook 2025 to 2035
Advertising Optimization Plan Market Size and Share Forecast Outlook 2025 to 2035
USA Labels Market Size and Share Forecast Outlook 2025 to 2035
USA Plant-based Creamers Market Size and Share Forecast Outlook 2025 to 2035
USA Barrier Coated Paper Market Size and Share Forecast Outlook 2025 to 2035
USA Electronic Health Records (EHR) Market Size and Share Forecast Outlook 2025 to 2035
USA Animal Model Market Size and Share Forecast Outlook 2025 to 2035
USA and Canada Packer Bottle Market Size and Share Forecast Outlook 2025 to 2035
USA Stretch Hood Films Market Size and Share Forecast Outlook 2025 to 2035
USA and Canada Fence Screen Market Size and Share Forecast Outlook 2025 to 2035
USA Lubricant Contaminated HDPE Container Waste Market Size and Share Forecast Outlook 2025 to 2035
USA Commercial Walk-In Refrigeration Market Size and Share Forecast Outlook 2025 to 2035
USA & Canada Pre-painted Steel Roofing and Cladding Market Size and Share Forecast Outlook 2025 to 2035
USA Residential Cotton Candy Maker Market Size and Share Forecast Outlook 2025 to 2035
USA Faith Based Tourism Market Size and Share Forecast Outlook 2025 to 2035
United States NFC Lemon Juice Market Analysis - Size, Growth and Forecast 2025 to 2035
USA and Canada Copper Market Insights - Demand, Size & Industry Trends 2025 to 2035

Thank you!
You will receive an email from our Business Development Manager. Please be sure to check your SPAM/JUNK folder too.
Chat With
MaRIA