The demand for switchgear in the USA is expected to reach USD 3.1 billion by 2035, reflecting an absolute increase of USD 1.2 billion over the forecast period. Starting at USD 1.9 billion in 2025, the demand is expected to grow at a steady CAGR of 4.8%. Switchgear refers to a collection of electrical disconnect switches, fuses, or circuit breakers used to control, protect, and isolate electrical equipment. In electrical power systems, ensuring safe and efficient operation is essential, making it critical across industries from utilities to industrial manufacturing.
The key growth drivers for switchgear include the expansion of electrical grids, particularly in renewable energy integration, the rise in electrical infrastructure projects, and growing demand for energy-efficient and smart grid systems. As the push for cleaner energy sources intensifies, the adoption of switchgear technologies that facilitate the management and distribution of power from renewable sources is increasing. The need for enhanced grid reliability and energy security, particularly in the context of severe weather events, is driving demand for robust and adaptable switchgear solutions.
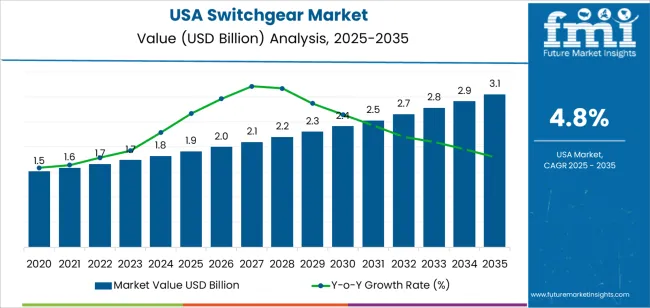
From 2025 to 2030, demand is expected to grow steadily, increasing from USD 1.9 billion to USD 2.7 billion. This phase will experience moderate annual growth, driven by ongoing infrastructure upgrades, grid modernization, and the replacement of aging electrical equipment. The growth rate during this period is expected to remain relatively stable, with only slight fluctuations. Factors such as regional infrastructure projects, regulatory changes, and the continued need for modern, efficient electrical systems will contribute to this steady expansion. The volatility during this phase is expected to be low, with consistent progress toward upgrading the electrical grid.
From 2030 to 2035, the demand for switchgear will accelerate, rising from USD 2.7 billion to USD 3.1 billion. This period will see more pronounced growth as smart grid technologies, energy storage solutions, and the integration of renewable energy sources gain prominence. The growth rate will increase, but with higher volatility, driven by technological advancements and industry trends. For instance, the rapid adoption of automation, advances in switchgear technology, and greater investment in renewable energy infrastructure will contribute to industry acceleration. This period will also experience fluctuations based on technological breakthroughs, changing regulations, and the pace of renewable energy adoption. Despite the volatility, the overall trend will be marked by strong growth as the demand for efficient, reliable electrical systems rises.
| Metric | Value |
|---|---|
| USA Switchgear Sale Value (2025) | USD 1.9 billion |
| USA Switchgear Forecast Value (2035) | USD 3.1 billion |
| USA Switchgear Forecast CAGR (2025 to 2035) | 4.8% |
The demand for switchgear in the USA is rising as electric utilities, industrial facilities, and commercial buildings invest in modernizing their electrical distribution infrastructure. Switchgear plays a key role in protecting and controlling electrical networks, enabling safe switching, isolation and fault management for medium‑ and high‑voltage systems. As aging infrastructure is upgraded and renewable energy integration expands, the need for reliable switchgear becomes more important.
Growth in sectors such as data centres, manufacturing, and commercial real estate is contributing to increased switchgear deployment. These facilities demand high power reliability and continuity, which requires advanced switchgear systems with improved performance, safety features, and automation. With power consumption rising and grid complexity increasing, facilities are upgrading to digitalised switchgear systems that support remote monitoring and predictive maintenance.
Technological advancements are boosting adoption of advanced switchgear solutions. Features like vacuum or SF₆‑free interrupters, IoT connectivity, smart diagnostics and compact modular designs are making switchgear more efficient and cost‑effective. With regulatory pressure to improve grid resilience and reduce downtime, the demand for modern switchgear is expected to grow steadily in the USA through 2035.
Demand for switchgear is segmented by component type, voltage type, and construction type. By component type, demand is divided into power distributor switch breakers, switch disconnectors, MCCBs, HRC fuses, and earth switches. The demand is also segmented by voltage type, including low voltage (less than 1kV), medium voltage (1kV to 75kV), high voltage (75kV to 230kV), extra high voltage (230kV to 500kV), and ultra-high voltage (above 500kV). In terms of construction type, demand is divided into outdoor, indoor, and other types. Regionally, demand is divided into West, South, Northeast, and Midwest.
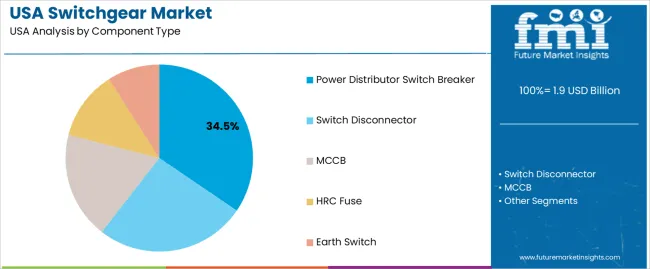
Power distributor switch breakers account for 35% of the demand for switchgear in the USA. These switch breakers are crucial in power distribution networks, providing reliable protection by interrupting electrical faults and safeguarding equipment. They serve as the backbone of power distribution systems, ensuring grid stability and preventing outages. As demand for electricity grows, the need for modernized and efficient grid systems becomes more critical, driving the demand for power distributor switch breakers.
These devices are indispensable for managing electrical failures, such as short circuits and overloads, making them essential for maintaining infrastructure reliability. Their effectiveness in providing protection in various scenarios, including both residential and industrial environments, solidifies their dominant role in the switchgear segment. As efforts to enhance the safety and efficiency of power distribution increase, power distributor switch breakers will continue to play a leading role in meeting these needs.

Low voltage (less than 1kV) switchgear accounts for 37.2% of the demand for switchgear in the USA. This type of switchgear is integral to residential, commercial, and industrial applications where it is used to control and protect electrical circuits. Its widespread adoption is due to its versatility and ability to manage commonly used voltage levels. Low voltage switchgear ensures safety by preventing electrical hazards, making it the most commonly used voltage type.
The demand for low voltage switchgear is driven by its extensive use across sectors, from household appliances to large-scale industrial machinery. With a heightened focus on electrical safety and equipment protection, the need for low voltage switchgear continues to grow. As the demand for electricity rises and infrastructure expands, low voltage switchgear remains essential in ensuring the safety and efficiency of electrical systems. Its role will continue to be pivotal in maintaining operational safety and reliability across industries.

Outdoor switchgear accounts for 47.5% of the demand for switchgear in the USA. This type is commonly used in power generation plants, substations, and large industrial facilities, where it must endure harsh environmental conditions. Designed for high reliability, outdoor switchgear can withstand extreme temperatures, humidity, and weather conditions, making it essential for outdoor installations. Its robustness ensures continued operation, even in the most challenging settings, where reliable and long-lasting equipment is needed.
The growing demand for outdoor switchgear is driven by the development of power generation and distribution infrastructure, particularly in large, open spaces. As electrical grids expand and new power generation facilities are built, the need for outdoor switchgear remains strong. This type of switchgear ensures safety and reliability, making it a vital component in electrical distribution systems. With ongoing infrastructure projects, outdoor switchgear continues to lead in construction type demand, offering durability and dependable performance in demanding environments.
Switchgear is crucial for controlling, protecting, and isolating electrical circuits across various voltage levels. Key drivers include grid modernization, reliability improvement, growth in renewables and electrification (e.g., electric vehicles and storage), and the digitalization of equipment (IoT, remote monitoring). Restraints include high raw material and manufacturing costs, supply chain bottlenecks, long lead times, and complex regulatory standards, particularly in high-voltage applications.
Why is Demand for Switchgear Growing in USA?
Demand for switchgear in the USA is growing as utilities, commercial and industrial users need to manage increasing electricity loads, distributed energy generation, and higher demands for grid reliability and resilience. Much of the country’s electrical infrastructure is aging and in need of significant upgrades or retrofitting to handle modern energy demand.
The rise of renewable energy sources such as solar and wind, along with battery storage systems, places new demands on switchgear to handle fluctuating power flows, bidirectional energy distribution, and advanced fault management. These systems are necessary to ensure that energy is distributed safely and reliably across grids. Government-funded programs aimed at infrastructure modernization, including those that promote cleaner, more resilient power systems, also accelerate the adoption of advanced, modern switchgear technology.
How are Technological Innovations Driving Growth of Switchgear in USA?
Technological innovations are a key factor driving the growth of switchgear in the USA by improving the performance, safety, and efficiency of electrical systems. Recent advancements include digital switchgear that features embedded sensors and real-time fault detection, enabling predictive maintenance and remote monitoring.
These innovations allow utilities and industries to identify issues before they become major problems, reducing downtime and improving operational efficiency. New insulation technologies, such as vacuum or SF₆-free solutions, address environmental concerns and reduce maintenance requirements. Modular and compact designs are also expanding the applications of switchgear, making them suitable for smaller spaces like data centers and renewable energy sites while handling higher voltage classes.
What are the Key Challenges Limiting Adoption of Switchgear in USA?
One of the primary barriers is the high cost of materials, particularly copper, aluminum, and steel, which drives up the price of switchgear and extends payback periods for businesses and utilities. The supply chain is experiencing disruptions, leading to long lead times for custom high-voltage equipment, as well as a reliance on imports that may create procurement delays.
Regulatory and standards complexity particularly for high-voltage systems or those subject to SF₆ regulations adds to the difficulty of implementing new technologies. Many smaller utilities and facilities are constrained by tight budgets and a more conservative approach to procurement, which slows the adoption of innovative, higher-cost technologies. These factors combined contribute to slower, uneven adoption of advanced switchgear across different regions and sectors of the industry.
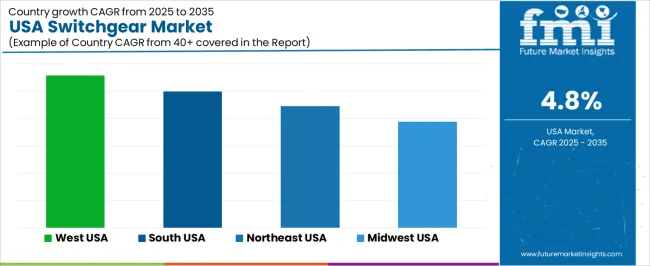
| Region | CAGR (%) |
|---|---|
| West | 5.6% |
| South | 5.0% |
| Northeast | 4.5% |
| Midwest | 3.9% |
The demand for switchgear in the USA is growing across all regions, with the West leading at a 5.6% CAGR. This growth is primarily driven by infrastructure development and rising energy needs. The South follows with a 5.0% CAGR, supported by its growing industrial base and the need for reliable power distribution. The Northeast shows a 4.5% CAGR, influenced by its focus on upgrading aging infrastructure and expanding energy systems. The Midwest experiences moderate growth at 3.9%, driven by increasing demand for modernized electrical grids and industrial applications.

The West is experiencing the highest demand for switchgear in the USA, with a 5.6% CAGR. This is largely due to the region’s strong infrastructure development and the growing need for efficient and reliable electrical distribution. The West, particularly states like California, is leading the way in renewable energy adoption, requiring advanced switchgear solutions to manage and distribute power effectively from various energy sources, including solar and wind.
The region's expanding tech sector and population growth are also major contributors to the increased demand for switchgear. As cities in the West continue to grow and build smart grids, the need for more sophisticated switchgear to ensure safe and reliable power distribution becomes more urgent. The West’s commitment to energy efficiency and environmental responsibility has led to investments in modernizing electrical systems, further driving the demand for switchgear in the region.

The South is experiencing strong growth in demand for switchgear, with a 5.0% CAGR. The region’s expanding industrial base, particularly in states like Texas, Florida, and Georgia, is a key driver behind this demand. As industries such as manufacturing, petrochemical, and utilities continue to grow, the need for reliable and efficient power distribution systems becomes increasingly important. This drives the adoption of modern switchgear to improve operational efficiency and safety.
The South’s increasing investment in infrastructure and energy systems, as well as a growing population, contribute to the demand for advanced switchgear. The region is also seeing significant growth in renewable energy, particularly in wind and solar power, which further drives the need for upgraded electrical systems. As the region focuses on energy resilience and smart grid technologies, the demand for switchgear will continue to rise steadily.
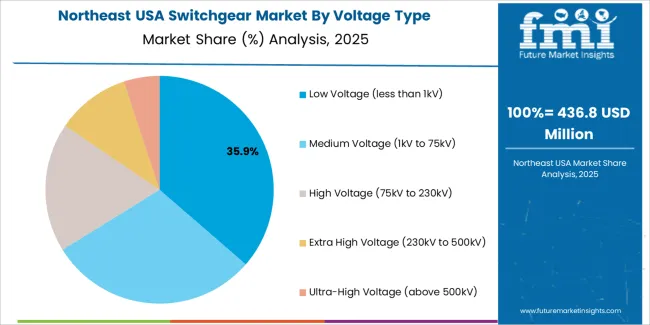
The Northeast is seeing steady growth in demand for switchgear, with a 4.5% CAGR. The region’s focus on upgrading its aging electrical infrastructure, combined with the need to support renewable energy projects, is a key driver of this growth. Cities like New York, Boston, and Philadelphia are investing heavily in smart grid technologies, energy storage, and distributed energy systems, all of which require advanced switchgear solutions to ensure efficient power distribution.
The Northeast’s push toward environmental responsibility and reducing carbon emissions is accelerating the adoption of renewable energy sources, which require modernized electrical grids to integrate solar, wind, and other renewable sources of power. As the region works to modernize its energy infrastructure and meet growing demand, the demand for switchgear continues to rise. The region’s commitment to improving the reliability and efficiency of its electrical systems will support ongoing growth in switchgear demand.
The Midwest is experiencing moderate growth in demand for switchgear, with a 3.9% CAGR. The region’s growth is driven by increasing investments in infrastructure, particularly in the power generation and distribution sectors. As the Midwest continues to modernize its electrical grids and expand renewable energy adoption, the demand for switchgear is rising to ensure safe and reliable power distribution.
The Midwest’s industrial sector, including manufacturing and agriculture, is also contributing to the demand for switchgear, as these industries require reliable power for operations. As states like Michigan, Illinois, and Ohio upgrade their energy systems to improve grid reliability and accommodate renewable energy, the need for advanced switchgear solutions will continue to grow. While the growth rate in the Midwest is slower than in other regions, ongoing investments in infrastructure and energy efficiency will continue to support steady demand for switchgear in the coming years.
Demand for switchgear in the United States is rising steadily as energy infrastructures undergo modernization, renewable integration expands, and data‑center power demands escalate. Switchgear essential equipment for controlling, protecting, and isolating electrical systems is increasingly required across utilities, industrial, commercial, and infrastructure projects to ensure reliability and safety in evolving grid and facility deployments.
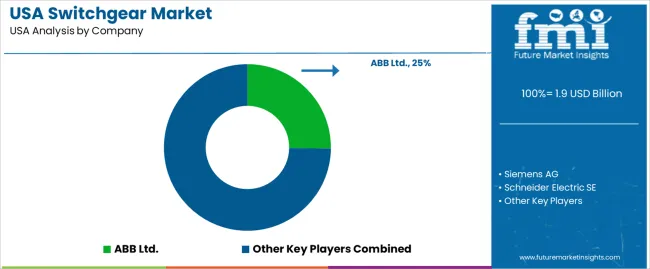
In the U.S. demand landscape, ABB Ltd. holds an approximate 25.2% share, reflecting its strong presence through high‑quality switchgear solutions and integrated offerings in the industry. Other significant players include Siemens AG, Schneider Electric SE, General Electric (GE), and Eaton Corporation, each contributing extensive product portfolios and addressing demand from utilities, industrial projects, renewables, and data‑center operators.
Key drivers of demand in the U.S. include large‑scale grid upgrade initiatives (such as under the Bipartisan Infrastructure Law), growth in data centers with high power densities, the adoption of advanced fault‑detection and remote‑monitoring capabilities, and the shift toward renewable and distributed energy systems requiring specialized switchgear. At the same time, challenges such as high upfront cost, global supply‑chain constraints (especially raw materials like steel and copper), and technical requirements for new insulation technologies (such as SF₆‑free systems) pose some constraints. Nonetheless, the overall outlook for switchgear demand in the U.S. remains strong and growth‑oriented.
| Items | Values |
|---|---|
| Quantitative Unit | USD billion |
| Component Type | Power Distributor Switch Breaker, Switch Disconnector, MCCB, HRC Fuse, Earth Switch |
| Voltage Type | Low Voltage (less than 1kV), Medium Voltage (1kV to 75kV), High Voltage (75kV to 230kV), Extra High Voltage (230kV to 500kV), Ultra-High Voltage (above 500kV) |
| Construction Type | Outdoor, Indoor, Others |
| Regions Covered | West, South, Northeast, Midwest |
| Key Players Profiled | ABB Ltd., Siemens AG, Schneider Electric SE, General Electric (GE), Eaton Corporation |
| Additional Attributes | Dollar sales are influenced by component types such as switch breakers and MCCBs, with voltage types ranging from low to ultra-high voltage. Regional distribution trends focus on the West, South, Northeast, and Midwest, with construction types spanning indoor, outdoor, and others, particularly driving energy and utility sector growth. |
The global demand for switchgear in USA is estimated to be valued at USD 1.9 billion in 2025.
The market size for the demand for switchgear in USA is projected to reach USD 3.1 billion by 2035.
The demand for switchgear in USA is expected to grow at a 4.8% CAGR between 2025 and 2035.
The key product types in demand for switchgear in USA are power distributor switch breaker, switch disconnector, mccb, hrc fuse and earth switch.
In terms of voltage type, low voltage (less than 1kv) segment to command 37.2% share in the demand for switchgear in USA in 2025.


Our Research Products

The "Full Research Suite" delivers actionable market intel, deep dives on markets or technologies, so clients act faster, cut risk, and unlock growth.

The Leaderboard benchmarks and ranks top vendors, classifying them as Established Leaders, Leading Challengers, or Disruptors & Challengers.

Locates where complements amplify value and substitutes erode it, forecasting net impact by horizon

We deliver granular, decision-grade intel: market sizing, 5-year forecasts, pricing, adoption, usage, revenue, and operational KPIs—plus competitor tracking, regulation, and value chains—across 60 countries broadly.

Spot the shifts before they hit your P&L. We track inflection points, adoption curves, pricing moves, and ecosystem plays to show where demand is heading, why it is changing, and what to do next across high-growth markets and disruptive tech

Real-time reads of user behavior. We track shifting priorities, perceptions of today’s and next-gen services, and provider experience, then pace how fast tech moves from trial to adoption, blending buyer, consumer, and channel inputs with social signals (#WhySwitch, #UX).

Partner with our analyst team to build a custom report designed around your business priorities. From analysing market trends to assessing competitors or crafting bespoke datasets, we tailor insights to your needs.
Supplier Intelligence
Discovery & Profiling
Capacity & Footprint
Performance & Risk
Compliance & Governance
Commercial Readiness
Who Supplies Whom
Scorecards & Shortlists
Playbooks & Docs
Category Intelligence
Definition & Scope
Demand & Use Cases
Cost Drivers
Market Structure
Supply Chain Map
Trade & Policy
Operating Norms
Deliverables
Buyer Intelligence
Account Basics
Spend & Scope
Procurement Model
Vendor Requirements
Terms & Policies
Entry Strategy
Pain Points & Triggers
Outputs
Pricing Analysis
Benchmarks
Trends
Should-Cost
Indexation
Landed Cost
Commercial Terms
Deliverables
Brand Analysis
Positioning & Value Prop
Share & Presence
Customer Evidence
Go-to-Market
Digital & Reputation
Compliance & Trust
KPIs & Gaps
Outputs
Full Research Suite comprises of:
Market outlook & trends analysis
Interviews & case studies
Strategic recommendations
Vendor profiles & capabilities analysis
5-year forecasts
8 regions and 60+ country-level data splits
Market segment data splits
12 months of continuous data updates
DELIVERED AS:
PDF EXCEL ONLINE
Switchgear for Data Centers Market Size and Share Forecast Outlook 2025 to 2035
Switchgear Market Growth - Trends & Forecast 2025 to 2035
AC Switchgear Market Size and Share Forecast Outlook 2025 to 2035
DC Switchgear Market - Size, Share, and Forecast 2025 to 2035
Hybrid Switchgear Market Size and Share Forecast Outlook 2025 to 2035
Demand for Switchgear in Japan Size and Share Forecast Outlook 2025 to 2035
Commercial Switchgear Market Size and Share Forecast Outlook 2025 to 2035
DC Traction Switchgear Market Size and Share Forecast Outlook 2025 to 2035
Paralleling Switchgear Market Growth – Trends & Forecast 2024-2034
Pad Mounted Switchgear Market Growth – Trends & Forecast 2024-2034
Gas Insulated Switchgear (GIS) Bushing Market Size and Share Forecast Outlook 2025 to 2035
Utility Scale Switchgear Market Size and Share Forecast Outlook 2025 to 2035
Gas Insulated Switchgear Market Size and Share Forecast Outlook 2025 to 2035
Gas Insulated Switchgears (GIS) Market
AC Residential Switchgear Market Size and Share Forecast Outlook 2025 to 2035
Vacuum Insulated Switchgear Market Size and Share Forecast Outlook 2025 to 2035
Indoor Residential Switchgear Market Size and Share Forecast Outlook 2025 to 2035
Outdoor Residential Switchgear Market Size and Share Forecast Outlook 2025 to 2035
Low Voltage Commercial Switchgear Market Size and Share Forecast Outlook 2025 to 2035
Low Voltage Residential Switchgear Market Size and Share Forecast Outlook 2025 to 2035

Thank you!
You will receive an email from our Business Development Manager. Please be sure to check your SPAM/JUNK folder too.
Chat With
MaRIA