Visitor Identification Software Market
Market Insights on Visitor Identification Software covering sales outlook, demand forecast & up-to-date key trends
Visitor Identification Software Market by Organization Size, Pricing Model & Region - Forecast 2022 – 2032
Visitor Identification Software Market Outlook (2022-2032)
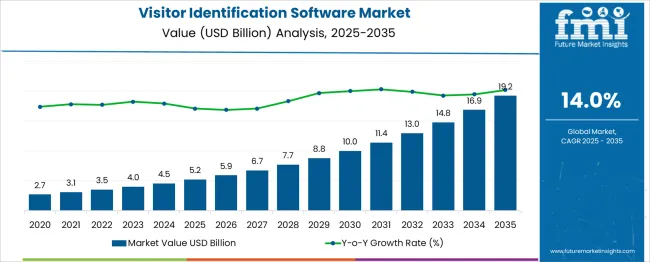
[333 Pages Report] The visitor identification software market is anticipated to record a CAGR of 14% during the forecast period (2022 - 2032).
The visitor identification software market is expected to be valued at US$ 3.5 Billion in 2022 and is likely to reach US$ 13.0 Billion by 2032.
“The demand for visitor identification software is growing as key players are finding out the lost information and trying to convert their website visitors into leads. As marketers target visitors with their relevant content, the adoption of visitor identification software is also rising. This factor increases the sales of visitor identification software on a global level.”
The visitor identification software is likely to help the business grow and make a complete profile of their website visitors to launch the campaign with the relevant visitors. Thus, visitor identification software market trends are leading in a favorable direction.
Attributes |
Details |
Visitor Identification Software Market CAGR (2022-2032) |
14% |
Visitor Identification Market Value (2022) |
US$ 3.5 Bn |
Visitor Identification Software Market Value (2032) |
US$ 13.0 Bn |
Don't pay for what you don't need
Customize your report by selecting specific countries or regions and save 30%!
What are the Changes Undergone by the Visitor Identification Software Market due to COVID-19?
In the crisis caused by the pandemic, the sales of visitor identification software have risen significantly as most companies have moved to a remote work model to implement social distancing norms. This factor is projected to generate demand for visitor identification software all around the globe.
As per the visitor identification software market report, with the COVID-19 crisis, the digital world has expanded its business despite the test of resilience subjected to the virus. The adoption of visitor identification software has risen as the market players have turned the situation into an opportunity for growth.
The demand for visitor identification software is growing amongst all the digital security systems as the visitor identification software focuses primarily on employee safety which is a need of the hour.
What are the Key Visitor Identification Software Market Dynamics?
The importance of tracking visitor movements through numerous organizations is a key element driving the global visitor identification software market to develop.
Visitor identification software is a software-based tool that collects, tracks, documents, and recovers visitor information to manage visitor activities inside the office/building. Market firms are increasingly employing organic and inorganic growth tactics to remain competitive in the changing visitor identification software market outlook.
The end-user industries of visitor identification software are continuously contributing to the dynamic environment and growth of the visitor identification software market share. These industries - mainly BFSI, IT & Telecom, Consumer Durables & Electronics, Travel & Hospitality, and Automotive are expanding their reach globally.
The industries are encouraging the adoption of visitor identification software to enable the calculation of visitors through the website at a higher accuracy rate.
The visitor's identification software records all the data related to the visitor and provides security digitally, which lifts the demand for visitor identification software. To identify and manage visitors with accuracy, marketers are adopting visitor identification software in the organization.
Find your sweet spots for generating winning opportunities in this market.
Talk to AnalystComparative View of Adjacent Visitor Identification Software Market
Visitor Identification Software:
Attributes |
Visitor Identification Software |
CAGR (2022-2032) |
14% |
Market Value (2026) |
US$ 13 Bn |
Growth Factor |
Rising importance of tracking movements through various organizations is a key propellor for the growth of visitor identification software market share. |
Opportunity |
The current inclination towards customization of software on a global scale is driving the visitor identification software market. |
Key Trends |
The key players are enabling the development of visitor identification software market by adopting new strategies on a continual basis. |
Visitor Management System Market:
Attributes |
Visitor Management System Market |
CAGR (2022-2032) |
16.7% |
Market Value (2026) |
US$ 2.3 Billion |
Growth Factor |
Software-based security solutions are becoming increasingly popular. |
Opportunity |
COVID-19 pioneered the path for a workplace that is fully automated, digital, and touchless. |
Key Trends |
Various factors are driving the expansion of the visitor management system market, including increased awareness of expanding security concerns, the demand for a paperless administration, and the growing necessity to store obtained visitor data in accordance with legal compliances. |
Customer Engagement Solutions Market:
Attributes |
Customer Engagement Solutions Market |
CAGR (2022-2032) |
10.8% |
Market Value (2026) |
US$ 32.2 Billion |
Growth Factor |
Client engagement solutions assist businesses in increasing customer retention and loyalty. |
Opportunity |
Increased AI investments are generating lucrative growth prospects for customer engagement solution developers. |
Key Trends |
Solutions and services for customer engagement One of the key factors fueling the growth of the Customer Engagement Solutions market is the ability to reduce churn rate. |
The visitor identification software market in the United States is estimated to reach US$ 2235.76 Mn in revenue by 2027, owing to a growing desire among businesses to increase income by giving customized solutions, monitoring online traffic, and the growing number of visitors accessing the website.
The fixed pricing segment of the visitor identification software market is predicted to increase at the fastest pace over the forecast period.
In terms of the industrial vertical, the consumer durables and electronics category held the largest visitor identification software market share and is likely to continue to do so over the projection period.
The visitor identification software gives you access to previously unseen leads' contact information, such as names, emails, and phone numbers. Following the collection of visitor information, businesses approach them with the goal of informing them of new product launches and developments. Enterprises also focus on groups and online surveys in order to use the information gathered from site users.
Businesses send automated emails and reminders to clients based on data obtained from these sources in the hopes of converting them into potential purchasers. These benefits have enabled a rise in the adoption of visitor identification software.
Enterprise-level material movement tracking becomes comparatively straightforward with a well-defined permission process and real-time reporting, which is driving the adoption of visitor identification software.
Which Segment Dominates the Visitors Identification Software Market, by Organization Size?
Based on the organization size, the visitor identification software market is divided into large enterprises and small and medium enterprises.
The large enterprise organization size in the visitor identification software market is expected to lead the market. The large organization segment is projected to rise at a high CAGR of 13.5% during the forecast period. The growth rate of this segment in the pre-covid period was even higher at 17.2% through 2032.
While the large enterprises are leading the growth in the demand for visitor identification software market, the small and medium enterprises are helping in the development of new visitor identification software markets on a regional level.
Get the data you need at a Fraction of the cost
Personalize your report by choosing insights you need
and save 40%!
Which Segment is Likely to Lead the Visitor Identification Software Market, by Pricing Model?
As per the pricing model, the visitor identification software market is segmented into fixed pricing and variable pricing models.
The fixed pricing model is leading the sales of visitor identification software with a growth rate of 13.5% through the forecast period of 2022 to 2032. The segment was growing at an even higher pace in the past, with a tremendous growth rate of 17.2%.
This trend is likely to continue in future periods, with the fixed pricing model leading the growth in the visitor identification software market.
What is the Regional Analysis for the Visitor Identification Software Market?
Regions |
CAGR (2022-2032) |
US Market |
13.8% |
UK Market |
12.9% |
China Market |
13.4% |
Japan Market |
12.4% |
South Korea Market |
11.5% |
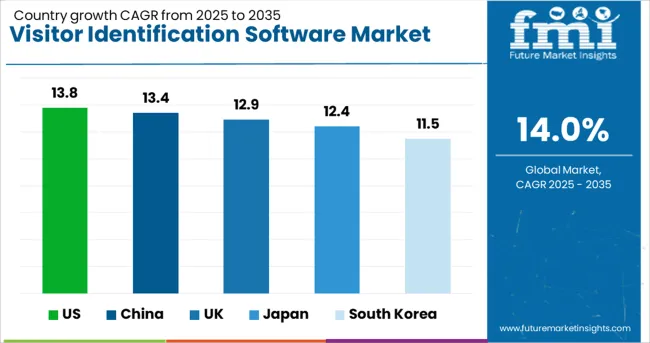
Demand for visitor identification software is expected to rise in the North American region during the forecast period. In the region, the US is expected to be the dominant country leading the adoption of visitor identification software. The US visitor identification software market is expected to grow with a CAGR of 13.8% during the forecast period 2022-2032.
The key drivers of the visitor identification software market growth are the continuous adoption of new technology, privacy, and automation trends in the industry. This has also led to the development of a positive visitor identification software market outlook for the future.
The China market is anticipated to hold the second position in the visitor identification market share due to an increase in demand for visitor identification software. This regional visitor identification software market is anticipated to rise with a CAGR of 13.4% during the forecast period 2022-2032.
Additionally, UK and Japan visitor identification software markets are anticipated to grow rapidly during the forecast period as the visitor identification software market trends indicate a rise in the generation of leads on websites through visitors. The UK visitor identification software market is projected to grow at a CAGR of 12.9% through the forecast period.
How is the Competition in the Visitor Identification Software Market?
There are several key competitors in the visitor identification software market who are focusing on the growth by expanding their opportunities in the industry.
Therefore, the key players are using various types of technology, process and strategy in the growth of their visitor identification software market share. Some of the key strategies are collaboration, merges, partners, for expanding the visitor identification market share during the forecast period.
Moreover, the Companies are considering to implement a portfolio-synergistic strategy to enable a more comprehensive and inclusive growth of their visitor identification software market share.
Recent Development in the Visitor Identification Software Market are:
- The Pitney Bowes announced a Cross-Boarder services in July 2021 which are supposed to help the e-commerce merchants in the marketplace to grow their business digitally and reach the relevant consumers efficiently.
- Honeywell announced its brand product i.e. Honeywell Sine Solution in June 2021 which empowers the business.
- Envoy announced a hybrid technology in June 2021 to adopt a hybrid work within social distancing guidelines and it also drives data insight to optimize their space.
The key players in the visitor identification software market are Proxyclick, Jolly Technology, HID Global, Visitly, Envoy, Honeywell, SmartSpace Software, MRI Software, Vizmo, VersionX, InVentry, Carson Living, Heptagon Technologies, Genetec, piLOBI, AlertEnterprise, Parabit Systems, Traction Guest, Wellcome.me and Others.
Key segments
By Organization:
- Small and Medium Enterprises
- Large Enterprises
By Pricing Model:
- Fixed Pricing
- Variable Pricing
By Industry Vertical:
- BFSI
- IT & Telecom
- Consumer Durables & Electronics
- Travel & Hospitality
- Automotive
- Others
By Region:
- North America
- Europe
- Asia Pacific
- Middle East & Africa
- Latin America
Frequently Asked Questions
What is the CAGR of the Visitor Identification Software Market?
The visitor identification software market is projected to register a CAGR of 14% during the forecast period (2022 - 2032).
Which is the Leading Region in the Visitor Identification Software Market?
During the projected period, the US is expected to lead the visitor identification software market with a CAGR of 13.8% through 2032.
Which Segment Leads in the Visitor Identification Software Market by Offering?
Organization segment is expected to dominate the visitor identification software market over the forecast period based on offering.
What is the Growth Estimated for the Visitor Identification Software Market by 2032?
The visitor identification software market is expected to be valued at US$ 13.0 Billion by 2032.
Which was the Historical Size of the Visitor Identification Software Market?
The visitor identification software market size accounted for around US$ 3 Billion in 2021.
Table of Content
1. Executive Summary 1.1. Global Market Outlook 1.2. Demand-side Trends 1.3. Supply-side Trends 1.4. Technology Roadmap Analysis 1.5. Analysis and Recommendations 2. Market Overview 2.1. Market Coverage / Taxonomy 2.2. Market Definition / Scope / Limitations 3. Market Background 3.1. Market Dynamics 3.1.1. Drivers 3.1.2. Restraints 3.1.3. Opportunity 3.1.4. Trends 3.2. Scenario Forecast 3.2.1. Demand in Optimistic Scenario 3.2.2. Demand in Likely Scenario 3.2.3. Demand in Conservative Scenario 3.3. Opportunity Map Analysis 3.4. Product Life Cycle Analysis 3.5. Investment Feasibility Matrix 3.6. PESTLE and Porter’s Analysis 3.7. Regulatory Landscape 3.7.1. By Key Regions 3.7.2. By Key Countries 3.8. Regional Parent Market Outlook 4. Global Visitor Identification Software Market Analysis 2017-2021 and Forecast, 2022-2032 4.1. Historical Market Size Value (US$ Mn) Analysis, 2017-2021 4.2. Current and Future Market Size Value (US$ Mn) Projections, 2022-2032 4.2.1. Y-o-Y Growth Trend Analysis 4.2.2. Absolute $ Opportunity Analysis 5. Global Visitor Identification Software Market Analysis 2017-2021 and Forecast 2022-2032, By Organization Size 5.1. Introduction / Key Findings 5.2. Historical Market Size Value (US$ Mn) Analysis By Organization Size, 2017-2021 5.3. Current and Future Market Size Value (US$ Mn) Analysis and Forecast By Organization Size, 2022-2032 5.3.1. Small and Medium Enterprise 5.3.2. Large Enterprise 5.4. Y-o-Y Growth Trend Analysis By Organization Size, 2017-2021 5.5. Absolute $ Opportunity Analysis By Organization Size, 2022-2032 6. Global Visitor Identification Software Market Analysis 2017-2021 and Forecast 2022-2032, By Pricing Model 6.1. Introduction / Key Findings 6.2. Historical Market Size Value (US$ Mn) Analysis By Pricing Model, 2017-2021 6.3. Current and Future Market Size Value (US$ Mn) Analysis and Forecast By Pricing Model, 2022-2032 6.3.1. Fixed Pricing 6.3.2. Variable Pricing 6.4. Y-o-Y Growth Trend Analysis By Pricing Model, 2017-2021 6.5. Absolute $ Opportunity Analysis By Pricing Model, 2022-2032 7. Global Visitor Identification Software Market Analysis 2017-2021 and Forecast 2022-2032, By Industry Verticals 7.1. Introduction / Key Findings 7.2. Historical Market Size Value (US$ Mn) Analysis By Industry Verticals, 2017-2021 7.3. Current and Future Market Size Value (US$ Mn) Analysis and Forecast By Industry Verticals, 2022-2032 7.3.1. BFSI 7.3.2. IT and Telecom 7.3.3. Consumer Durables and Electronics 7.3.4. Travel and Hospitality 7.3.5. Automotive 7.3.6. Others 7.4. Y-o-Y Growth Trend Analysis By Industry Verticals, 2017-2021 7.5. Absolute $ Opportunity Analysis By Industry Verticals, 2022-2032 8. Global Visitor Identification Software Market Analysis 2017-2021 and Forecast 2022-2032, By Region 8.1. Introduction 8.2. Historical Market Size Value (US$ Mn) Analysis By Region, 2017-2021 8.3. Current Market Size Value (US$ Mn) Analysis and Forecast By Region, 2022-2032 8.3.1. North America 8.3.2. Latin America 8.3.3. Europe 8.3.4. Asia Pacific 8.3.5. Middle East and Africa 8.4. Market Attractiveness Analysis By Region 9. North America Visitor Identification Software Market Analysis 2017-2021 and Forecast 2022-2032, By Country 9.1. Historical Market Size Value (US$ Mn) Trend Analysis By Market Taxonomy, 2017-2021 9.2. Market Size Value (US$ Mn) Forecast By Market Taxonomy, 2022-2032 9.2.1. By Country 9.2.1.1. U.S. 9.2.1.2. Canada 9.2.2. By Organization Size 9.2.3. By Pricing Model 9.2.4. By Industry Verticals 9.3. Market Attractiveness Analysis 9.3.1. By Country 9.3.2. By Organization Size 9.3.3. By Pricing Model 9.3.4. By Industry Verticals 9.4. Key Takeaways 10. Latin America Visitor Identification Software Market Analysis 2017-2021 and Forecast 2022-2032, By Country 10.1. Historical Market Size Value (US$ Mn) Trend Analysis By Market Taxonomy, 2017-2021 10.2. Market Size Value (US$ Mn) Forecast By Market Taxonomy, 2022-2032 10.2.1. By Country 10.2.1.1. Brazil 10.2.1.2. Mexico 10.2.1.3. Rest of Latin America 10.2.2. By Organization Size 10.2.3. By Pricing Model 10.2.4. By Industry Verticals 10.3. Market Attractiveness Analysis 10.3.1. By Country 10.3.2. By Organization Size 10.3.3. By Pricing Model 10.3.4. By Industry Verticals 10.4. Key Takeaways 11. Europe Visitor Identification Software Market Analysis 2017-2021 and Forecast 2022-2032, By Country 11.1. Historical Market Size Value (US$ Mn) Trend Analysis By Market Taxonomy, 2017-2021 11.2. Market Size Value (US$ Mn) Forecast By Market Taxonomy, 2022-2032 11.2.1. By Country 11.2.1.1. Germany 11.2.1.2. Italy 11.2.1.3. France 11.2.1.4. U.K. 11.2.1.5. Russia 11.2.1.6. BENELUX 11.2.1.7. Rest of Europe 11.2.2. By Organization Size 11.2.3. By Pricing Model 11.2.4. By Industry Verticals 11.3. Market Attractiveness Analysis 11.3.1. By Country 11.3.2. By Organization Size 11.3.3. By Pricing Model 11.3.4. By Industry Verticals 11.4. Key Takeaways 12. Asia Pacific Visitor Identification Software Market Analysis 2017-2021 and Forecast 2022-2032, By Country 12.1. Historical Market Size Value (US$ Mn) Trend Analysis By Market Taxonomy, 2017-2021 12.2. Market Size Value (US$ Mn) Forecast By Market Taxonomy, 2022-2032 12.2.1. By Country 12.2.1.1. China 12.2.1.2. Japan 12.2.1.3. South Korea 12.2.1.4. Rest of Asia Pacific 12.2.2. By Organization Size 12.2.3. By Pricing Model 12.2.4. By Industry Verticals 12.3. Market Attractiveness Analysis 12.3.1. By Country 12.3.2. By Organization Size 12.3.3. By Pricing Model 12.3.4. By Industry Verticals 12.4. Key Takeaways 13. Middle East and Africa Visitor Identification Software Market Analysis 2017-2021 and Forecast 2022-2032, By Country 13.1. Historical Market Size Value (US$ Mn) Trend Analysis By Market Taxonomy, 2017-2021 13.2. Market Size Value (US$ Mn) Forecast By Market Taxonomy, 2022-2032 13.2.1. By Country 13.2.1.1. GCC Countries 13.2.1.2. South Africa 13.2.1.3. Turkey 13.2.1.4. Rest of Middle East and Africa 13.2.2. By Organization Size 13.2.3. By Pricing Model 13.2.4. By Industry Verticals 13.3. Market Attractiveness Analysis 13.3.1. By Country 13.3.2. By Organization Size 13.3.3. By Pricing Model 13.3.4. By Industry Verticals 13.4. Key Takeaways 14. Key Countries Visitor Identification Software Market Analysis 14.1. U.S. 14.1.1. Pricing Analysis 14.1.2. Market Share Analysis, 2021 14.1.2.1. By Organization Size 14.1.2.2. By Pricing Model 14.1.2.3. By Industry Verticals 14.2. Canada 14.2.1. Pricing Analysis 14.2.2. Market Share Analysis, 2021 14.2.2.1. By Organization Size 14.2.2.2. By Pricing Model 14.2.2.3. By Industry Verticals 14.3. Brazil 14.3.1. Pricing Analysis 14.3.2. Market Share Analysis, 2021 14.3.2.1. By Organization Size 14.3.2.2. By Pricing Model 14.3.2.3. By Industry Verticals 14.4. Mexico 14.4.1. Pricing Analysis 14.4.2. Market Share Analysis, 2021 14.4.2.1. By Organization Size 14.4.2.2. By Pricing Model 14.4.2.3. By Industry Verticals 14.5. Germany 14.5.1. Pricing Analysis 14.5.2. Market Share Analysis, 2021 14.5.2.1. By Organization Size 14.5.2.2. By Pricing Model 14.5.2.3. By Industry Verticals 14.6. Italy 14.6.1. Pricing Analysis 14.6.2. Market Share Analysis, 2021 14.6.2.1. By Organization Size 14.6.2.2. By Pricing Model 14.6.2.3. By Industry Verticals 14.7. France 14.7.1. Pricing Analysis 14.7.2. Market Share Analysis, 2021 14.7.2.1. By Organization Size 14.7.2.2. By Pricing Model 14.7.2.3. By Industry Verticals 14.8. U.K. 14.8.1. Pricing Analysis 14.8.2. Market Share Analysis, 2021 14.8.2.1. By Organization Size 14.8.2.2. By Pricing Model 14.8.2.3. By Industry Verticals 14.9. Russia 14.9.1. Pricing Analysis 14.9.2. Market Share Analysis, 2021 14.9.2.1. By Organization Size 14.9.2.2. By Pricing Model 14.9.2.3. By Industry Verticals 14.10. BENELUX 14.10.1. Pricing Analysis 14.10.2. Market Share Analysis, 2021 14.10.2.1. By Organization Size 14.10.2.2. By Pricing Model 14.10.2.3. By Industry Verticals 14.11. China 14.11.1. Pricing Analysis 14.11.2. Market Share Analysis, 2021 14.11.2.1. By Organization Size 14.11.2.2. By Pricing Model 14.11.2.3. By Industry Verticals 14.12. Japan 14.12.1. Pricing Analysis 14.12.2. Market Share Analysis, 2021 14.12.2.1. By Organization Size 14.12.2.2. By Pricing Model 14.12.2.3. By Industry Verticals 14.13. South Korea 14.13.1. Pricing Analysis 14.13.2. Market Share Analysis, 2021 14.13.2.1. By Organization Size 14.13.2.2. By Pricing Model 14.13.2.3. By Industry Verticals 14.14. GCC Countries 14.14.1. Pricing Analysis 14.14.2. Market Share Analysis, 2021 14.14.2.1. By Organization Size 14.14.2.2. By Pricing Model 14.14.2.3. By Industry Verticals 14.15. South Africa 14.15.1. Pricing Analysis 14.15.2. Market Share Analysis, 2021 14.15.2.1. By Organization Size 14.15.2.2. By Pricing Model 14.15.2.3. By Industry Verticals 14.16. Turkey 14.16.1. Pricing Analysis 14.16.2. Market Share Analysis, 2021 14.16.2.1. By Organization Size 14.16.2.2. By Pricing Model 14.16.2.3. By Industry Verticals 15. Market Structure Analysis 15.1. Competition Dashboard 15.2. Competition Benchmarking 15.3. Market Share Analysis of Top Players 15.3.1. By Regional 15.3.2. By Organization Size 15.3.3. By Pricing Model 15.3.4. By Industry Verticals 16. Competition Analysis 16.1. Competition Deep Dive 16.1.1. Act-On Software Inc. 16.1.1.1. Overview 16.1.1.2. Product Portfolio 16.1.1.3. Profitability by Market Segments 16.1.1.4. Sales Footprint 16.1.1.5. Strategy Overview 16.1.1.5.1. Marketing Strategy 16.1.2. Clearbit 16.1.2.1. Overview 16.1.2.2. Product Portfolio 16.1.2.3. Profitability by Market Segments 16.1.2.4. Sales Footprint 16.1.2.5. Strategy Overview 16.1.2.5.1. Marketing Strategy 16.1.3. KickFire 16.1.3.1. Overview 16.1.3.2. Product Portfolio 16.1.3.3. Profitability by Market Segments 16.1.3.4. Sales Footprint 16.1.3.5. Strategy Overview 16.1.3.5.1. Marketing Strategy 16.1.4. Lead Forensics 16.1.4.1. Overview 16.1.4.2. Product Portfolio 16.1.4.3. Profitability by Market Segments 16.1.4.4. Sales Footprint 16.1.4.5. Strategy Overview 16.1.4.5.1. Marketing Strategy 16.1.5. Liidio Oy 16.1.5.1. Overview 16.1.5.2. Product Portfolio 16.1.5.3. Profitability by Market Segments 16.1.5.4. Sales Footprint 16.1.5.5. Strategy Overview 16.1.5.5.1. Marketing Strategy 16.1.6. Netfactor 16.1.6.1. Overview 16.1.6.2. Product Portfolio 16.1.6.3. Profitability by Market Segments 16.1.6.4. Sales Footprint 16.1.6.5. Strategy Overview 16.1.6.5.1. Marketing Strategy 16.1.7. Sharpspring 16.1.7.1. Overview 16.1.7.2. Product Portfolio 16.1.7.3. Profitability by Market Segments 16.1.7.4. Sales Footprint 16.1.7.5. Strategy Overview 16.1.7.5.1. Marketing Strategy 16.1.8. Upland Software Inc. 16.1.8.1. Overview 16.1.8.2. Product Portfolio 16.1.8.3. Profitability by Market Segments 16.1.8.4. Sales Footprint 16.1.8.5. Strategy Overview 16.1.8.5.1. Marketing Strategy 16.1.9. Zoho Corporation Pvt Ltd 16.1.9.1. Overview 16.1.9.2. Product Portfolio 16.1.9.3. Profitability by Market Segments 16.1.9.4. Sales Footprint 16.1.9.5. Strategy Overview 16.1.9.5.1. Marketing Strategy 17. Assumptions & Acronyms Used 18. Research Methodology
Don't pay for what you don't need
Customize your report by selecting specific countries or regions and save 30%!
List of Tables
Table 1: Global Visitor Identification Software Market Value (US$ Mn) Forecast by Region, 2017-2032 Table 2: Global Visitor Identification Software Market Value (US$ Mn) Forecast by Organization Size, 2017-2032 Table 3: Global Visitor Identification Software Market Value (US$ Mn) Forecast by Pricing Model, 2017-2032 Table 4: Global Visitor Identification Software Market Value (US$ Mn) Forecast by Industry Verticals, 2017-2032 Table 5: North America Visitor Identification Software Market Value (US$ Mn) Forecast by Country, 2017-2032 Table 6: North America Visitor Identification Software Market Value (US$ Mn) Forecast by Organization Size, 2017-2032 Table 7: North America Visitor Identification Software Market Value (US$ Mn) Forecast by Pricing Model, 2017-2032 Table 8: North America Visitor Identification Software Market Value (US$ Mn) Forecast by Industry Verticals, 2017-2032 Table 9: Latin America Visitor Identification Software Market Value (US$ Mn) Forecast by Country, 2017-2032 Table 10: Latin America Visitor Identification Software Market Value (US$ Mn) Forecast by Organization Size, 2017-2032 Table 11: Latin America Visitor Identification Software Market Value (US$ Mn) Forecast by Pricing Model, 2017-2032 Table 12: Latin America Visitor Identification Software Market Value (US$ Mn) Forecast by Industry Verticals, 2017-2032 Table 13: Europe Visitor Identification Software Market Value (US$ Mn) Forecast by Country, 2017-2032 Table 14: Europe Visitor Identification Software Market Value (US$ Mn) Forecast by Organization Size, 2017-2032 Table 15: Europe Visitor Identification Software Market Value (US$ Mn) Forecast by Pricing Model, 2017-2032 Table 16: Europe Visitor Identification Software Market Value (US$ Mn) Forecast by Industry Verticals, 2017-2032 Table 17: Asia Pacific Visitor Identification Software Market Value (US$ Mn) Forecast by Country, 2017-2032 Table 18: Asia Pacific Visitor Identification Software Market Value (US$ Mn) Forecast by Organization Size, 2017-2032 Table 19: Asia Pacific Visitor Identification Software Market Value (US$ Mn) Forecast by Pricing Model, 2017-2032 Table 20: Asia Pacific Visitor Identification Software Market Value (US$ Mn) Forecast by Industry Verticals, 2017-2032 Table 21: Middle East and Africa Visitor Identification Software Market Value (US$ Mn) Forecast by Country, 2017-2032 Table 22: Middle East and Africa Visitor Identification Software Market Value (US$ Mn) Forecast by Organization Size, 2017-2032 Table 23: Middle East and Africa Visitor Identification Software Market Value (US$ Mn) Forecast by Pricing Model, 2017-2032 Table 24: Middle East and Africa Visitor Identification Software Market Value (US$ Mn) Forecast by Industry Verticals, 2017-2032
Find your sweet spots for generating winning opportunities in this market.
Talk to AnalystList of Charts
Figure 1: Global Visitor Identification Software Market Value (US$ Mn) by Organization Size, 2022-2032 Figure 2: Global Visitor Identification Software Market Value (US$ Mn) by Pricing Model, 2022-2032 Figure 3: Global Visitor Identification Software Market Value (US$ Mn) by Industry Verticals, 2022-2032 Figure 4: Global Visitor Identification Software Market Value (US$ Mn) by Region, 2022-2032 Figure 5: Global Visitor Identification Software Market Value (US$ Mn) Analysis by Region, 2017-2032 Figure 6: Global Visitor Identification Software Market Value Share (%) and BPS Analysis by Region, 2022-2032 Figure 7: Global Visitor Identification Software Market Y-o-Y Growth (%) Projections by Region, 2022-2032 Figure 8: Global Visitor Identification Software Market Value (US$ Mn) Analysis by Organization Size, 2017-2032 Figure 9: Global Visitor Identification Software Market Value Share (%) and BPS Analysis by Organization Size, 2022-2032 Figure 10: Global Visitor Identification Software Market Y-o-Y Growth (%) Projections by Organization Size, 2022-2032 Figure 11: Global Visitor Identification Software Market Value (US$ Mn) Analysis by Pricing Model, 2017-2032 Figure 12: Global Visitor Identification Software Market Value Share (%) and BPS Analysis by Pricing Model, 2022-2032 Figure 13: Global Visitor Identification Software Market Y-o-Y Growth (%) Projections by Pricing Model, 2022-2032 Figure 14: Global Visitor Identification Software Market Value (US$ Mn) Analysis by Industry Verticals, 2017-2032 Figure 15: Global Visitor Identification Software Market Value Share (%) and BPS Analysis by Industry Verticals, 2022-2032 Figure 16: Global Visitor Identification Software Market Y-o-Y Growth (%) Projections by Industry Verticals, 2022-2032 Figure 17: Global Visitor Identification Software Market Attractiveness by Organization Size, 2022-2032 Figure 18: Global Visitor Identification Software Market Attractiveness by Pricing Model, 2022-2032 Figure 19: Global Visitor Identification Software Market Attractiveness by Industry Verticals, 2022-2032 Figure 20: Global Visitor Identification Software Market Attractiveness by Region, 2022-2032 Figure 21: North America Visitor Identification Software Market Value (US$ Mn) by Organization Size, 2022-2032 Figure 22: North America Visitor Identification Software Market Value (US$ Mn) by Pricing Model, 2022-2032 Figure 23: North America Visitor Identification Software Market Value (US$ Mn) by Industry Verticals, 2022-2032 Figure 24: North America Visitor Identification Software Market Value (US$ Mn) by Country, 2022-2032 Figure 25: North America Visitor Identification Software Market Value (US$ Mn) Analysis by Country, 2017-2032 Figure 26: North America Visitor Identification Software Market Value Share (%) and BPS Analysis by Country, 2022-2032 Figure 27: North America Visitor Identification Software Market Y-o-Y Growth (%) Projections by Country, 2022-2032 Figure 28: North America Visitor Identification Software Market Value (US$ Mn) Analysis by Organization Size, 2017-2032 Figure 29: North America Visitor Identification Software Market Value Share (%) and BPS Analysis by Organization Size, 2022-2032 Figure 30: North America Visitor Identification Software Market Y-o-Y Growth (%) Projections by Organization Size, 2022-2032 Figure 31: North America Visitor Identification Software Market Value (US$ Mn) Analysis by Pricing Model, 2017-2032 Figure 32: North America Visitor Identification Software Market Value Share (%) and BPS Analysis by Pricing Model, 2022-2032 Figure 33: North America Visitor Identification Software Market Y-o-Y Growth (%) Projections by Pricing Model, 2022-2032 Figure 34: North America Visitor Identification Software Market Value (US$ Mn) Analysis by Industry Verticals, 2017-2032 Figure 35: North America Visitor Identification Software Market Value Share (%) and BPS Analysis by Industry Verticals, 2022-2032 Figure 36: North America Visitor Identification Software Market Y-o-Y Growth (%) Projections by Industry Verticals, 2022-2032 Figure 37: North America Visitor Identification Software Market Attractiveness by Organization Size, 2022-2032 Figure 38: North America Visitor Identification Software Market Attractiveness by Pricing Model, 2022-2032 Figure 39: North America Visitor Identification Software Market Attractiveness by Industry Verticals, 2022-2032 Figure 40: North America Visitor Identification Software Market Attractiveness by Country, 2022-2032 Figure 41: Latin America Visitor Identification Software Market Value (US$ Mn) by Organization Size, 2022-2032 Figure 42: Latin America Visitor Identification Software Market Value (US$ Mn) by Pricing Model, 2022-2032 Figure 43: Latin America Visitor Identification Software Market Value (US$ Mn) by Industry Verticals, 2022-2032 Figure 44: Latin America Visitor Identification Software Market Value (US$ Mn) by Country, 2022-2032 Figure 45: Latin America Visitor Identification Software Market Value (US$ Mn) Analysis by Country, 2017-2032 Figure 46: Latin America Visitor Identification Software Market Value Share (%) and BPS Analysis by Country, 2022-2032 Figure 47: Latin America Visitor Identification Software Market Y-o-Y Growth (%) Projections by Country, 2022-2032 Figure 48: Latin America Visitor Identification Software Market Value (US$ Mn) Analysis by Organization Size, 2017-2032 Figure 49: Latin America Visitor Identification Software Market Value Share (%) and BPS Analysis by Organization Size, 2022-2032 Figure 50: Latin America Visitor Identification Software Market Y-o-Y Growth (%) Projections by Organization Size, 2022-2032 Figure 51: Latin America Visitor Identification Software Market Value (US$ Mn) Analysis by Pricing Model, 2017-2032 Figure 52: Latin America Visitor Identification Software Market Value Share (%) and BPS Analysis by Pricing Model, 2022-2032 Figure 53: Latin America Visitor Identification Software Market Y-o-Y Growth (%) Projections by Pricing Model, 2022-2032 Figure 54: Latin America Visitor Identification Software Market Value (US$ Mn) Analysis by Industry Verticals, 2017-2032 Figure 55: Latin America Visitor Identification Software Market Value Share (%) and BPS Analysis by Industry Verticals, 2022-2032 Figure 56: Latin America Visitor Identification Software Market Y-o-Y Growth (%) Projections by Industry Verticals, 2022-2032 Figure 57: Latin America Visitor Identification Software Market Attractiveness by Organization Size, 2022-2032 Figure 58: Latin America Visitor Identification Software Market Attractiveness by Pricing Model, 2022-2032 Figure 59: Latin America Visitor Identification Software Market Attractiveness by Industry Verticals, 2022-2032 Figure 60: Latin America Visitor Identification Software Market Attractiveness by Country, 2022-2032 Figure 61: Europe Visitor Identification Software Market Value (US$ Mn) by Organization Size, 2022-2032 Figure 62: Europe Visitor Identification Software Market Value (US$ Mn) by Pricing Model, 2022-2032 Figure 63: Europe Visitor Identification Software Market Value (US$ Mn) by Industry Verticals, 2022-2032 Figure 64: Europe Visitor Identification Software Market Value (US$ Mn) by Country, 2022-2032 Figure 65: Europe Visitor Identification Software Market Value (US$ Mn) Analysis by Country, 2017-2032 Figure 66: Europe Visitor Identification Software Market Value Share (%) and BPS Analysis by Country, 2022-2032 Figure 67: Europe Visitor Identification Software Market Y-o-Y Growth (%) Projections by Country, 2022-2032 Figure 68: Europe Visitor Identification Software Market Value (US$ Mn) Analysis by Organization Size, 2017-2032 Figure 69: Europe Visitor Identification Software Market Value Share (%) and BPS Analysis by Organization Size, 2022-2032 Figure 70: Europe Visitor Identification Software Market Y-o-Y Growth (%) Projections by Organization Size, 2022-2032 Figure 71: Europe Visitor Identification Software Market Value (US$ Mn) Analysis by Pricing Model, 2017-2032 Figure 72: Europe Visitor Identification Software Market Value Share (%) and BPS Analysis by Pricing Model, 2022-2032 Figure 73: Europe Visitor Identification Software Market Y-o-Y Growth (%) Projections by Pricing Model, 2022-2032 Figure 74: Europe Visitor Identification Software Market Value (US$ Mn) Analysis by Industry Verticals, 2017-2032 Figure 75: Europe Visitor Identification Software Market Value Share (%) and BPS Analysis by Industry Verticals, 2022-2032 Figure 76: Europe Visitor Identification Software Market Y-o-Y Growth (%) Projections by Industry Verticals, 2022-2032 Figure 77: Europe Visitor Identification Software Market Attractiveness by Organization Size, 2022-2032 Figure 78: Europe Visitor Identification Software Market Attractiveness by Pricing Model, 2022-2032 Figure 79: Europe Visitor Identification Software Market Attractiveness by Industry Verticals, 2022-2032 Figure 80: Europe Visitor Identification Software Market Attractiveness by Country, 2022-2032 Figure 81: Asia Pacific Visitor Identification Software Market Value (US$ Mn) by Organization Size, 2022-2032 Figure 82: Asia Pacific Visitor Identification Software Market Value (US$ Mn) by Pricing Model, 2022-2032 Figure 83: Asia Pacific Visitor Identification Software Market Value (US$ Mn) by Industry Verticals, 2022-2032 Figure 84: Asia Pacific Visitor Identification Software Market Value (US$ Mn) by Country, 2022-2032 Figure 85: Asia Pacific Visitor Identification Software Market Value (US$ Mn) Analysis by Country, 2017-2032 Figure 86: Asia Pacific Visitor Identification Software Market Value Share (%) and BPS Analysis by Country, 2022-2032 Figure 87: Asia Pacific Visitor Identification Software Market Y-o-Y Growth (%) Projections by Country, 2022-2032 Figure 88: Asia Pacific Visitor Identification Software Market Value (US$ Mn) Analysis by Organization Size, 2017-2032 Figure 89: Asia Pacific Visitor Identification Software Market Value Share (%) and BPS Analysis by Organization Size, 2022-2032 Figure 90: Asia Pacific Visitor Identification Software Market Y-o-Y Growth (%) Projections by Organization Size, 2022-2032 Figure 91: Asia Pacific Visitor Identification Software Market Value (US$ Mn) Analysis by Pricing Model, 2017-2032 Figure 92: Asia Pacific Visitor Identification Software Market Value Share (%) and BPS Analysis by Pricing Model, 2022-2032 Figure 93: Asia Pacific Visitor Identification Software Market Y-o-Y Growth (%) Projections by Pricing Model, 2022-2032 Figure 94: Asia Pacific Visitor Identification Software Market Value (US$ Mn) Analysis by Industry Verticals, 2017-2032 Figure 95: Asia Pacific Visitor Identification Software Market Value Share (%) and BPS Analysis by Industry Verticals, 2022-2032 Figure 96: Asia Pacific Visitor Identification Software Market Y-o-Y Growth (%) Projections by Industry Verticals, 2022-2032 Figure 97: Asia Pacific Visitor Identification Software Market Attractiveness by Organization Size, 2022-2032 Figure 98: Asia Pacific Visitor Identification Software Market Attractiveness by Pricing Model, 2022-2032 Figure 99: Asia Pacific Visitor Identification Software Market Attractiveness by Industry Verticals, 2022-2032 Figure 100: Asia Pacific Visitor Identification Software Market Attractiveness by Country, 2022-2032 Figure 101: Middle East and Africa Visitor Identification Software Market Value (US$ Mn) by Organization Size, 2022-2032 Figure 102: Middle East and Africa Visitor Identification Software Market Value (US$ Mn) by Pricing Model, 2022-2032 Figure 103: Middle East and Africa Visitor Identification Software Market Value (US$ Mn) by Industry Verticals, 2022-2032 Figure 104: Middle East and Africa Visitor Identification Software Market Value (US$ Mn) by Country, 2022-2032 Figure 105: Middle East and Africa Visitor Identification Software Market Value (US$ Mn) Analysis by Country, 2017-2032 Figure 106: Middle East and Africa Visitor Identification Software Market Value Share (%) and BPS Analysis by Country, 2022-2032 Figure 107: Middle East and Africa Visitor Identification Software Market Y-o-Y Growth (%) Projections by Country, 2022-2032 Figure 108: Middle East and Africa Visitor Identification Software Market Value (US$ Mn) Analysis by Organization Size, 2017-2032 Figure 109: Middle East and Africa Visitor Identification Software Market Value Share (%) and BPS Analysis by Organization Size, 2022-2032 Figure 110: Middle East and Africa Visitor Identification Software Market Y-o-Y Growth (%) Projections by Organization Size, 2022-2032 Figure 111: Middle East and Africa Visitor Identification Software Market Value (US$ Mn) Analysis by Pricing Model, 2017-2032 Figure 112: Middle East and Africa Visitor Identification Software Market Value Share (%) and BPS Analysis by Pricing Model, 2022-2032 Figure 113: Middle East and Africa Visitor Identification Software Market Y-o-Y Growth (%) Projections by Pricing Model, 2022-2032 Figure 114: Middle East and Africa Visitor Identification Software Market Value (US$ Mn) Analysis by Industry Verticals, 2017-2032 Figure 115: Middle East and Africa Visitor Identification Software Market Value Share (%) and BPS Analysis by Industry Verticals, 2022-2032 Figure 116: Middle East and Africa Visitor Identification Software Market Y-o-Y Growth (%) Projections by Industry Verticals, 2022-2032 Figure 117: Middle East and Africa Visitor Identification Software Market Attractiveness by Organization Size, 2022-2032 Figure 118: Middle East and Africa Visitor Identification Software Market Attractiveness by Pricing Model, 2022-2032 Figure 119: Middle East and Africa Visitor Identification Software Market Attractiveness by Industry Verticals, 2022-2032 Figure 120: Middle East and Africa Visitor Identification Software Market Attractiveness by Country, 2022-2032
Recommendations
Explore Technology Insights
View Reports