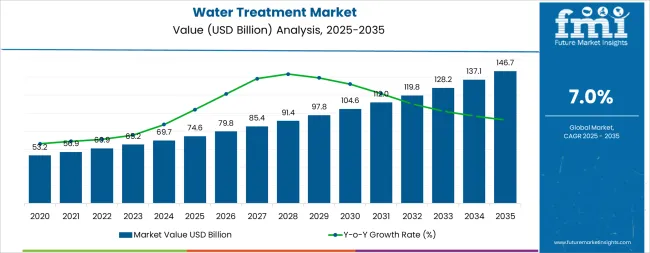
The global water treatment market is projected to reach USD 146.7 billion by 2035, recording an absolute increase of USD 72.2 billion over the forecast period. The market is valued at USD 74.6 billion in 2025 and is set to rise at a CAGR of 7% during the assessment period. The overall market size is expected to grow by 2 times during the same period, supported by increasing demand for clean water solutions worldwide, driving demand for advanced treatment technologies and increasing investments in water infrastructure and environmental compliance projects globally. However, high capital investment requirements and complex regulatory frameworks may pose challenges to market expansion.
| Metric | Value |
|---|---|
| Market Value (2025) | USD 74.6 billion |
| Market Forecast Value (2035) | USD 146.7 billion |
| Forecast CAGR (2025-2035) | 7% |
Between 2025 and 2030, the water treatment market is projected to expand from USD 74.6 billion to USD 104.6 billion, resulting in a value increase of USD 30 billion, which represents 41.5% of the total forecast growth for the decade. This phase of development will be shaped by rising demand for municipal water infrastructure and industrial water recycling applications, product innovation in membrane technologies and smart monitoring systems, as well as expanding integration with environmental regulations and zero liquid discharge initiatives. Companies are establishing competitive positions through investment in advanced filtration technologies, integrated water management solutions, and strategic market expansion across municipal, industrial, and commercial applications.
From 2030 to 2035, the market is forecast to grow from USD 104.6 billion to USD 146.7 billion, adding another USD 42.2 billion, which constitutes 58.5% of the overall ten-year expansion. This period is expected to be characterized by the expansion of specialized treatment systems, including advanced membrane formulations and integrated monitoring solutions tailored for specific industrial requirements, strategic collaborations between technology providers and water utilities, and an enhanced focus on water security and resource optimization. The growing emphasis on circular economy principles and water reuse will drive demand for advanced, high-performance water treatment solutions across diverse municipal and industrial applications.
The water treatment market grows by enabling municipalities and industries to achieve superior water quality and environmental compliance across multiple applications, ranging from small-scale residential systems to large-scale industrial complexes. Water utilities and industrial operators face mounting pressure to improve water security and environmental performance, with water treatment solutions typically providing 95-99% contaminant removal efficiency compared to basic filtration systems, making advanced treatment technology essential for regulatory compliance and operational excellence. The municipal and industrial sector's need for maximum water quality assurance creates demand for advanced treatment solutions that can minimize contamination risks, enhance operational reliability, and ensure consistent performance across diverse water sources and quality challenges. Government initiatives promoting water security and environmental protection drive adoption in municipal, industrial, and commercial applications, where water quality performance has a direct impact on public health and operational efficiency. However, high upfront capital costs and the complexity of achieving optimal performance across different water sources may limit adoption rates among cost-sensitive utilities and regions with limited technical infrastructure.
The market is segmented by system type, application, end use, and region. By system type, the market is divided into preliminary treatment, water treatment, membrane bio-reactor (MBR), reverse osmosis (RO), micro-filtration (MF), nano/ultra filtration (NF/UF), disinfectants (UV, ozone), sludge treatment, activated sludge, sludge thickening & dewatering, sludge drying, and other technologies. Based on application, the market is categorized into process water/water treatment, wastewater treatment, zero liquid discharge, and desalination. By end use, the market is classified into residential buildings, commercial buildings, municipality, industrial, chemical & petrochemicals, oil & gas, mining & metals, food & beverage, pharmaceuticals, thermoelectric power plants, semiconductors, and others. Regionally, the market is divided into North America, Latin America, Western Europe, Eastern Europe, East Asia, South Asia Pacific, and Middle East & Africa.
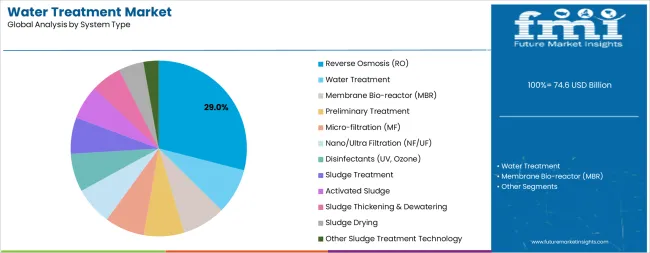
The reverse osmosis (RO) segment represents the dominant force in the water treatment market, capturing approximately 29% of total market share in 2025. This advanced system category encompasses formulations featuring superior contaminant removal capabilities, including dissolved salts elimination and comprehensive filtration characteristics that enable exceptional water purification and enhanced quality assurance. The reverse osmosis segment's market leadership stems from its exceptional performance capabilities in diverse water treatment applications, with systems capable of removing 99% of dissolved contaminants while maintaining consistent performance and operational efficiency across challenging water quality conditions.
The membrane bio-reactor (MBR) segment maintains substantial market presence, serving facilities that require advanced biological treatment combined with membrane filtration for high-quality effluent production. These systems offer reliable performance for complex wastewater treatment while providing sufficient capacity to meet advanced environmental standards in municipal and industrial applications.
Key technological advantages driving the reverse osmosis segment include:
Wastewater treatment applications demonstrate strong performance in the water treatment market, driven by increasing environmental regulations and municipal infrastructure requirements. The wastewater treatment segment's established position reflects the critical importance of effluent quality compliance, environmental protection, and resource recovery across municipal and industrial facilities, meeting regulatory requirements in developed and emerging markets.
Process water/water treatment applications show significant momentum through industrial demand for high-quality process water and drinking water production systems. This segment benefits from continuous advancement in treatment technology that provides enhanced water quality and operational reliability for diverse industrial applications.
The zero liquid discharge segment maintains growing presence through industrial water recycling requirements, while desalination applications provide water security solutions for water-scarce regions. These segments represent emerging opportunities through advanced treatment protocols and resource optimization initiatives.
Key factors supporting application advancement include:
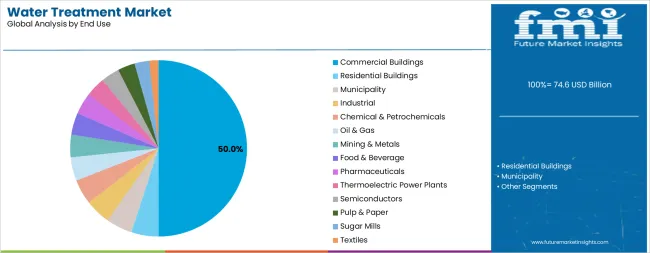
Commercial buildings dominate the water treatment market with approximately 50% market share in 2025, reflecting the critical role of building water systems and facility management in driving treatment demand and supporting occupant health and safety initiatives. The commercial buildings segment's market leadership is reinforced by increasing water quality standards, building certification requirements, and rising demand for integrated water management systems that directly correlate with operational efficiency and tenant satisfaction.
The municipality segment represents substantial market share, capturing significant demand through public water supply treatment, wastewater management, and infrastructure modernization requirements. This segment benefits from growing population density and urbanization that creates enhanced water treatment capacity and environmental compliance requirements in municipal applications.
The industrial segment accounts for substantial market share, serving manufacturing facilities requiring specialized treatment solutions. The chemical & petrochemicals segment captures market share through process water applications, while others including pharmaceuticals, food & beverage, and semiconductors represent specialized industrial market segments.
Key market dynamics supporting end-use growth include:
The market is driven by three concrete demand factors tied to water security and environmental compliance outcomes. First, global water scarcity and population growth create increasing demand for high-performance water treatment solutions, with water stress affecting over 2 billion people globally, requiring advanced technology solutions for maximum water resource utilization. Second, modernization of aging water infrastructure and environmental regulations drive the adoption of intelligent treatment technologies, with municipalities and industries seeking 95-99% improvement in contaminant removal and regulatory compliance enhancement. Third, technological advancements in membrane technology and smart monitoring systems enable more effective and efficient water treatment solutions that reduce operational complexity while improving long-term performance and resource optimization.
Market restraints include high capital investment requirements that can impact project feasibility and utility budgets, particularly during periods of economic constraints or infrastructure funding limitations affecting treatment system adoption. System complexity and maintenance requirements pose another significant challenge, as achieving optimal performance across different water sources and treatment applications demands specialized expertise and comprehensive operational systems, potentially causing implementation delays and increased lifecycle costs. Technical skills shortage in water treatment operation and maintenance creates additional challenges for utilities, demanding ongoing investment in training capabilities and compliance with varying regional environmental standards.
Key trends indicate accelerated adoption in emerging markets, particularly India, China, and Brazil, where rapid urbanization and industrialization drive comprehensive water treatment infrastructure development. Technology advancement trends toward AI integration with enhanced predictive maintenance, real-time monitoring capabilities, and integrated resource recovery systems enable next-generation product development that addresses multiple treatment requirements simultaneously. However, the market could face disruption if alternative water purification technologies or significant changes in water resource management practices minimize reliance on traditional treatment system solutions.
| Country | CAGR (2025-2035) |
|---|---|
| India | 11.6% |
| China | 7.5% |
| UK | 7.0% |
| USA | 6.8% |
| Germany | 6.1% |
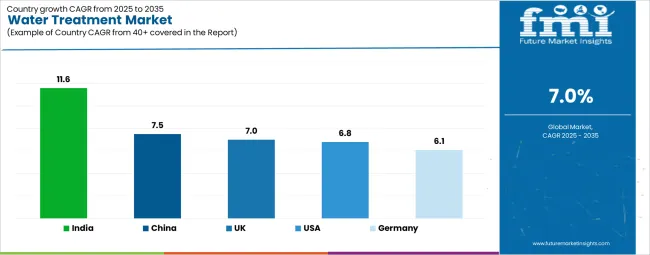
The water treatment market is gaining momentum worldwide, with India taking the lead thanks to massive infrastructure investment and critical water scarcity challenges. Close behind, China benefits from government policy initiatives and comprehensive industrial water treatment requirements, positioning itself as a strategic growth hub in the Asian region. The UK shows steady advancement, where infrastructure modernization strengthens its role in the European water technology development. The USA is focusing on aging infrastructure replacement and environmental compliance, signaling an ambition to capitalize on growing opportunities in advanced water treatment technology markets. Meanwhile, Germany stands out for its industrial demand and advanced technology adoption, recording consistent progress in water management optimization. Together, India and China anchor the global expansion story, while the rest build stability and diversity into the market's growth path.
The report covers an in-depth analysis of 40+ countries; 5 top-performing countries are highlighted below.
India demonstrates the strongest growth potential in the Water Treatment Market with a CAGR of 11.6% through 2035. The country's leadership position stems from massive water infrastructure projects, government-backed water security programs, and critical water scarcity management targets, driving the adoption of high-performance water treatment systems. Growth is concentrated in major urban regions, including Mumbai, Delhi, Bangalore, and Chennai, where municipalities and industries are implementing advanced treatment solutions for enhanced water security and environmental compliance advantages. Distribution channels through established infrastructure developers and direct technology relationships expand deployment across municipal facilities, industrial complexes, and commercial buildings. The country's water security strategy provides policy support for advanced treatment technology development, including high-performance filtration platform adoption.
Key market factors:
In Beijing, Shanghai, Guangzhou, and Shenzhen, the adoption of water treatment systems is accelerating across industrial facilities and municipal infrastructure, driven by environmental compliance targets and comprehensive water resource management initiatives. The market demonstrates strong growth momentum with a CAGR of 7.5% through 2035, linked to comprehensive Water Ten Plan programs and increasing focus on industrial water recycling solutions. Chinese industries and municipalities are implementing advanced treatment systems and zero liquid discharge platforms to enhance operational performance while meeting stringent environmental requirements in domestic and international markets. The country's industrial development programs create demand for high-performance treatment solutions, while increasing emphasis on water resource conservation drives adoption of advanced recycling technologies and integrated monitoring systems.
The UK's advanced water industry demonstrates sophisticated implementation of water treatment systems, with documented case studies showing efficiency improvements in municipal applications through optimized treatment solutions. The country's water infrastructure in major service regions, including Thames Water, United Utilities, Yorkshire Water, and Anglian Water areas, showcases integration of advanced treatment technologies with existing water systems, leveraging expertise in water management and environmental compliance. British water utilities emphasize performance standards and regulatory compliance, creating demand for high-performance treatment solutions that support water quality initiatives and environmental requirements. The market maintains steady growth through focus on infrastructure modernization and operational excellence, with a CAGR of 7.0% through 2035.
Key development areas:
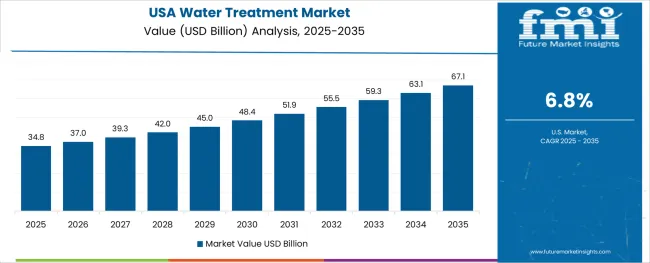
The USA's market expansion is driven by diverse water applications, including municipal treatment in California and Texas regions, industrial development in the Great Lakes and Gulf Coast, and comprehensive infrastructure modernization across multiple water service areas. The country demonstrates promising growth potential with a CAGR of 6.8% through 2035, supported by infrastructure investment programs and regional water security initiatives. American utilities and industries face implementation challenges related to aging infrastructure replacement and regulatory compliance requirements, requiring system upgrade approaches and technology integration support. However, growing water security concerns and environmental compliance requirements create compelling business cases for water treatment system adoption, particularly in municipal and industrial sectors where treatment performance has a direct impact on operational reliability.
Market characteristics:
Germany's market leads in advanced water technology integration based on comprehensive industrial water management and sophisticated treatment applications for enhanced operational characteristics. The country shows solid potential with a CAGR of 6.1% through 2035, driven by industrial modernization programs and environmental excellence initiatives across major industrial regions, including North Rhine-Westphalia, Bavaria, Baden-Württemberg, and Lower Saxony. German industries are adopting advanced treatment systems for process optimization and environmental compliance, particularly in regions with manufacturing excellence and chemical processing facilities requiring superior treatment capabilities. Technology deployment channels through established water technology companies and direct industrial relationships expand coverage across manufacturing facilities and municipal utilities.
Leading market segments:
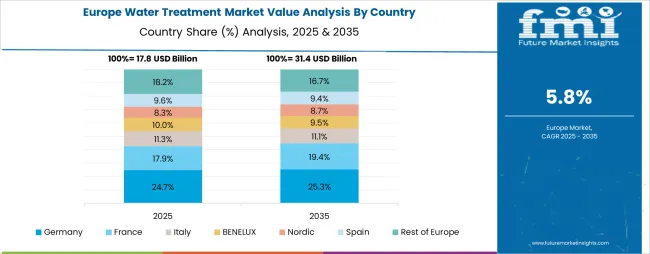
The water treatment market in Europe is projected to grow from USD 19.8 billion in 2025 to USD 35.9 billion by 2035, registering a CAGR of 5.7% over the forecast period. Germany is expected to maintain its leadership position with a 26.1% market share in 2025, declining slightly to 25.8% by 2035, supported by its extensive industrial infrastructure and major water technology centers, including North Rhine-Westphalia, Bavaria, and Baden-Württemberg technology hubs.
The United Kingdom follows with a 19.3% share in 2025, projected to reach 19.6% by 2035, driven by comprehensive water utility programs and advanced infrastructure modernization initiatives implementing treatment technologies. France holds a 15.8% share in 2025, expected to maintain 15.5% by 2035 through ongoing industrial development and water management excellence programs. Italy commands a 13.6% share, while Spain accounts for 11.2% in 2025. The Rest of Europe region is anticipated to gain momentum, expanding its collective share from 14.0% to 14.8% by 2035, attributed to increasing water treatment adoption in Nordic countries and emerging Eastern European water infrastructure markets implementing advanced treatment programs.
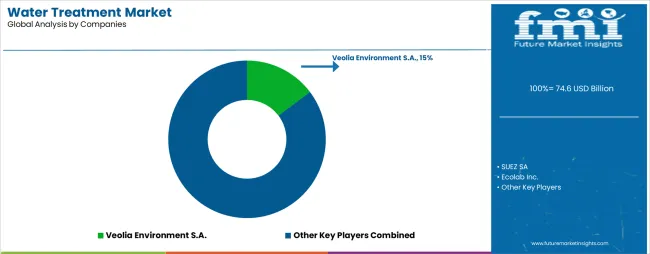
The water treatment market features approximately 20-25 meaningful players with moderate concentration, where the top three companies control roughly 35-40% of global market share through established technology platforms and extensive water utility relationships. Competition centers on technological innovation, treatment efficiency, and comprehensive service capabilities rather than price competition alone.
Market leaders include SUEZ SA, Veolia Environment S.A., and Xylem Inc., which maintain competitive advantages through comprehensive water management solution portfolios, global service networks, and deep expertise in the water technology and environmental services sectors, creating high switching costs for customers. These companies leverage research and development capabilities and ongoing operational support relationships to defend market positions while expanding into adjacent smart water and resource recovery applications.
Challengers encompass Ecolab Inc. and Pentair Plc, which compete through specialized treatment solutions and strong regional presence in key industrial markets. Technology specialists, including Evoqua Water Technologies LLC, BWT Aktiengesellschaft, and Thermax Global, focus on specific treatment applications or vertical markets, offering differentiated capabilities in membrane technology, industrial process water, and specialized treatment systems.
Regional players and emerging technology providers create competitive pressure through innovative solutions and rapid customization capabilities, particularly in high-growth markets including India, China, and Brazil, where local presence provides advantages in regulatory compliance and infrastructure integration. Market dynamics favor companies that combine advanced treatment technologies with comprehensive service offerings that address the complete water management lifecycle from system design through ongoing performance optimization.
Water treatment systems represent advanced environmental technologies that enable municipalities and industries to achieve 95-99% improvement in water quality compared to basic filtration systems, delivering superior environmental compliance and resource optimization with enhanced monitoring capabilities in demanding water management applications. With the market projected to grow from USD 74.6 billion in 2025 to USD 146.7 billion by 2035 at a 7.0% CAGR, these technology systems offer compelling advantages - enhanced water security, customizable treatment protocols, and comprehensive monitoring integration - making them essential for municipalities, industrial facilities, and commercial buildings seeking alternatives to conventional water systems that compromise quality through inadequate treatment and resource waste. Scaling market adoption and technological advancement requires coordinated action across environmental regulations, water infrastructure standards development, technology manufacturers, water utilities, and environmental technology investment capital.
| Items | Values |
|---|---|
| Quantitative Units | USD 74.6 billion |
| System Type | Preliminary Treatment, Water Treatment, Membrane Bio-reactor (MBR), Reverse Osmosis (RO), Micro-filtration (MF), Nano/Ultra Filtration (NF/UF), Disinfectants (UV, Ozone), Sludge Treatment, Activated Sludge, Sludge Thickening & Dewatering, Sludge Drying, Others |
| Application | Process Water/Water Treatment, Wastewater Treatment, Zero Liquid Discharge, Desalination |
| End Use | Residential Buildings, Commercial Buildings, Municipality, Industrial, Chemical & Petrochemicals, Oil & Gas, Mining & Metals, Food & Beverage, Pharmaceuticals, Thermoelectric Power Plants, Semiconductors, Others |
| Regions Covered | North America, Latin America, Western Europe, Eastern Europe, East Asia, South Asia Pacific, Middle East & Africa |
| Country Covered | India, China, UK, USA, Germany, and 40+ countries |
| Key Companies Profiled | SUEZ SA, Veolia Environment S.A., Ecolab Inc., Xylem Inc., Pentair Plc, Evoqua Water Technologies LLC, BWT Aktiengesellschaft, Thermax Global, Voltas Limited |
| Additional Attributes | Dollar sales by system type, application, and end use categories, regional adoption trends across South Asia Pacific, East Asia, and North America, competitive landscape with technology providers and water utility integrators, infrastructure requirements and specifications, integration with environmental compliance initiatives and water security systems, innovations in treatment technology and monitoring systems, and development of specialized configurations with efficiency and reliability capabilities. |
The global water treatment market is estimated to be valued at USD 74.6 billion in 2025.
The market size for the water treatment market is projected to reach USD 146.7 billion by 2035.
The water treatment market is expected to grow at a 7.0% CAGR between 2025 and 2035.
The key product types in water treatment market are reverse osmosis (ro), water treatment, membrane bio-reactor (mbr), preliminary treatment, micro-filtration (mf), nano/ultra filtration (nf/uf), disinfectants (uv, ozone), sludge treatment, activated sludge, sludge thickening & dewatering, sludge drying and other sludge treatment technology.
In terms of end use, commercial buildings segment to command 50.0% share in the water treatment market in 2025.


Full Research Suite comprises of:
Market outlook & trends analysis
Interviews & case studies
Strategic recommendations
Vendor profiles & capabilities analysis
5-year forecasts
8 regions and 60+ country-level data splits
Market segment data splits
12 months of continuous data updates
DELIVERED AS:
PDF EXCEL ONLINE
Water Treatment System Market Size and Share Forecast Outlook 2025 to 2035
Water Treatment Chemical Market Size and Share Forecast Outlook 2025 to 2035
Water Treatment Ozone Generator Market Size and Share Forecast Outlook 2025 to 2035
Water Treatment Equipment Market Size and Share Forecast Outlook 2025 to 2035
Water Treatment Polymers Market Growth & Demand 2025 to 2035
Water and Wastewater Treatment Equipment Market Size and Share Forecast Outlook 2025 to 2035
Water & Wastewater Treatment Chemical Market Growth – Trends & Forecast 2024-2034
Wastewater Treatment Aerators Market Size and Share Forecast Outlook 2025 to 2035
Wastewater Heavy Metal Treatment Agent Market Size and Share Forecast Outlook 2025 to 2035
Boiler Water Treatment Chemicals Market Size and Share Forecast Outlook 2025 to 2035
Cooling Water Treatment Chemicals Market Growth - Trends & Forecast 2025 to 2035
Ballast Water Treatment System Market
Produced Water Treatment System Market Size and Share Forecast Outlook 2025 to 2035
Aquarium Water Treatment Market Growth - Trends & Forecast 2025 to 2035
Industrial Water Treatment Market Size and Share Forecast Outlook 2025 to 2035
Enzymes for Water Treatment Market Size and Share Forecast Outlook 2025 to 2035
Residential Water Treatment Devices Market Size and Share Forecast Outlook 2025 to 2035
Industrial Wastewater Treatment Chemical Market Insights - Growth & Demand 2025 to 2035
South America Residential Water Treatment Equipment Market Trends – Growth & Forecast 2022 to 2032
Bioelectrochemical Systems For Wastewater Treatment Market Size and Share Forecast Outlook 2025 to 2035

Thank you!
You will receive an email from our Business Development Manager. Please be sure to check your SPAM/JUNK folder too.
Chat With
MaRIA