Reports

- Global Locations -

Headquarters

Future Market Insights, Inc.

Christiana Corporate, 200
Continental Drive, Suite 401,
Newark, Delaware - 19713,
United States

T: +1-845-579-5705

Americas

Future Market Insights, Inc.

616 Corporate Way, Suite 2-9018,
Valley Cottage, NY 10989, United States

T: +1-347-918-3531

MEA

Future Market Insights

1602-6 Jumeirah Bay X2 Tower, Plot No: JLT-PH2-X2A,
Jumeirah Lakes Towers, Dubai,
United Arab Emirates

Europe

Future Market Insights

3rd Floor, 207 Regent Street,
W1B 3HH London
United Kingdom

T: + 44 (0) 20 8123 9659
D: +44 (0) 20 3287 4268

Asia Pacific

Future Market Insights

IndiaLand Global Tech Park, Unit UG-1, Behind Grand HighStreet, Phase 1, Hinjawadi, MH, Pune – 411057, India

Woodfree Paper Market Snapshot (2022 to 2032)

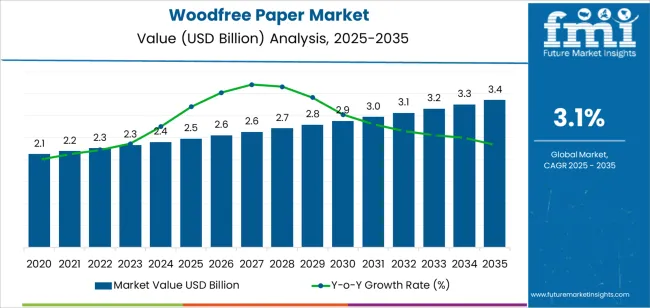
The global woodfree paper market size is likely to reach US$ 1,591.9 Million in 2022 and US$ 2,018.0 Million in 2032. As per the report, sales in the woodfree paper market are projected to surge at 2.4% CAGR in the forecast period (2022 to 2032) from 1.7% in the historical period of 2016 to 2021.

Increasing demand for recyclable paper materials and urgent need for environmentally friendly printing solutions are expected to push sales of white woodfree paper in the next decade. Besides, the surging need for efficient printing solutions for high-end catalogs and magazines is another factor that is projected to drive the requirement for wood-free printing paper.

Report Attributes Key Statistics
Projected Market Value (2022) US$ 1,591.9 Million
Anticipated Forecast Value (2032) US$ 2,018.0 Million
Estimated Growth Rate (2022 to 2032) 2.4%

Woodfree paper, also known as C2S/C1S, is referred to as a paper created from chemical pulp rather than mechanical pulp. Chemical pulp is made of pulpwood and is not considered to be wood as the majority of the lignin is eliminated and extracted from cellulose fibers amid processing.

The rising use of woodfree printing paper for archival printing owing to its ability to deliver excellent contrast quality and easy application of pigment-based inks is a vital factor that would spur the market. International companies are expected to invest huge sums in research activities to discover cutting-edge paper for the packaging of their products.

In June 2022, for instance, Ben & Jerry’s, a reputed manufacturer of ice creams, sorbet, and frozen yogurt based in the USA, signed up for the Pack4Good initiative, which is specially designed to encourage companies to adopt circular feedstock.

The company’s Pack4Good policy mentioned that it will use FSC-certified wood, surge utilization of recycled next-generation fibers, lower material use by design innovation, and continue to be free of endangered or ancient forest fiber by the end of 2022. Rising initiatives by key companies to increase sustainability by adopting coated woodfree paper are set to accelerate the market.

Don't pay for what you don't need

Customize your report by selecting specific countries or regions and save 30%!

What are the Factors Propelling the Global Woodfree Paper Market?

Increasing utilization of woodfree printing paper in premium applications where durable, quality paper is needed is expected to boost the global market. Acid-free paper with little lignin is often used to preserve significant artworks and documents. Often, an alkaline buffer is added to prevent acid erosion.

Special acid-free archival paper is required when exceptional longevity is the top priority. Woodfree papers are made of cotton rag or similar pulp comprised of cellulose. Woodfree sticker papers help in providing the highest quality standards for finished products. Spurred by the aforementioned advantages, the woodfree paper market growth is projected to surge in the evaluation period.

What are the Factors Limiting the Woodfree Paper Market?

Coated woodfree papers are not able to be written on easily with a pen. If a particular project requires a lot of text, the glare of glossy-coated paper can make it difficult to read. These papers provide high ink gloss and thus frequently require an overall coating for protecting the surface from fingerprints and scratching.

Further, uncoated woodfree papers need additional drying time depending on the amount of ink used. Areas featuring heavy metallic or solids can get a mottled look depending on the formation of the paper. Uncoated papers are extensively used for protective purposes and not as designing elements. The aforementioned limitations may decline demand for woodfree paper in the assessment period.

Ismail Sutaria
Ismail Sutaria

Principal Consultant

Talk to Analyst

Find your sweet spots for generating winning opportunities in this market.

Why is North America Projected to Dominate the Global Woodfree Paper Market?

North America is anticipated to generate about 17% of the woodfree paper market share in 2022, says FMI. The presence of a large number of reputed paper and pulp manufacturers across Canada and the USA is expected to surge investments in Research and Development activities during the forecast period.

Avery Dennison Corporation, for instance, is a multinational distributor and manufacturer of labeling and packaging materials based in Ohio. In November 2021, the company launched three white, uncoated woodfree papers that are made of 100% recycled fibers.

The company has been investing in recycled materials with a wide range of patterns, thicknesses, and structure complexity. It aims to expand its post-consumer recycled materials portfolio for beverages, food, spirits, and wine labels. Such initiatives taken by renowned players are projected to drive the North American market.

What is the Contribution of Europe to Developing the Woodfree Paper Market?

As per FMI, Europe is projected to hold a share of nearly 19% in the woodfree paper market by the end of 2022. The rising launch of new magazines by organizations for marketing purposes across the UK, Germany, and Italy is anticipated to fuel sales of woodfree paper in the forthcoming years.

Increasing demand for lifestyle and shopping magazines among the young population, as well as newsworthy magazines among the geriatric population, would also contribute to the high sales of woodfree gloss paper in Europe.

According to the National Readership Survey, around 40% of adults in Great Britain consume general weekly magazines across online and print, whereas approximately 23% of adults purchase women’s weekly magazines in Great Britain. Spurred by the aforementioned factors, demand for woodfree offset paper is likely to surge across Europe.

Get the data you need at a Fraction of the cost

Personalize your report by choosing insights you need
and save 40%!

How Start-ups Are Adding Value to the Global Woodfree Paper Market?

Ever-increasing concerns about the environment are gradually bringing new entrants to the woodfree offset paper space. Start-up food and beverage manufacturers are collaborating with international packaging companies to co-develop sustainable woodfree paper packaging for selling their products.

Meanwhile, some of the start-ups based in emerging economies are striving to reduce pollution caused due to conventional paper processing. To do so, they are focusing on producing paper in sustainable ways by utilizing eco-friendly raw materials, including agro waste.

  • Dirty Cow Chocolate, a London-based boutique handmade chocolate manufacturing start-up founded in 2020, teamed up with Parkside, a renowned packaging company in October 2021 to develop a new compostable pack for its dairy-free and vegan ‘messy’ chocolate bars. The start-up aims to move towards sustainability by using a new pack developed for offering a practical option to benefit the environment.
  • In June 2020, entrepreneur Kavya Madappa unveiled Bluecat Paper, her new venture to produce wood-free printing paper in India. Her company uses industrial and agro wastes such as banana stumps, mulberry, coconut husk, rice stubble, cotton rags, coffee husk, lemongrass, and flax to make paper. The company collects around 20 tons of secondary waste from five factory units and 100 farmers every month.

Competition Analysis

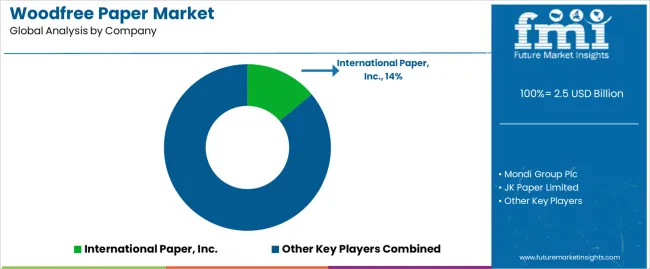
Some of the key players present in the global woodfree paper market are Imerys Kaolin Inc., Kobax Paper and Board, and TELE-PAPER (M) SDN. BHD., JK Paper Limited, Nine Dragons Paper (Holdings) Limited, The Navigator Company, S.A., Rainbow Papers Limited, Seshasayee Paper and Boards Limited, Moorim Paper Co., Ltd, and Drewsen Spezialpapiere GmbH & Co KG. among others.

The global market is fragmented in nature with the presence of a large number of key players. The majority of these players are aiming to engage in collaborations and partnerships with local or international companies to expand their existing product lines and innovate their in-house products to generate high shares. A few other key players are increasing prices of wood-free uncoated paper to keep up with volatility in various end-use industries.

For instance,

  • In May 2022, Hotel Supply International, a provider of high-quality hotel supplies headquartered in Sassenheim, joined hands with Mainetti, a USA-based innovative hanger manufacturing company, to introduce a unique, sustainable hanger. The latter will be providing its patented Paperform Hanger range to clients who want to go plastic or wood-free.
  • In December 2021, the Navigator Company, a leading firm in the pulp and paper market-based in Portugal, announced that it is planning to double the rate of uncoated woodfree paper from €50 to €100 per ton on the back of persistent variable cost surges. The company has been facing constant increases in terms of variable costs, especially in the logistics and energy sectors.

Report Scope

Report Attribute Details
Market Value in 2022 US$ 1,591.9 Million
Market Value in 2032 US$ 2,018.0 Million
Growth Rate CAGR of 2.4% from 2022 to 2032
Base Year for Estimation 2021
Historical Data 2016 to 2021
Forecast Period 2022 to 2032
Quantitative Units US$ Million for Value
Report Coverage Revenue forecast, volume forecast, company ranking, competitive landscape, growth factors, trends, and pricing analysis
Segments Covered
  • Coating Type
  • Surface Finish Type
  • Application
  • Region
Regions Covered
  • North America
  • Latin America
  • Europe
  • Asia Pacific
  • Middle East and Africa
Key Countries Profiled
  • United States of America
  • Canada
  • Brazil
  • Argentina
  • Germany
  • United Kingdom
  • France
  • Spain
  • Italy
  • Nordics
  • BENELUX
  • Australia & New Zealand
  • China
  • India
  • ASEAN
  • GCC Countries
  • South Africa
Key Companies Profiled
  • Imerys Kaolin Inc.
  • Kobax Paper and Board
  • TELE-PAPER (M) SDN. BHD.
  • JK Paper Limited
  • Nine Dragons Paper (Holdings) Limited
  • The Navigator Company, S.A.
  • Rainbow Papers Limited
  • Seshasayee Paper and Boards Limited
  • Moorim Paper Co., Ltd
  • Drewsen Spezialpapiere GmbH & Co KG.
Customization Available Upon Request

Key Segments Profiled in the Global Woodfree Paper Market

By Coating Type:

  • Coated Woodfree Paper
  • Uncoated Woodfree Paper

By Surface Finish Type:

  • Matt Finish
  • Gloss Finish
  • Silk Finish

By Application:

  • Magazines and Catalogues
  • Envelopes
  • Notebooks
  • Advertising Material
  • Others

By Region:

  • North America
  • Latin America
  • Europe
  • Asia Pacific
  • Middle East and Africa

Frequently Asked Questions

What is the projected market value of the woodfree paper market by 2032?

The global woodfree paper market is expected to secure US$ 2,018.0 Million by 2032.

At what CAGR is the market for woodfree paper expected to grow from 2022 to 2032?

The woodfree paper market is anticipated to showcase a CAGR of 2.4% from 2022 to 2032.

Which are the eminent players in the woodfree paper market?

Imerys Kaolin Inc., Kobax Paper and Board, TELE-PAPER (M) SDN. BHD., JK Paper Limited, Nine Dragons Paper (Holdings) Limited, and The Navigator Company, S.A. are some of the eminent players in the global woodfree paper market.

Table of Content

1. Executive Summary | Woodfree Paper Market

    1.1. Global Market Outlook

    1.2. Demand-side Trends

    1.3. Supply-side Trends

    1.4. Technology Roadmap Analysis

    1.5. Analysis and Recommendations

2. Market Overview

    2.1. Market Coverage / Taxonomy

    2.2. Market Definition / Scope / Limitations

3. Market Background

    3.1. Market Dynamics

        3.1.1. Drivers

        3.1.2. Restraints

        3.1.3. Opportunity

        3.1.4. Trends

    3.2. Scenario Forecast

        3.2.1. Demand in Optimistic Scenario

        3.2.2. Demand in Likely Scenario

        3.2.3. Demand in Conservative Scenario

    3.3. Opportunity Map Analysis

    3.4. Product Life Cycle Analysis

    3.5. Supply Chain Analysis

        3.5.1. Supply Side Participants and their Roles

            3.5.1.1. Producers

            3.5.1.2. Mid-Level Participants (Traders/ Agents/ Brokers)

            3.5.1.3. Wholesalers and Distributors

        3.5.2. Value Added and Value Created at Node in the Supply Chain

        3.5.3. List of Raw Material Suppliers

        3.5.4. List of Existing and Potential Buyers

    3.6. Investment Feasibility Matrix

    3.7. Value Chain Analysis

        3.7.1. Profit Margin Analysis

        3.7.2. Wholesalers and Distributors

        3.7.3. Retailers

    3.8. PESTLE and Porter’s Analysis

    3.9. Regulatory Landscape

        3.9.1. By Key Regions

        3.9.2. By Key Countries

    3.10. Regional Parent Market Outlook

    3.11. Production and Consumption Statistics

    3.12. Import and Export Statistics

4. Global Market Analysis 2017 to 2021 and Forecast, 2022 to 2032

    4.1. Historical Market Size Value (US$ Million) & Volume (Tons) Analysis, 2017 to 2021

    4.2. Current and Future Market Size Value (US$ Million) & Volume (Tons) Projections, 2022 to 2032

        4.2.1. Y-o-Y Growth Trend Analysis

        4.2.2. Absolute $ Opportunity Analysis

5. Global Market Analysis 2017 to 2021 and Forecast 2022 to 2032, By Coating Type

    5.1. Introduction / Key Findings

    5.2. Historical Market Size Value (US$ Million) & Volume (Tons) Analysis By Coating Type, 2017 to 2021

    5.3. Current and Future Market Size Value (US$ Million) & Volume (Tons) Analysis and Forecast By Coating Type, 2022 to 2032

        5.3.1. Coated Woodfree Paper

        5.3.2. Uncoated Woodfree Paper

    5.4. Y-o-Y Growth Trend Analysis By Coating Type, 2017 to 2021

    5.5. Absolute $ Opportunity Analysis By Coating Type, 2022 to 2032

6. Global Market Analysis 2017 to 2021 and Forecast 2022 to 2032, By Surface Finish Type

    6.1. Introduction / Key Findings

    6.2. Historical Market Size Value (US$ Million) & Volume (Tons) Analysis By Surface Finish Type, 2017 to 2021

    6.3. Current and Future Market Size Value (US$ Million) & Volume (Tons) Analysis and Forecast By Surface Finish Type, 2022 to 2032

        6.3.1. Matt Finish

        6.3.2. Gloss Finish

        6.3.3. Silk Finish

    6.4. Y-o-Y Growth Trend Analysis By Surface Finish Type, 2017 to 2021

    6.5. Absolute $ Opportunity Analysis By Surface Finish Type, 2022 to 2032

7. Global Market Analysis 2017 to 2021 and Forecast 2022 to 2032, By Application

    7.1. Introduction / Key Findings

    7.2. Historical Market Size Value (US$ Million) & Volume (Tons) Analysis By Application, 2017 to 2021

    7.3. Current and Future Market Size Value (US$ Million) & Volume (Tons) Analysis and Forecast By Application, 2022 to 2032

        7.3.1. Magazines and Catalogues

        7.3.2. Envelopes

        7.3.3. Notebooks

        7.3.4. Advertising Material

        7.3.5. Others

    7.4. Y-o-Y Growth Trend Analysis By Application, 2017 to 2021

    7.5. Absolute $ Opportunity Analysis By Application, 2022 to 2032

8. Global Market Analysis 2017 to 2021 and Forecast 2022 to 2032, By Region

    8.1. Introduction

    8.2. Historical Market Size Value (US$ Million) & Volume (Tons) Analysis By Region, 2017 to 2021

    8.3. Current Market Size Value (US$ Million) & Volume (Tons) Analysis and Forecast By Region, 2022 to 2032

        8.3.1. North America

        8.3.2. Latin America

        8.3.3. Europe

        8.3.4. Asia Pacific

        8.3.5. Middle East and Africa

    8.4. Market Attractiveness Analysis By Region

9. North America Market Analysis 2017 to 2021 and Forecast 2022 to 2032, By Country

    9.1. Historical Market Size Value (US$ Million) & Volume (Tons) Trend Analysis By Market Taxonomy, 2017 to 2021

    9.2. Market Size Value (US$ Million) & Volume (Tons) Forecast By Market Taxonomy, 2022 to 2032

        9.2.1. By Country

            9.2.1.1. United States of America

            9.2.1.2. Canada

        9.2.2. By Coating Type

        9.2.3. By Surface Finish Type

        9.2.4. By Application

    9.3. Market Attractiveness Analysis

        9.3.1. By Country

        9.3.2. By Coating Type

        9.3.3. By Surface Finish Type

        9.3.4. By Application

    9.4. Key Takeaways

10. Latin America Market Analysis 2017 to 2021 and Forecast 2022 to 2032, By Country

    10.1. Historical Market Size Value (US$ Million) & Volume (Tons) Trend Analysis By Market Taxonomy, 2017 to 2021

    10.2. Market Size Value (US$ Million) & Volume (Tons) Forecast By Market Taxonomy, 2022 to 2032

        10.2.1. By Country

            10.2.1.1. Brazil

            10.2.1.2. Mexico

            10.2.1.3. Rest of Latin America

        10.2.2. By Coating Type

        10.2.3. By Surface Finish Type

        10.2.4. By Application

    10.3. Market Attractiveness Analysis

        10.3.1. By Country

        10.3.2. By Coating Type

        10.3.3. By Surface Finish Type

        10.3.4. By Application

    10.4. Key Takeaways

11. Europe Market Analysis 2017 to 2021 and Forecast 2022 to 2032, By Country

    11.1. Historical Market Size Value (US$ Million) & Volume (Tons) Trend Analysis By Market Taxonomy, 2017 to 2021

    11.2. Market Size Value (US$ Million) & Volume (Tons) Forecast By Market Taxonomy, 2022 to 2032

        11.2.1. By Country

            11.2.1.1. Germany

            11.2.1.2. United Kingdom

            11.2.1.3. France

            11.2.1.4. Spain

            11.2.1.5. Italy

            11.2.1.6. Rest of Europe

        11.2.2. By Coating Type

        11.2.3. By Surface Finish Type

        11.2.4. By Application

    11.3. Market Attractiveness Analysis

        11.3.1. By Country

        11.3.2. By Coating Type

        11.3.3. By Surface Finish Type

        11.3.4. By Application

    11.4. Key Takeaways

12. Asia Pacific Market Analysis 2017 to 2021 and Forecast 2022 to 2032, By Country

    12.1. Historical Market Size Value (US$ Million) & Volume (Tons) Trend Analysis By Market Taxonomy, 2017 to 2021

    12.2. Market Size Value (US$ Million) & Volume (Tons) Forecast By Market Taxonomy, 2022 to 2032

        12.2.1. By Country

            12.2.1.1. China

            12.2.1.2. Japan

            12.2.1.3. South Korea

            12.2.1.4. Malaysia

            12.2.1.5. Singapore

            12.2.1.6. Australia

            12.2.1.7. New Zealand

            12.2.1.8. Rest of Asia-Pacific

        12.2.2. By Coating Type

        12.2.3. By Surface Finish Type

        12.2.4. By Application

    12.3. Market Attractiveness Analysis

        12.3.1. By Country

        12.3.2. By Coating Type

        12.3.3. By Surface Finish Type

        12.3.4. By Application

    12.4. Key Takeaways

13. Middle East and Africa Market Analysis 2017 to 2021 and Forecast 2022 to 2032, By Country

    13.1. Historical Market Size Value (US$ Million) & Volume (Tons) Trend Analysis By Market Taxonomy, 2017 to 2021

    13.2. Market Size Value (US$ Million) & Volume (Tons) Forecast By Market Taxonomy, 2022 to 2032

        13.2.1. By Country

            13.2.1.1. GCC Countries

            13.2.1.2. South Africa

            13.2.1.3. Israel

            13.2.1.4. Rest of Middle East and Africa

        13.2.2. By Coating Type

        13.2.3. By Surface Finish Type

        13.2.4. By Application

    13.3. Market Attractiveness Analysis

        13.3.1. By Country

        13.3.2. By Coating Type

        13.3.3. By Surface Finish Type

        13.3.4. By Application

    13.4. Key Takeaways

14. Key Countries Market Analysis

    14.1. United States of America

        14.1.1. Pricing Analysis

        14.1.2. Market Share Analysis, 2021

            14.1.2.1. By Coating Type

            14.1.2.2. By Surface Finish Type

            14.1.2.3. By Application

    14.2. Canada

        14.2.1. Pricing Analysis

        14.2.2. Market Share Analysis, 2021

            14.2.2.1. By Coating Type

            14.2.2.2. By Surface Finish Type

            14.2.2.3. By Application

    14.3. Brazil

        14.3.1. Pricing Analysis

        14.3.2. Market Share Analysis, 2021

            14.3.2.1. By Coating Type

            14.3.2.2. By Surface Finish Type

            14.3.2.3. By Application

    14.4. Mexico

        14.4.1. Pricing Analysis

        14.4.2. Market Share Analysis, 2021

            14.4.2.1. By Coating Type

            14.4.2.2. By Surface Finish Type

            14.4.2.3. By Application

    14.5. Germany

        14.5.1. Pricing Analysis

        14.5.2. Market Share Analysis, 2021

            14.5.2.1. By Coating Type

            14.5.2.2. By Surface Finish Type

            14.5.2.3. By Application

    14.6. United Kingdom

        14.6.1. Pricing Analysis

        14.6.2. Market Share Analysis, 2021

            14.6.2.1. By Coating Type

            14.6.2.2. By Surface Finish Type

            14.6.2.3. By Application

    14.7. France

        14.7.1. Pricing Analysis

        14.7.2. Market Share Analysis, 2021

            14.7.2.1. By Coating Type

            14.7.2.2. By Surface Finish Type

            14.7.2.3. By Application

    14.8. Spain

        14.8.1. Pricing Analysis

        14.8.2. Market Share Analysis, 2021

            14.8.2.1. By Coating Type

            14.8.2.2. By Surface Finish Type

            14.8.2.3. By Application

    14.9. Italy

        14.9.1. Pricing Analysis

        14.9.2. Market Share Analysis, 2021

            14.9.2.1. By Coating Type

            14.9.2.2. By Surface Finish Type

            14.9.2.3. By Application

    14.10. China

        14.10.1. Pricing Analysis

        14.10.2. Market Share Analysis, 2021

            14.10.2.1. By Coating Type

            14.10.2.2. By Surface Finish Type

            14.10.2.3. By Application

    14.11. Japan

        14.11.1. Pricing Analysis

        14.11.2. Market Share Analysis, 2021

            14.11.2.1. By Coating Type

            14.11.2.2. By Surface Finish Type

            14.11.2.3. By Application

    14.12. South Korea

        14.12.1. Pricing Analysis

        14.12.2. Market Share Analysis, 2021

            14.12.2.1. By Coating Type

            14.12.2.2. By Surface Finish Type

            14.12.2.3. By Application

    14.13. Malaysia

        14.13.1. Pricing Analysis

        14.13.2. Market Share Analysis, 2021

            14.13.2.1. By Coating Type

            14.13.2.2. By Surface Finish Type

            14.13.2.3. By Application

    14.14. Singapore

        14.14.1. Pricing Analysis

        14.14.2. Market Share Analysis, 2021

            14.14.2.1. By Coating Type

            14.14.2.2. By Surface Finish Type

            14.14.2.3. By Application

    14.15. Australia

        14.15.1. Pricing Analysis

        14.15.2. Market Share Analysis, 2021

            14.15.2.1. By Coating Type

            14.15.2.2. By Surface Finish Type

            14.15.2.3. By Application

    14.16. New Zealand

        14.16.1. Pricing Analysis

        14.16.2. Market Share Analysis, 2021

            14.16.2.1. By Coating Type

            14.16.2.2. By Surface Finish Type

            14.16.2.3. By Application

    14.17. GCC Countries

        14.17.1. Pricing Analysis

        14.17.2. Market Share Analysis, 2021

            14.17.2.1. By Coating Type

            14.17.2.2. By Surface Finish Type

            14.17.2.3. By Application

    14.18. South Africa

        14.18.1. Pricing Analysis

        14.18.2. Market Share Analysis, 2021

            14.18.2.1. By Coating Type

            14.18.2.2. By Surface Finish Type

            14.18.2.3. By Application

    14.19. Israel

        14.19.1. Pricing Analysis

        14.19.2. Market Share Analysis, 2021

            14.19.2.1. By Coating Type

            14.19.2.2. By Surface Finish Type

            14.19.2.3. By Application

15. Market Structure Analysis

    15.1. Competition Dashboard

    15.2. Competition Benchmarking

    15.3. Market Share Analysis of Top Players

        15.3.1. By Regional

        15.3.2. By Coating Type

        15.3.3. By Surface Finish Type

        15.3.4. By Application

16. Competition Analysis

    16.1. Competition Deep Dive

        16.1.1. Imerys Kaolin Inc.

            16.1.1.1. Overview

            16.1.1.2. Product Portfolio

            16.1.1.3. Profitability by Market Segments

            16.1.1.4. Sales Footprint

            16.1.1.5. Strategy Overview

                16.1.1.5.1. Marketing Strategy

                16.1.1.5.2. Product Strategy

                16.1.1.5.3. Channel Strategy

        16.1.2. Kobax Paper and Board

            16.1.2.1. Overview

            16.1.2.2. Product Portfolio

            16.1.2.3. Profitability by Market Segments

            16.1.2.4. Sales Footprint

            16.1.2.5. Strategy Overview

                16.1.2.5.1. Marketing Strategy

                16.1.2.5.2. Product Strategy

                16.1.2.5.3. Channel Strategy

        16.1.3. TELE-PAPER (M) SDN

            16.1.3.1. Overview

            16.1.3.2. Product Portfolio

            16.1.3.3. Profitability by Market Segments

            16.1.3.4. Sales Footprint

            16.1.3.5. Strategy Overview

                16.1.3.5.1. Marketing Strategy

                16.1.3.5.2. Product Strategy

                16.1.3.5.3. Channel Strategy

        16.1.4. JK Paper Limited

            16.1.4.1. Overview

            16.1.4.2. Product Portfolio

            16.1.4.3. Profitability by Market Segments

            16.1.4.4. Sales Footprint

            16.1.4.5. Strategy Overview

                16.1.4.5.1. Marketing Strategy

                16.1.4.5.2. Product Strategy

                16.1.4.5.3. Channel Strategy

        16.1.5. Nine Dragons Paper

            16.1.5.1. Overview

            16.1.5.2. Product Portfolio

            16.1.5.3. Profitability by Market Segments

            16.1.5.4. Sales Footprint

            16.1.5.5. Strategy Overview

                16.1.5.5.1. Marketing Strategy

                16.1.5.5.2. Product Strategy

                16.1.5.5.3. Channel Strategy

        16.1.6. Navigator Company

            16.1.6.1. Overview

            16.1.6.2. Product Portfolio

            16.1.6.3. Profitability by Market Segments

            16.1.6.4. Sales Footprint

            16.1.6.5. Strategy Overview

                16.1.6.5.1. Marketing Strategy

                16.1.6.5.2. Product Strategy

                16.1.6.5.3. Channel Strategy

        16.1.7. Seshasayee Paper and Boards Limited

            16.1.7.1. Overview

            16.1.7.2. Product Portfolio

            16.1.7.3. Profitability by Market Segments

            16.1.7.4. Sales Footprint

            16.1.7.5. Strategy Overview

                16.1.7.5.1. Marketing Strategy

                16.1.7.5.2. Product Strategy

                16.1.7.5.3. Channel Strategy

        16.1.8. Moorim Paper Co.

            16.1.8.1. Overview

            16.1.8.2. Product Portfolio

            16.1.8.3. Profitability by Market Segments

            16.1.8.4. Sales Footprint

            16.1.8.5. Strategy Overview

                16.1.8.5.1. Marketing Strategy

                16.1.8.5.2. Product Strategy

                16.1.8.5.3. Channel Strategy

        16.1.9. Drewsen Spezialpapiere GmbH

            16.1.9.1. Overview

            16.1.9.2. Product Portfolio

            16.1.9.3. Profitability by Market Segments

            16.1.9.4. Sales Footprint

            16.1.9.5. Strategy Overview

                16.1.9.5.1. Marketing Strategy

                16.1.9.5.2. Product Strategy

                16.1.9.5.3. Channel Strategy

17. Assumptions & Acronyms Used

18. Research Methodology

List of Tables

Table 1: Global Market Value (US$ Million) Forecast by Region, 2017 to 2032

Table 2: Global Market Volume (Tons) Forecast by Region, 2017 to 2032

Table 3: Global Market Value (US$ Million) Forecast by Coating Type, 2017 to 2032

Table 4: Global Market Volume (Tons) Forecast by Coating Type, 2017 to 2032

Table 5: Global Market Value (US$ Million) Forecast by Surface Finish Type, 2017 to 2032

Table 6: Global Market Volume (Tons) Forecast by Surface Finish Type, 2017 to 2032

Table 7: Global Market Value (US$ Million) Forecast by Application, 2017 to 2032

Table 8: Global Market Volume (Tons) Forecast by Application, 2017 to 2032

Table 9: North America Market Value (US$ Million) Forecast by Country, 2017 to 2032

Table 10: North America Market Volume (Tons) Forecast by Country, 2017 to 2032

Table 11: North America Market Value (US$ Million) Forecast by Coating Type, 2017 to 2032

Table 12: North America Market Volume (Tons) Forecast by Coating Type, 2017 to 2032

Table 13: North America Market Value (US$ Million) Forecast by Surface Finish Type, 2017 to 2032

Table 14: North America Market Volume (Tons) Forecast by Surface Finish Type, 2017 to 2032

Table 15: North America Market Value (US$ Million) Forecast by Application, 2017 to 2032

Table 16: North America Market Volume (Tons) Forecast by Application, 2017 to 2032

Table 17: Latin America Market Value (US$ Million) Forecast by Country, 2017 to 2032

Table 18: Latin America Market Volume (Tons) Forecast by Country, 2017 to 2032

Table 19: Latin America Market Value (US$ Million) Forecast by Coating Type, 2017 to 2032

Table 20: Latin America Market Volume (Tons) Forecast by Coating Type, 2017 to 2032

Table 21: Latin America Market Value (US$ Million) Forecast by Surface Finish Type, 2017 to 2032

Table 22: Latin America Market Volume (Tons) Forecast by Surface Finish Type, 2017 to 2032

Table 23: Latin America Market Value (US$ Million) Forecast by Application, 2017 to 2032

Table 24: Latin America Market Volume (Tons) Forecast by Application, 2017 to 2032

Table 25: Europe Market Value (US$ Million) Forecast by Country, 2017 to 2032

Table 26: Europe Market Volume (Tons) Forecast by Country, 2017 to 2032

Table 27: Europe Market Value (US$ Million) Forecast by Coating Type, 2017 to 2032

Table 28: Europe Market Volume (Tons) Forecast by Coating Type, 2017 to 2032

Table 29: Europe Market Value (US$ Million) Forecast by Surface Finish Type, 2017 to 2032

Table 30: Europe Market Volume (Tons) Forecast by Surface Finish Type, 2017 to 2032

Table 31: Europe Market Value (US$ Million) Forecast by Application, 2017 to 2032

Table 32: Europe Market Volume (Tons) Forecast by Application, 2017 to 2032

Table 33: Asia Pacific Market Value (US$ Million) Forecast by Country, 2017 to 2032

Table 34: Asia Pacific Market Volume (Tons) Forecast by Country, 2017 to 2032

Table 35: Asia Pacific Market Value (US$ Million) Forecast by Coating Type, 2017 to 2032

Table 36: Asia Pacific Market Volume (Tons) Forecast by Coating Type, 2017 to 2032

Table 37: Asia Pacific Market Value (US$ Million) Forecast by Surface Finish Type, 2017 to 2032

Table 38: Asia Pacific Market Volume (Tons) Forecast by Surface Finish Type, 2017 to 2032

Table 39: Asia Pacific Market Value (US$ Million) Forecast by Application, 2017 to 2032

Table 40: Asia Pacific Market Volume (Tons) Forecast by Application, 2017 to 2032

Table 41: Middle East and Africa Market Value (US$ Million) Forecast by Country, 2017 to 2032

Table 42: Middle East and Africa Market Volume (Tons) Forecast by Country, 2017 to 2032

Table 43: Middle East and Africa Market Value (US$ Million) Forecast by Coating Type, 2017 to 2032

Table 44: Middle East and Africa Market Volume (Tons) Forecast by Coating Type, 2017 to 2032

Table 45: Middle East and Africa Market Value (US$ Million) Forecast by Surface Finish Type, 2017 to 2032

Table 46: Middle East and Africa Market Volume (Tons) Forecast by Surface Finish Type, 2017 to 2032

Table 47: Middle East and Africa Market Value (US$ Million) Forecast by Application, 2017 to 2032

Table 48: Middle East and Africa Market Volume (Tons) Forecast by Application, 2017 to 2032

List of Charts

Figure 1: Global Market Value (US$ Million) by Coating Type, 2022 to 2032

Figure 2: Global Market Value (US$ Million) by Surface Finish Type, 2022 to 2032

Figure 3: Global Market Value (US$ Million) by Application, 2022 to 2032

Figure 4: Global Market Value (US$ Million) by Region, 2022 to 2032

Figure 5: Global Market Value (US$ Million) Analysis by Region, 2017 to 2032

Figure 6: Global Market Volume (Tons) Analysis by Region, 2017 to 2032

Figure 7: Global Market Value Share (%) and BPS Analysis by Region, 2022 to 2032

Figure 8: Global Market Y-o-Y Growth (%) Projections by Region, 2022 to 2032

Figure 9: Global Market Value (US$ Million) Analysis by Coating Type, 2017 to 2032

Figure 10: Global Market Volume (Tons) Analysis by Coating Type, 2017 to 2032

Figure 11: Global Market Value Share (%) and BPS Analysis by Coating Type, 2022 to 2032

Figure 12: Global Market Y-o-Y Growth (%) Projections by Coating Type, 2022 to 2032

Figure 13: Global Market Value (US$ Million) Analysis by Surface Finish Type, 2017 to 2032

Figure 14: Global Market Volume (Tons) Analysis by Surface Finish Type, 2017 to 2032

Figure 15: Global Market Value Share (%) and BPS Analysis by Surface Finish Type, 2022 to 2032

Figure 16: Global Market Y-o-Y Growth (%) Projections by Surface Finish Type, 2022 to 2032

Figure 17: Global Market Value (US$ Million) Analysis by Application, 2017 to 2032

Figure 18: Global Market Volume (Tons) Analysis by Application, 2017 to 2032

Figure 19: Global Market Value Share (%) and BPS Analysis by Application, 2022 to 2032

Figure 20: Global Market Y-o-Y Growth (%) Projections by Application, 2022 to 2032

Figure 21: Global Market Attractiveness by Coating Type, 2022 to 2032

Figure 22: Global Market Attractiveness by Surface Finish Type, 2022 to 2032

Figure 23: Global Market Attractiveness by Application, 2022 to 2032

Figure 24: Global Market Attractiveness by Region, 2022 to 2032

Figure 25: North America Market Value (US$ Million) by Coating Type, 2022 to 2032

Figure 26: North America Market Value (US$ Million) by Surface Finish Type, 2022 to 2032

Figure 27: North America Market Value (US$ Million) by Application, 2022 to 2032

Figure 28: North America Market Value (US$ Million) by Country, 2022 to 2032

Figure 29: North America Market Value (US$ Million) Analysis by Country, 2017 to 2032

Figure 30: North America Market Volume (Tons) Analysis by Country, 2017 to 2032

Figure 31: North America Market Value Share (%) and BPS Analysis by Country, 2022 to 2032

Figure 32: North America Market Y-o-Y Growth (%) Projections by Country, 2022 to 2032

Figure 33: North America Market Value (US$ Million) Analysis by Coating Type, 2017 to 2032

Figure 34: North America Market Volume (Tons) Analysis by Coating Type, 2017 to 2032

Figure 35: North America Market Value Share (%) and BPS Analysis by Coating Type, 2022 to 2032

Figure 36: North America Market Y-o-Y Growth (%) Projections by Coating Type, 2022 to 2032

Figure 37: North America Market Value (US$ Million) Analysis by Surface Finish Type, 2017 to 2032

Figure 38: North America Market Volume (Tons) Analysis by Surface Finish Type, 2017 to 2032

Figure 39: North America Market Value Share (%) and BPS Analysis by Surface Finish Type, 2022 to 2032

Figure 40: North America Market Y-o-Y Growth (%) Projections by Surface Finish Type, 2022 to 2032

Figure 41: North America Market Value (US$ Million) Analysis by Application, 2017 to 2032

Figure 42: North America Market Volume (Tons) Analysis by Application, 2017 to 2032

Figure 43: North America Market Value Share (%) and BPS Analysis by Application, 2022 to 2032

Figure 44: North America Market Y-o-Y Growth (%) Projections by Application, 2022 to 2032

Figure 45: North America Market Attractiveness by Coating Type, 2022 to 2032

Figure 46: North America Market Attractiveness by Surface Finish Type, 2022 to 2032

Figure 47: North America Market Attractiveness by Application, 2022 to 2032

Figure 48: North America Market Attractiveness by Country, 2022 to 2032

Figure 49: Latin America Market Value (US$ Million) by Coating Type, 2022 to 2032

Figure 50: Latin America Market Value (US$ Million) by Surface Finish Type, 2022 to 2032

Figure 51: Latin America Market Value (US$ Million) by Application, 2022 to 2032

Figure 52: Latin America Market Value (US$ Million) by Country, 2022 to 2032

Figure 53: Latin America Market Value (US$ Million) Analysis by Country, 2017 to 2032

Figure 54: Latin America Market Volume (Tons) Analysis by Country, 2017 to 2032

Figure 55: Latin America Market Value Share (%) and BPS Analysis by Country, 2022 to 2032

Figure 56: Latin America Market Y-o-Y Growth (%) Projections by Country, 2022 to 2032

Figure 57: Latin America Market Value (US$ Million) Analysis by Coating Type, 2017 to 2032

Figure 58: Latin America Market Volume (Tons) Analysis by Coating Type, 2017 to 2032

Figure 59: Latin America Market Value Share (%) and BPS Analysis by Coating Type, 2022 to 2032

Figure 60: Latin America Market Y-o-Y Growth (%) Projections by Coating Type, 2022 to 2032

Figure 61: Latin America Market Value (US$ Million) Analysis by Surface Finish Type, 2017 to 2032

Figure 62: Latin America Market Volume (Tons) Analysis by Surface Finish Type, 2017 to 2032

Figure 63: Latin America Market Value Share (%) and BPS Analysis by Surface Finish Type, 2022 to 2032

Figure 64: Latin America Market Y-o-Y Growth (%) Projections by Surface Finish Type, 2022 to 2032

Figure 65: Latin America Market Value (US$ Million) Analysis by Application, 2017 to 2032

Figure 66: Latin America Market Volume (Tons) Analysis by Application, 2017 to 2032

Figure 67: Latin America Market Value Share (%) and BPS Analysis by Application, 2022 to 2032

Figure 68: Latin America Market Y-o-Y Growth (%) Projections by Application, 2022 to 2032

Figure 69: Latin America Market Attractiveness by Coating Type, 2022 to 2032

Figure 70: Latin America Market Attractiveness by Surface Finish Type, 2022 to 2032

Figure 71: Latin America Market Attractiveness by Application, 2022 to 2032

Figure 72: Latin America Market Attractiveness by Country, 2022 to 2032

Figure 73: Europe Market Value (US$ Million) by Coating Type, 2022 to 2032

Figure 74: Europe Market Value (US$ Million) by Surface Finish Type, 2022 to 2032

Figure 75: Europe Market Value (US$ Million) by Application, 2022 to 2032

Figure 76: Europe Market Value (US$ Million) by Country, 2022 to 2032

Figure 77: Europe Market Value (US$ Million) Analysis by Country, 2017 to 2032

Figure 78: Europe Market Volume (Tons) Analysis by Country, 2017 to 2032

Figure 79: Europe Market Value Share (%) and BPS Analysis by Country, 2022 to 2032

Figure 80: Europe Market Y-o-Y Growth (%) Projections by Country, 2022 to 2032

Figure 81: Europe Market Value (US$ Million) Analysis by Coating Type, 2017 to 2032

Figure 82: Europe Market Volume (Tons) Analysis by Coating Type, 2017 to 2032

Figure 83: Europe Market Value Share (%) and BPS Analysis by Coating Type, 2022 to 2032

Figure 84: Europe Market Y-o-Y Growth (%) Projections by Coating Type, 2022 to 2032

Figure 85: Europe Market Value (US$ Million) Analysis by Surface Finish Type, 2017 to 2032

Figure 86: Europe Market Volume (Tons) Analysis by Surface Finish Type, 2017 to 2032

Figure 87: Europe Market Value Share (%) and BPS Analysis by Surface Finish Type, 2022 to 2032

Figure 88: Europe Market Y-o-Y Growth (%) Projections by Surface Finish Type, 2022 to 2032

Figure 89: Europe Market Value (US$ Million) Analysis by Application, 2017 to 2032

Figure 90: Europe Market Volume (Tons) Analysis by Application, 2017 to 2032

Figure 91: Europe Market Value Share (%) and BPS Analysis by Application, 2022 to 2032

Figure 92: Europe Market Y-o-Y Growth (%) Projections by Application, 2022 to 2032

Figure 93: Europe Market Attractiveness by Coating Type, 2022 to 2032

Figure 94: Europe Market Attractiveness by Surface Finish Type, 2022 to 2032

Figure 95: Europe Market Attractiveness by Application, 2022 to 2032

Figure 96: Europe Market Attractiveness by Country, 2022 to 2032

Figure 97: Asia Pacific Market Value (US$ Million) by Coating Type, 2022 to 2032

Figure 98: Asia Pacific Market Value (US$ Million) by Surface Finish Type, 2022 to 2032

Figure 99: Asia Pacific Market Value (US$ Million) by Application, 2022 to 2032

Figure 100: Asia Pacific Market Value (US$ Million) by Country, 2022 to 2032

Figure 101: Asia Pacific Market Value (US$ Million) Analysis by Country, 2017 to 2032

Figure 102: Asia Pacific Market Volume (Tons) Analysis by Country, 2017 to 2032

Figure 103: Asia Pacific Market Value Share (%) and BPS Analysis by Country, 2022 to 2032

Figure 104: Asia Pacific Market Y-o-Y Growth (%) Projections by Country, 2022 to 2032

Figure 105: Asia Pacific Market Value (US$ Million) Analysis by Coating Type, 2017 to 2032

Figure 106: Asia Pacific Market Volume (Tons) Analysis by Coating Type, 2017 to 2032

Figure 107: Asia Pacific Market Value Share (%) and BPS Analysis by Coating Type, 2022 to 2032

Figure 108: Asia Pacific Market Y-o-Y Growth (%) Projections by Coating Type, 2022 to 2032

Figure 109: Asia Pacific Market Value (US$ Million) Analysis by Surface Finish Type, 2017 to 2032

Figure 110: Asia Pacific Market Volume (Tons) Analysis by Surface Finish Type, 2017 to 2032

Figure 111: Asia Pacific Market Value Share (%) and BPS Analysis by Surface Finish Type, 2022 to 2032

Figure 112: Asia Pacific Market Y-o-Y Growth (%) Projections by Surface Finish Type, 2022 to 2032

Figure 113: Asia Pacific Market Value (US$ Million) Analysis by Application, 2017 to 2032

Figure 114: Asia Pacific Market Volume (Tons) Analysis by Application, 2017 to 2032

Figure 115: Asia Pacific Market Value Share (%) and BPS Analysis by Application, 2022 to 2032

Figure 116: Asia Pacific Market Y-o-Y Growth (%) Projections by Application, 2022 to 2032

Figure 117: Asia Pacific Market Attractiveness by Coating Type, 2022 to 2032

Figure 118: Asia Pacific Market Attractiveness by Surface Finish Type, 2022 to 2032

Figure 119: Asia Pacific Market Attractiveness by Application, 2022 to 2032

Figure 120: Asia Pacific Market Attractiveness by Country, 2022 to 2032

Figure 121: Middle East and Africa Market Value (US$ Million) by Coating Type, 2022 to 2032

Figure 122: Middle East and Africa Market Value (US$ Million) by Surface Finish Type, 2022 to 2032

Figure 123: Middle East and Africa Market Value (US$ Million) by Application, 2022 to 2032

Figure 124: Middle East and Africa Market Value (US$ Million) by Country, 2022 to 2032

Figure 125: Middle East and Africa Market Value (US$ Million) Analysis by Country, 2017 to 2032

Figure 126: Middle East and Africa Market Volume (Tons) Analysis by Country, 2017 to 2032

Figure 127: Middle East and Africa Market Value Share (%) and BPS Analysis by Country, 2022 to 2032

Figure 128: Middle East and Africa Market Y-o-Y Growth (%) Projections by Country, 2022 to 2032

Figure 129: Middle East and Africa Market Value (US$ Million) Analysis by Coating Type, 2017 to 2032

Figure 130: Middle East and Africa Market Volume (Tons) Analysis by Coating Type, 2017 to 2032

Figure 131: Middle East and Africa Market Value Share (%) and BPS Analysis by Coating Type, 2022 to 2032

Figure 132: Middle East and Africa Market Y-o-Y Growth (%) Projections by Coating Type, 2022 to 2032

Figure 133: Middle East and Africa Market Value (US$ Million) Analysis by Surface Finish Type, 2017 to 2032

Figure 134: Middle East and Africa Market Volume (Tons) Analysis by Surface Finish Type, 2017 to 2032

Figure 135: Middle East and Africa Market Value Share (%) and BPS Analysis by Surface Finish Type, 2022 to 2032

Figure 136: Middle East and Africa Market Y-o-Y Growth (%) Projections by Surface Finish Type, 2022 to 2032

Figure 137: Middle East and Africa Market Value (US$ Million) Analysis by Application, 2017 to 2032

Figure 138: Middle East and Africa Market Volume (Tons) Analysis by Application, 2017 to 2032

Figure 139: Middle East and Africa Market Value Share (%) and BPS Analysis by Application, 2022 to 2032

Figure 140: Middle East and Africa Market Y-o-Y Growth (%) Projections by Application, 2022 to 2032

Figure 141: Middle East and Africa Market Attractiveness by Coating Type, 2022 to 2032

Figure 142: Middle East and Africa Market Attractiveness by Surface Finish Type, 2022 to 2032

Figure 143: Middle East and Africa Market Attractiveness by Application, 2022 to 2032

Figure 144: Middle East and Africa Market Attractiveness by Country, 2022 to 2032

Recommendations

Packaging

Parchment Paper Market

Published : April 2023

Packaging

Glassine Paper Market

Published : January 2023

Packaging

Recovered Paper Market

Published : November 2022

Explore Packaging Insights

View Reports