Zinc Oxide Sunscreens Market Size and Share Forecast Outlook 2025 to 2035

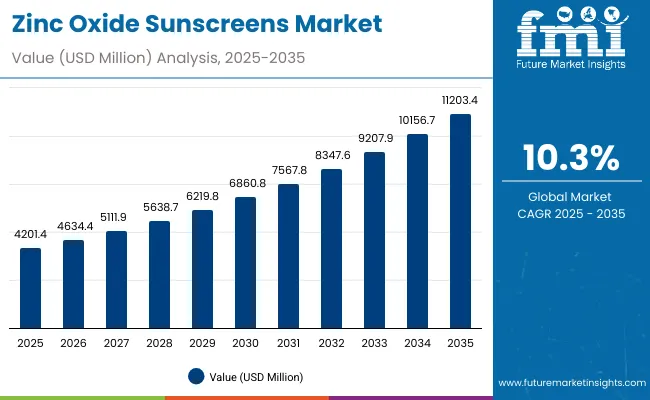
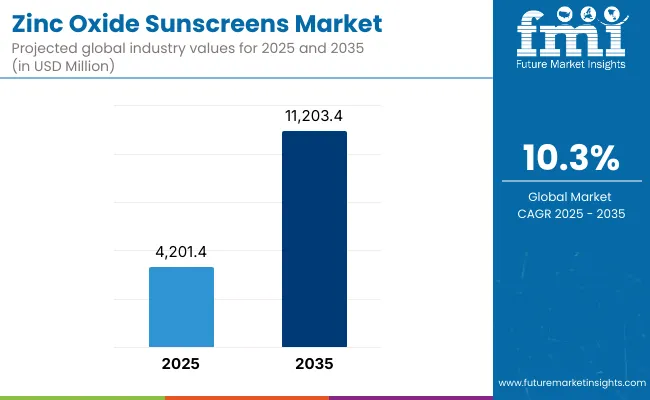
A global valuation of USD 4,201.4 Million is anticipated for the Zinc Oxide Sunscreens Market in 2025, which is projected to climb to USD 11,203.4 Million by 2035. This translates into an absolute expansion of nearly USD 7,002.0 Million over the decade, representing a 2.7X increase in market size. The growth reflects a CAGR of 10.3% during the assessment period, underscoring a robust trajectory supported by evolving consumer behavior, regulatory clarity, and dermatologist endorsements.
Zinc Oxide Sunscreens Market1

Quick Stats for Zinc Oxide Sunscreens Market

  • Zinc Oxide Sunscreens Market Value (2025): USD 4,201.4 Million
  • Zinc Oxide Sunscreens Market Forecast Value (2035): USD 11,203.4 Million
  • Zinc Oxide Sunscreens Market Forecast CAGR (2025 to 2035): 10.3%
  • Leading Segment in 2025: 100% mineral formulations (57.0%)
  • Key Growth Regions: North America, East Asia, South Asia & Pacific, Europe
  • Top Key Players in the Market: EltaMD, La Roche-Posay, Neutrogena, Supergoop!, Blue Lizard, CeraVe, Aveeno, Thinksport, Badger, Coola

Zinc Oxide Sunscreens Market

Zinc Oxide Sunscreens Market Key Takeaways

Metric Value
Zinc Oxide Sunscreens Market Estimated Value in (2025E) USD 4,201.4 million
Zinc Oxide Sunscreens Market Forecast Value in (2035F) USD 11,203.4 million
Forecast CAGR (2025 to 2035) 10.3%

Between 2025 and 2030, the market is expected to expand from USD 4,201.4 Mn to USD 6,860.8 Mn, generating additional revenue of USD 2,659.4 Mn. This phase will contribute 38% of total decade growth and will be characterized by increasing adoption of 100% mineral formulations, which already account for 57.0% of value in 2025. The demand during this period is expected to be reinforced by the dominance of lotions and creams, representing 52.0% of the market, as daily skincare integration strengthens their role in consumer routines. Non-nano zinc, with a 44.0% share, will continue to gain preference in pharmacy and derm-led channels, supported by sustainability and reef-safe claims.

The second half of the forecast, from 2030 to 2035, is projected to add USD 4,342.6 Mn, contributing 62% of the total growth. Stronger momentum is expected to be delivered by emerging economies such as China and India, with CAGR levels of 17.6% and 19.8% respectively. During this period, expansion of e-commerce, community retail, and cosmetic-integration formats will accelerate, reinforcing mineral sunscreens as a mainstream category within global sun protection.

From 2020 to 2024, mineral sunscreens gained wider clinical and consumer recognition, creating a favorable launchpad for 2025. By 2025, the market is estimated at USD 4,201.4 Mn, and is expected to reach USD 11,203.4 Mn by 2035, marking a 2.7X expansion. The first growth phase (2025–2030) will be anchored by strong adoption of 100% mineral formulations and daily-wear formats like lotions and creams, which collectively dominate segmental share.

Competitive dynamics are anticipated to evolve as specialist brands, such as EltaMD and Blue Lizard, consolidate trust in derm-led channels, while multiproduct players like Neutrogena and La Roche-Posay expand hybrid portfolios. Regional acceleration will be pronounced in China and India, where CAGR levels of 17.6% and 19.8% respectively outpace global averages, supported by e-commerce penetration and rising disposable incomes.

By 2035, innovation in sheer formulations, reef-safe claims, and e-commerce-driven personalization is expected to redefine brand loyalty. Competitive edge will rely less on product breadth alone and more on scientific substantiation, digital engagement, and recurring consumption models, ensuring sustained leadership in the global sun protection landscape.

Why the Zinc Oxide Sunscreens Market is growing?

The growth of the Zinc Oxide Sunscreens Market is being propelled by rising awareness of skin health, increasing preference for clean-label formulations, and growing regulatory scrutiny over chemical UV filters. Adoption has been supported by dermatologist recommendations, with zinc oxide being positioned as a safe, broad-spectrum, and reef-friendly alternative. Demand has been reinforced by consumer concerns over allergies and sensitivity, which has elevated the role of mineral-only formulations that already command the majority share.

Expansion is further being driven by the appeal of non-nano variants, which are anticipated to gain traction as environmental organizations and retailers emphasize reef-safe compliance. Digital commerce and dermatology channels have amplified accessibility, with personalized routines and product bundling expected to strengthen usage frequency. Rapid growth across emerging economies, particularly China and India, is accelerating market penetration, supported by rising disposable incomes and expanding urban skincare adoption. With product innovation in sheer and tinted formulations addressing cosmetic integration needs, zinc oxide sunscreens are expected to shift from niche use toward mainstream daily skincare, thereby sustaining long-term growth.

Segmental Analysis

The Zinc Oxide Sunscreens Market has been segmented across key parameters to provide clarity on evolving consumer preferences and innovation pathways. Formulation choices have shaped the market, with mineral-only variants capturing a dominant position as trust in safer and eco-friendly compositions has strengthened. Zinc type has emerged as a decisive factor, as demand has been influenced by environmental regulations and consumer awareness of ingredient safety. Formats such as lotions and creams have remained at the forefront due to their compatibility with daily routines, while newer formats are expected to expand penetration through convenience and aesthetic integration. Collectively, these segments highlight how performance, safety, and usability are driving long-term adoption patterns.
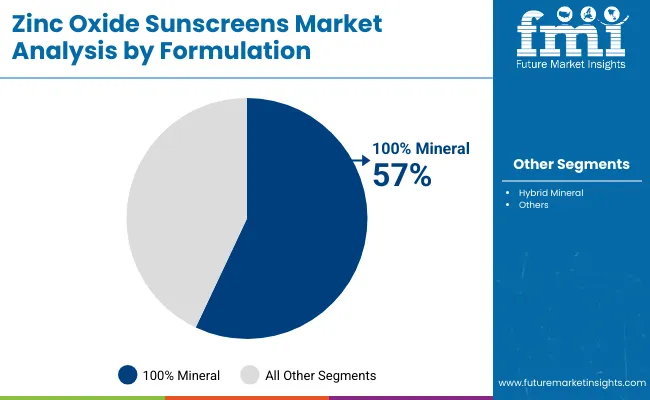
Insights into the Formulation Segment with 100% Mineral Leading in Market Share

Zinc Oxide Sunscreens Market By Formulation

Segment Market Value Share, 2025
100% mineral 57%
Others 43.0%

The 100% mineral segment is anticipated to hold 57.0% of the market share in 2025, equivalent to USD 2,394.80 Million. Growth has been fueled by increasing awareness of safety concerns linked to chemical filters and rising demand for reef-safe and pediatric-friendly solutions. Dermatologist endorsements and regulatory approvals are expected to strengthen credibility, making this segment the preferred choice among health-conscious consumers. Hybrid formulations may continue to serve niche aesthetics-driven demand, yet clear safety positioning is expected to allow 100% mineral sunscreens to retain dominance.
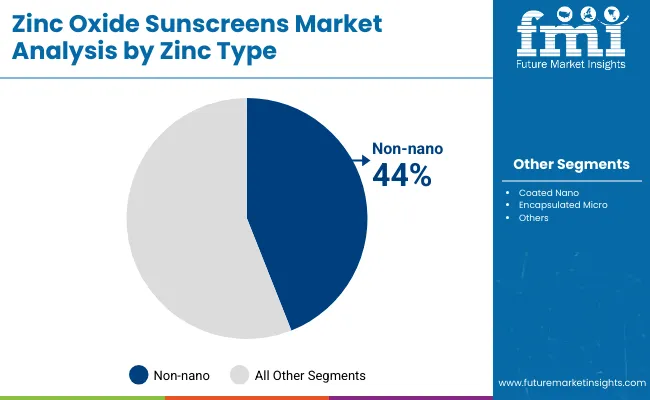
Insights into the Zinc Type Segment with Non-Nano Driving Preference

Zinc Oxide Sunscreens Market By Zinc Type

Segment Market Value Share, 2025
Non-nano 44%
Others 56.0%

Non-nano zinc is expected to command 44.0% of market share in 2025, representing USD 1,848.62 Million. Growth in this segment is being driven by rising environmental advocacy and retailer policies mandating reef-safe compliance. Non-nano products have been perceived as safer alternatives, which has reinforced adoption in pharmacies and premium retail channels. Although texture and spreadability challenges remain, formulation innovation is projected to enhance user experience, supporting broader appeal. The continued shift toward transparency in labeling is expected to strengthen the trajectory of non-nano zinc sunscreens across global markets.
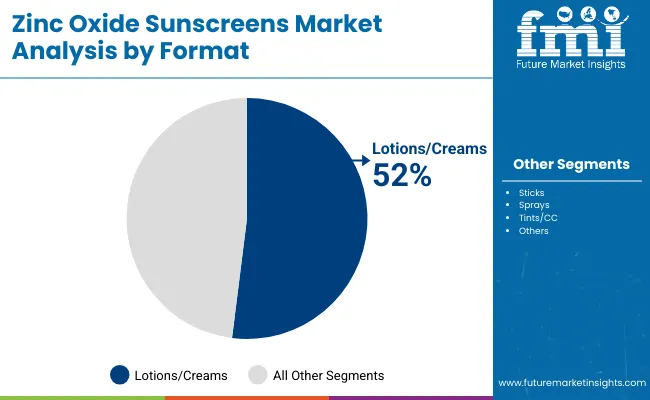
Insights into the Format Segment with Lotions and Creams Remaining Dominant

Zinc Oxide Sunscreens Market By Format

Segment Market Value Share, 2025
Lotions/creams 52%
Others 48.0%

Lotions and creams are projected to secure 52.0% of the market share in 2025, valued at USD 2,184.73 Million. This dominance is underpinned by their compatibility with everyday skincare routines and dermatologist recommendations. Their ability to integrate into morning and makeup regimens is expected to keep them as the preferred choice for broad-spectrum protection. While sprays, sticks, and tinted formats are likely to grow faster due to convenience and cosmetic appeal, lotions and creams will continue to capture mainstream adoption. Consumer loyalty, reinforced by familiarity and ease of application, is projected to maintain their leadership over the decade.

What are the Drivers, Restraints, and Key Trends of the Zinc Oxide Sunscreens Market?

Adoption of zinc oxide sunscreens is influenced by evolving consumer safety perceptions and environmental priorities, even as challenges in formulation aesthetics and cost dynamics restrict broader penetration across diverse retail and clinical channels.

Regulatory Alignment with Reef-Safe Standards

Growing alignment of global regulatory frameworks with reef-safe and mineral-only labeling has been reshaping sunscreen portfolios. Regulatory bodies in North America, Europe, and Asia have increasingly scrutinized chemical UV filters for their ecological and dermatological impact. As this shift continues, zinc oxide is being positioned as one of the few universally recognized safe filters. Compliance with these evolving mandates has not only reduced risk for manufacturers but also created an opportunity to command premium pricing. Dermatologist endorsements and NGO-backed certifications are expected to enhance consumer trust, accelerating adoption across both mass and premium categories.

Formulation Challenges with Non-Nano Variants

Despite safety benefits, non-nano zinc formulations have encountered significant hurdles in texture and cosmetic elegance. Their tendency to leave a white cast has limited acceptance in darker skin tones and cosmetic layering applications. Manufacturers are facing cost implications as they invest in advanced dispersion technologies and hybrid delivery systems to address these limitations. Without breakthrough innovation in sensorial performance, broader demographic adoption may remain constrained. Retailers are also increasingly selective, prioritizing products that balance compliance with aesthetics. This dual pressure has raised barriers to scaling non-nano zinc variants in cost-sensitive markets, restraining the pace of growth in what is otherwise a high-potential segment.
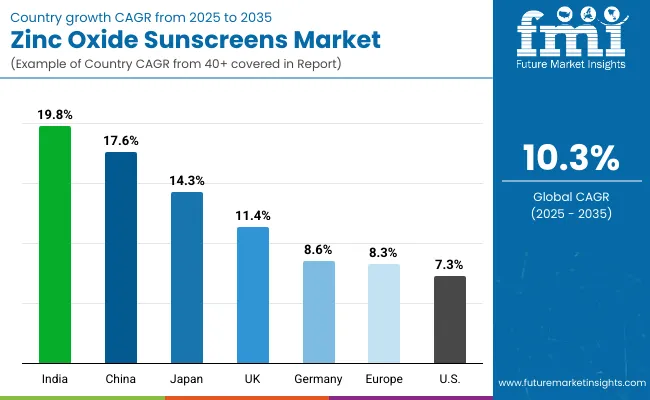
Analysis Of Zinc Oxide Sunscreens Market By Key Countries

Country Wise Zinc Oxide Sunscreens Market

Country CAGR
China 17.6%
USA 7.3%
India 19.8%
UK 11.4%
Germany 8.6%
Japan 14.3%

The global Zinc Oxide Sunscreens Market reflects diverse country-level growth trajectories, influenced by regulatory frameworks, consumer awareness, and dermatological adoption. The most dynamic momentum is expected in Asia, where India (19.8% CAGR) and China (17.6% CAGR) are projected to lead. Expansion in these markets will be powered by heightened awareness of UV damage, rapid digital retail penetration, and increasing adoption of mineral-only sun protection in urban centers. India’s trajectory will be reinforced by affordability-driven mass retail strategies, while China’s growth will be accelerated by e-commerce ecosystems and premium dermocosmetic demand.

Japan, with a forecast CAGR of 14.3%, is anticipated to capitalize on its strong cosmetics industry and innovation in sheer, tinted formulations tailored for daily skincare regimens. In Europe, moderate but steady growth is expected, with Germany at 8.6% and the UK at 11.4%, supported by strict compliance standards, environmentally conscious consumers, and preference for reef-safe products. Broader Europe is projected at 8.3%, signaling consistent replacement of chemical filters by mineral-based alternatives.

The USA market, at a CAGR of 7.3%, is expected to expand more gradually due to its maturity but will benefit from strong dermatologist endorsements and increasing pediatric use. Overall, regional diversity highlights how consumer education, retail models, and regulatory alignment are shaping adoption globally.
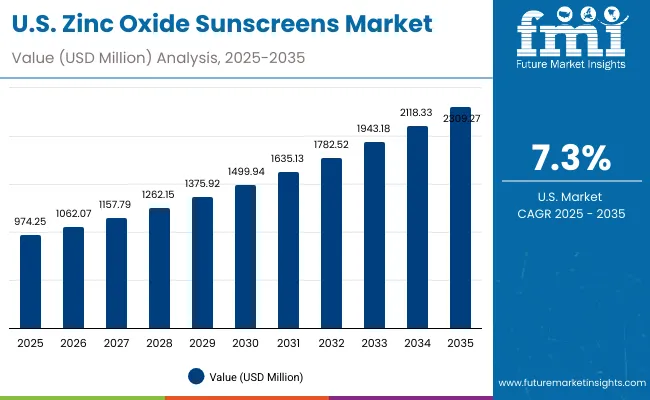
Sales Outlook for Zinc Oxide Sunscreens in the United States

Usa Zinc Oxide Sunscreens Market

Year USA Zinc Oxide Sunscreens Market (USD Million)
2025 974.25
2026 1062.07
2027 1157.79
2028 1262.15
2029 1375.92
2030 1499.94
2031 1635.13
2032 1782.52
2033 1943.18
2034 2118.33
2035 2309.27

The Zinc Oxide Sunscreens Market in the United States is projected to grow at a CAGR of 7.3% from 2025 to 2035, expanding from USD 974.25 Million in 2025 to USD 2309.27 Million by 2035. Growth is expected to be supported by clinical endorsements and increasing consumer awareness of mineral formulations. Dermatologist-led education has reinforced adoption, particularly among pediatric and sensitive-skin users.

Expansion is anticipated to be reinforced by the dominance of 100% mineral formulations, which already hold a significant share of the USA market. Consumer demand is being accelerated by heightened concerns over reef safety, allergen-free protection, and the replacement of chemical UV filters. Expanding penetration across e-commerce and derm-clinic channels is projected to drive accessibility, while the mass retail sector is expected to consolidate demand for affordable mineral-only offerings.

  • Pediatric and sensitive-skin claims are anticipated to sustain premiumization in the USA market.
  • Digital retail and dermatology clinics are forecasted to accelerate volume growth, supported by rising subscription-based sunscreen routines.
  • Long-term opportunities are expected to stem from innovation in sheer formulations that improve cosmetic compatibility for diverse skin tones.

Growth and Expansion Outlook for Zinc Oxide Sunscreens Market in the United Kingdom

A CAGR of 11.4% is expected for the UK Zinc Oxide Sunscreens Market through 2035. Growth is anticipated to be supported by dermatology-led education, retailer stewardship on reef-safe shelves, and high daily-wear compliance driven by fair-skin photoprotection norms. Premium mineral-only lines are projected to remain prominent as clinical credibility and cosmetic elegance improve. E-commerce and pharmacy partnerships are expected to streamline replenishment, while refill and subscription models should enhance repeat purchase behavior. Regulatory alignment with EU-style ingredient scrutiny is likely to favor transparent labeling and evidence-backed claims.

  • Retail ranging is expected to prioritize non-nano proof points and pediatric assurances.
  • Hybrid tint formats are projected to lift cosmetic-integration usage in urban routines.
  • Private-label mineral propositions are anticipated to pressure entry-level price points.
  • Dermatology clinic recommendation programs are expected to fortify brand switching barriers.

Growth and Expansion Outlook for Zinc Oxide Sunscreens Market in India

A CAGR of 19.8% is projected for India, positioning the country as the fastest-growing major market. Expansion is expected to be propelled by hot-climate photoprotection needs, widening dermatology access, and rapid digital commerce adoption. Affordability-led packs and localized shade/tint ranges are likely to unlock mass adoption beyond metros. Pharmacy and modern trade are expected to professionalize assortments, while influencer dermatology is anticipated to normalize daily reapplication behavior. Compliance-led messaging around school-going children and outdoor workers is projected to raise household ownership of multiple formats.

  • Value packs and sachet strategies are expected to expand penetration in tier-2/3 cities.
  • Pediatric and sensitive-skin claims are projected to anchor premiumization corridors.
  • Local manufacturing scale is anticipated to stabilize zinc-oxide grade costs.
  • Vernacular education and social commerce are expected to accelerate first-time trials.

Sales Outlook for Zinc Oxide Sunscreens in China

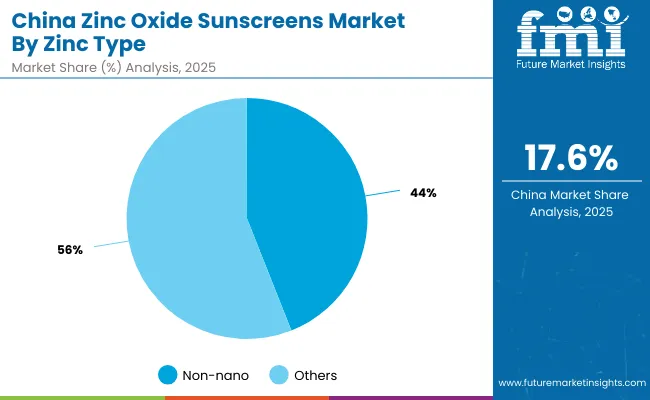
A CAGR of 17.6% is anticipated for China, with the market estimated at ~USD 497.95 Million in 2025 and characterized by a 44%/56% non-nano/other zinc-type split. Growth is expected to be underpinned by sophisticated dermocosmetic demand, KOL-driven content commerce, and rapid adoption of sheer, makeup-compatible mineral bases. Cross-border and domestic prestige brands are projected to scale through marketplace festivals and dermatologist co-creation. Regulatory attention to ingredient transparency is likely to sustain mineral credibility and reduce volatility in consumer trust.

  • Live-commerce bundles are expected to raise reapplication frequency and basket size.
  • SPF/PA co-claims with blue-light and pollution defense are projected to lift ASPs.
  • OMillioni-channel dermatology partnerships are anticipated to speed clinical trial visibility.
  • Non-nano messaging is expected to gain shelf impact in premium pharmacy chains.

In-depth Analysis of Zinc Oxide Sunscreens in Germany

Europe Zinc Oxide Sunscreens Market]

Country 2025
USA 23.2%
China 11.9%
Japan 6.9%
Germany 15.3%
UK 8.0%
India 4.8%
Country 2035
USA 20.6%
China 12.8%
Japan 8.3%
Germany 13.3%
UK 7.2%
India 5.9%

A CAGR of 8.6% is forecast for Germany, reflecting disciplined growth in a safety- and compliance-centric market. Retailers are expected to enforce stringent substantiation for reef-safe and hypoallergenic claims, favoring mineral-only portfolios. Pharmacy dominance is projected to persist, while drugstore chains are likely to broaden access with derm-endorsed private labels. Texture advances that minimize white cast are anticipated to widen user inclusivity and sustain year-round use, not just holiday purchase peaks.
  • Evidence-backed labeling and TÜV/dermatest marks are expected to shape shelf velocity.
  • Family-size and sport/outdoor SKUs are projected to stabilize seasonal demand swings.
  • Local sustainability preferences are anticipated to reward recyclable and refill formats.
  • Employee-wellness programs and workplace UV policies are expected to spur institutional buys.

Growth Outlook for Zinc Oxide Sunscreens Market in USA

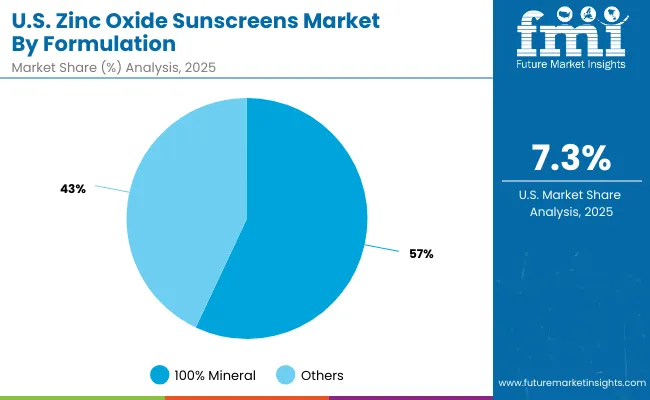
Us Zinc Oxide Sunscreens Market

Segment Market Value Share, 2025
mineral 57%
Others 43%

The USA Zinc Oxide Sunscreens Market is projected at USD 974.25 Million in 2025. Within this, 100% mineral formulations contribute 57.0%, equal to USD 555.32 Million, while other formulations account for 43.0%, or USD 418.93 Million. This dominance of mineral-only variants signals a clear consumer preference for dermatologist-backed, reef-safe, and sensitive-skin-compatible solutions. Growing concerns about chemical UV filters and stricter environmental scrutiny have reinforced the shift toward mineral formats, making them the foundation of long-term category growth.

This segment’s leadership is expected to be supported by pediatric-focused marketing and clinical endorsements that underline hypoallergenic benefits. Meanwhile, hybrid formulations will continue to serve consumers seeking enhanced cosmetic appeal but are unlikely to displace the trust commanded by pure zinc oxide bases. The market landscape will increasingly reward brands offering evidence-backed claims and improved cosmetic elegance, particularly in daily-wear and family-use products.
  • The USA Zinc Oxide Sunscreens Market is valued at USD 974.25 Million in 2025.
  • 100% mineral formulations dominate at 57.0% share (USD 555.32 Million).
  • Others retain a 43.0% share (USD 418.93 Million), reflecting niche demand for aesthetic hybrids.
  • Growth is expected to be driven by reef-safe claims, sensitive-skin protection, and pediatric adoption.

Opportunity Analysis of China Zinc Oxide Sunscreens Market

China Zinc Oxide Sunscreens Market

Segment Market Value Share, 2025
Non-nano 44%
Others 56%

The Zinc Oxide Sunscreens Market in China is projected at USD 498.0 Million in 2025. Within this, non-nano zinc accounts for 44.0% (USD 219.10 Million), while other zinc types contribute 56.0% (USD 278.85 Million). This balanced split highlights how both performance and aesthetics are shaping consumer preference. While non-nano formulations are increasingly favored for their reef-safe positioning and NGO-backed endorsements, smoother application and superior cosmetic integration continue to support other zinc variants.

The competitive dynamic in China is expected to be strongly influenced by digital retail ecosystems and KOL-driven education, which are normalizing daily sunscreen use. Cross-border and domestic dermocosmetic brands are anticipated to leverage festivals and live-commerce events to scale both premium and mass-market offerings. Regulatory oversight emphasizing ingredient transparency is expected to reinforce consumer trust, making non-nano labeling an increasingly powerful differentiator.
  • China Zinc Oxide Sunscreens Market is valued at USD 498.0 Million in 2025.
  • Non-nano zinc captures 44.0% share (USD 219.10 Million), reflecting reef-safe demand.
  • Other zinc types retain 56.0% share (USD 278.85 Million), driven by superior aesthetics.
  • E-commerce, KOL advocacy, and ingredient transparency are expected to shape adoption.

Competitive Landscape of Zinc Oxide Sunscreens Market

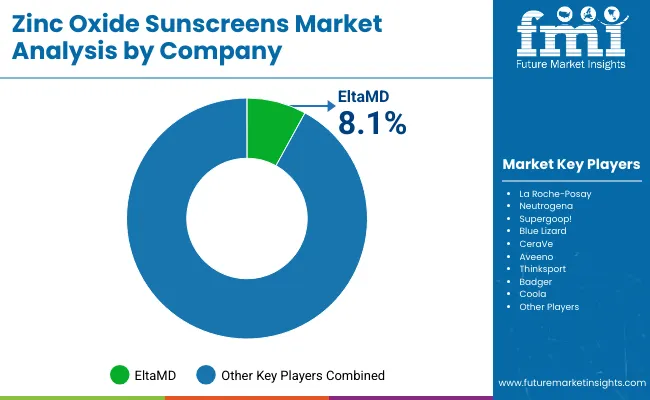
Zinc Oxide Sunscreens Market By Company

Company Global Value Share 2025
EltaMD 8.1%
Others 91.9%

The Zinc Oxide Sunscreens Market is moderately fragmented, with specialist dermatology-backed leaders, multiproduct skincare giants, and niche natural brands competing across a wide spectrum of consumer needs. The leading player, EltaMD, is estimated to hold a global value share of 8.1% in 2025, positioning it as the dominant brand within this category. Its leadership has been reinforced by dermatologist endorsements, strong penetration in professional clinic channels, and consistent product validation around sensitive-skin and pediatric usage.

Other major brands such as La Roche-Posay, Neutrogena, Supergoop!, Blue Lizard, CeraVe, Aveeno, Thinksport, Badger, and Coola form the broader competitive set. These players, although individually smaller in share, collectively contribute to the remaining 91.9% of the market. Their strategies are expected to center on cosmetic elegance, digital-first marketing, and expansion through e-commerce platforms.

Niche specialists like Thinksport and Badger are carving loyalty among eco-conscious and reef-safe consumers, while global skincare houses such as Neutrogena and La Roche-Posay leverage extensive distribution networks to compete across both premium and mass-market price bands. Competitive differentiation is expected to shift toward integrated dermatology partnerships, transparent reef-safe labeling, and personalization-driven digital commerce models.

Key Developments in Zinc Oxide Sunscreens Market

  • On March 12, 2025, Augustinus Bader launched its first non-nano mineral sunscreen, formulated with zinc oxide and titanium dioxide. The SPF 50 innovation was positioned as both skincare and sun protection, highlighting TFC8 technology for skin renewal. The launch was viewed as a premium benchmark for mineral-only sunscreens.
  • On June 3, 2025, the SAFE Sunscreen Standards Act was introduced in the United States Congress. The proposal aimed to modernize sunscreen regulation by allowing real-world data to support ingredient approval. This initiative was expected to accelerate adoption of zinc oxide formulations, especially non-nano, by reducing chemical filter dependency.

Scope of the Report

Item Value
Quantitative Units USD 4,201.4 Million (2025); USD 11,203.4 Million (2035); CAGR 2025 to 2035: 10.3%
Formulation (Component-equivalent) 100% mineral, Hybrid/other mineral blends
Zinc Type Non-nano, Other zinc grades (incl. coated nano/encapsulated micro where applicable)
Format (Type-equivalent) Lotions/creams, Sticks, Sprays, Tints/CC, Others
Key Claims/Use-Cases (End-use-equivalent) Pediatric/sensitive-skin routines, Broad-spectrum daily wear, Outdoor/athletic protection, Reef-safe positioning, Dermatology-recommended care
Channels Pharmacies/drugstores, E-commerce, Mass retail, Dermatology clinics
Regions Covered North America; Europe; East Asia; South Asia & Pacific; Latin America; Middle East & Africa
Countries Covered United States; China; India; United Kingdom; Germany; Japan
Leading 2025 Segment Indicators 100% mineral: 57.0% (USD 2,394.80 Million); Non-nano zinc: 44.0% (USD 1,848.62 Million); Lotions/creams: 52.0% (USD 2,184.73 Million)
Market Concentration Top brand (EltaMD): 8.1% global value share (2025); Others combined: 91.9%
Key Companies Profiled EltaMD; La Roche-Posay; Neutrogena; Supergoop!; Blue Lizard; CeraVe; Aveeno; Thinksport; Badger; Coola
Regulatory & Quality Notes Reef-safe and labeling scrutiny expected to intensify; dermatologist endorsements and transparent safety dossiers projected to shape listings
Additional Attributes Mineral-only premiumization; texture/whitening minimization R&D; subscription and refill models via e-commerce; growing non-nano shelf space; pediatric and daily-wear adoption; cost management for zinc-oxide grades; evidence-backed claims and clinical testing emphasized

Key Segments

By Function:

  • UV protection (broad spectrum)
  • Blue light protection
  • Sensitive skin formulations
  • Mineral-based daily wear

By Product Type:

  • Sun creams
  • Daily moisturizers with SPF
  • Tinted sunscreens
  • Baby/kids sunscreens

By Channel:

  • Pharmacies
  • E-commerce
  • Mass retail
  • Specialty beauty retail

By Claim:

  • Reef-safe
  • Natural/organic
  • Fragrance-free
  • Dermatologist-tested

By Region:

  • North America
  • Latin America
  • Europe
  • East Asia
  • South Asia & Pacific
  • Middle East and Africa

Table of Content

  1. Executive Summary
    • Global Market Outlook
    • Demand-side Trends
    • Supply-side Trends
    • Technology Roadmap Analysis
    • Analysis and Recommendations
  2. Market Overview
    • Market Coverage / Taxonomy
    • Market Definition / Scope / Limitations
  3. Market Background
    • Market Dynamics
      • Drivers
      • Restraints
      • Opportunity
      • Trends
    • Scenario Forecast
      • Demand in Optimistic Scenario
      • Demand in Likely Scenario
      • Demand in Conservative Scenario
    • Opportunity Map Analysis
    • Product Life Cycle Analysis
    • Supply Chain Analysis
    • Investment Feasibility Matrix
    • Value Chain Analysis
    • PESTLE and Porter’s Analysis
    • Regulatory Landscape
    • Regional Parent Market Outlook
    • Production and Consumption Statistics
    • Import and Export Statistics
  4. Global Analysis 2020 to 2024 and Forecast, 2025 to 2035
    • Historical Market Size Value (USD Million) Analysis, 2020 to 2024
    • Current and Future Market Size Value (USD Million) Projections, 2025 to 2035
      • Y-o-Y Growth Trend Analysis
      • Absolute $ Opportunity Analysis
  5. Global Pricing Analysis 2020 to 2024 and Forecast 2025 to 2035
  6. Global Analysis 2020 to 2024 and Forecast 2025 to 2035, By Grade
    • Introduction / Key Findings
    • Historical Market Size Value (USD Million) Analysis By Grade, 2020 to 2024
    • Current and Future Market Size Value (USD Million) Analysis and Forecast By Grade, 2025 to 2035
      • Non-nano zinc oxide
      • Nano zinc oxide
      • Surface-treated zinc oxide
      • Encapsulated zinc oxide
    • Y-o-Y Growth Trend Analysis By Grade, 2020 to 2024
    • Absolute $ Opportunity Analysis By Grade, 2025 to 2035
  7. Global Analysis 2020 to 2024 and Forecast 2025 to 2035, By Function
    • Introduction / Key Findings
    • Historical Market Size Value (USD Million) Analysis By Function, 2020 to 2024
    • Current and Future Market Size Value (USD Million) Analysis and Forecast By Function, 2025 to 2035
      • UV protection (broad spectrum)
      • Blue light protection
      • Sensitive skin formulations
      • Mineral-based daily wear
    • Y-o-Y Growth Trend Analysis By Function, 2020 to 2024
    • Absolute $ Opportunity Analysis By Function, 2025 to 2035
  8. Global Analysis 2020 to 2024 and Forecast 2025 to 2035, By Product Type
    • Introduction / Key Findings
    • Historical Market Size Value (USD Million) Analysis By Product Type, 2020 to 2024
    • Current and Future Market Size Value (USD Million) Analysis and Forecast By Product Type, 2025 to 2035
      • Sun creams
      • Daily moisturizers with SPF
      • Tinted sunscreens
      • Baby/kids sunscreens
    • Y-o-Y Growth Trend Analysis By Product Type, 2020 to 2024
    • Absolute $ Opportunity Analysis By Product Type, 2025 to 2035
  9. Global Analysis 2020 to 2024 and Forecast 2025 to 2035, By Channel
    • Introduction / Key Findings
    • Historical Market Size Value (USD Million) Analysis By Channel, 2020 to 2024
    • Current and Future Market Size Value (USD Million) Analysis and Forecast By Channel, 2025 to 2035
      • Pharmacies
      • E-commerce
      • Mass retail
      • Specialty beauty retail
    • Y-o-Y Growth Trend Analysis By Channel, 2020 to 2024
    • Absolute $ Opportunity Analysis By Channel, 2025 to 2035
  10. Global Analysis 2020 to 2024 and Forecast 2025 to 2035, By Claim
    • Introduction / Key Findings
    • Historical Market Size Value (USD Million) Analysis By Claim, 2020 to 2024
    • Current and Future Market Size Value (USD Million) Analysis and Forecast By Claim, 2025 to 2035
      • Reef-safe
      • Natural/organic
      • Fragrance-free
      • Dermatologist-tested
    • Y-o-Y Growth Trend Analysis By Claim, 2020 to 2024
    • Absolute $ Opportunity Analysis By Claim, 2025 to 2035
  11. Global Analysis 2020 to 2024 and Forecast 2025 to 2035, By Region
    • Introduction
    • Historical Market Size Value (USD Million) Analysis By Region, 2020 to 2024
    • Current Market Size Value (USD Million) Analysis and Forecast By Region, 2025 to 2035
      • North America
      • Latin America
      • Europe
      • East Asia
      • South Asia & Pacific
      • Middle East and Africa
    • Market Attractiveness Analysis By Region
  12. North America Analysis 2020 to 2024 and Forecast 2025 to 2035, By Country
    • Historical Market Size Value (USD Million) Trend Analysis By Market Taxonomy, 2020 to 2024
    • Market Size Value (USD Million) Forecast By Market Taxonomy, 2025 to 2035
      • By Country
        • U.S.
        • Canada
      • By Grade
      • By Function
      • By Product Type
      • By Channel
      • By Claim
    • Market Attractiveness Analysis
      • By Country
      • By Grade
      • By Function
      • By Product Type
      • By Channel
      • By Claim
    • Key Takeaways
  13. Latin America Analysis 2020 to 2024 and Forecast 2025 to 2035, By Country
    • Historical Market Size Value (USD Million) Trend Analysis By Market Taxonomy, 2020 to 2024
    • Market Size Value (USD Million) Forecast By Market Taxonomy, 2025 to 2035
      • By Country
        • Brazil
        • Mexico
        • Colombia
        • Rest of Latin America
      • By Grade
      • By Function
      • By Product Type
      • By Channel
      • By Claim
    • Market Attractiveness Analysis
      • By Country
      • By Grade
      • By Function
      • By Product Type
      • By Channel
      • By Claim
    • Key Takeaways
  14. Europe Analysis 2020 to 2024 and Forecast 2025 to 2035, By Country
    • Historical Market Size Value (USD Million) Trend Analysis By Market Taxonomy, 2020 to 2024
    • Market Size Value (USD Million) Forecast By Market Taxonomy, 2025 to 2035
      • By Country
        • Germany
        • U.K.
        • France
        • Italy
        • Spain
        • Belgium
        • Netherlands
        • Nordic
        • Switzerland
        • Russia
        • Poland
        • Rest of Europe
      • By Grade
      • By Function
      • By Product Type
      • By Channel
      • By Claim
    • Market Attractiveness Analysis
      • By Country
      • By Grade
      • By Function
      • By Product Type
      • By Channel
      • By Claim
    • Key Takeaways
  15. East Asia Analysis 2020 to 2024 and Forecast 2025 to 2035, By Country
    • Historical Market Size Value (USD Million) Trend Analysis By Market Taxonomy, 2020 to 2024
    • Market Size Value (USD Million) Forecast By Market Taxonomy, 2025 to 2035
      • By Country
        • China
        • Japan
        • South Korea
      • By Grade
      • By Function
      • By Product Type
      • By Channel
      • By Claim
    • Market Attractiveness Analysis
      • By Country
      • By Grade
      • By Function
      • By Product Type
      • By Channel
      • By Claim
    • Key Takeaways
  16. South Asia & Pacific Analysis 2020 to 2024 and Forecast 2025 to 2035, By Country
    • Historical Market Size Value (USD Million) Trend Analysis By Market Taxonomy, 2020 to 2024
    • Market Size Value (USD Million) Forecast By Market Taxonomy, 2025 to 2035
      • By Country
        • India
        • Thailand
        • Malaysia
        • Indonesia
        • Singapore
        • Vietnam
        • Australia
        • New Zealand
        • Rest of South Asia
      • By Grade
      • By Function
      • By Product Type
      • By Channel
      • By Claim
    • Market Attractiveness Analysis
      • By Country
      • By Grade
      • By Function
      • By Product Type
      • By Channel
      • By Claim
    • Key Takeaways
  17. Middle East and Africa Analysis 2020 to 2024 and Forecast 2025 to 2035, By Country
    • Historical Market Size Value (USD Million) Trend Analysis By Market Taxonomy, 2020 to 2024
    • Market Size Value (USD Million) Forecast By Market Taxonomy, 2025 to 2035
      • By Country
        • Turkey
        • UAE
        • Saudi Arabia
        • Israel
        • Other GCC Countries
        • North Africa
        • South Africa
      • By Grade
      • By Function
      • By Product Type
      • By Channel
      • By Claim
    • Market Attractiveness Analysis
      • By Country
      • By Grade
      • By Function
      • By Product Type
      • By Channel
      • By Claim
    • Key Takeaways
  18. Key Countries Analysis
    • U.S.
      • Pricing Analysis
      • Market Share Analysis, 2024
        • By Grade
        • By Function
        • By Product Type
        • By Channel
        • By Claim
    • Canada
      • Pricing Analysis
      • Market Share Analysis, 2024
        • By Grade
        • By Function
        • By Product Type
        • By Channel
        • By Claim
    • Mexico
      • Pricing Analysis
      • Market Share Analysis, 2024
        • By Grade
        • By Function
        • By Product Type
        • By Channel
        • By Claim
    • Brazil
      • Pricing Analysis
      • Market Share Analysis, 2024
        • By Grade
        • By Function
        • By Product Type
        • By Channel
        • By Claim
    • Germany
      • Pricing Analysis
      • Market Share Analysis, 2024
        • By Grade
        • By Function
        • By Product Type
        • By Channel
        • By Claim
    • U.K.
      • Pricing Analysis
      • Market Share Analysis, 2024
        • By Grade
        • By Function
        • By Product Type
        • By Channel
        • By Claim
    • Italy
      • Pricing Analysis
      • Market Share Analysis, 2024
        • By Grade
        • By Function
        • By Product Type
        • By Channel
        • By Claim
    • Spain
      • Pricing Analysis
      • Market Share Analysis, 2024
        • By Grade
        • By Function
        • By Product Type
        • By Channel
        • By Claim
    • France
      • Pricing Analysis
      • Market Share Analysis, 2024
        • By Grade
        • By Function
        • By Product Type
        • By Channel
        • By Claim
    • India
      • Pricing Analysis
      • Market Share Analysis, 2024
        • By Grade
        • By Function
        • By Product Type
        • By Channel
        • By Claim
    • Australia & New Zealand
      • Pricing Analysis
      • Market Share Analysis, 2024
        • By Grade
        • By Function
        • By Product Type
        • By Channel
        • By Claim
    • China
      • Pricing Analysis
      • Market Share Analysis, 2024
        • By Grade
        • By Function
        • By Product Type
        • By Channel
        • By Claim
    • Japan
      • Pricing Analysis
      • Market Share Analysis, 2024
        • By Grade
        • By Function
        • By Product Type
        • By Channel
        • By Claim
    • South Korea
      • Pricing Analysis
      • Market Share Analysis, 2024
        • By Grade
        • By Function
        • By Product Type
        • By Channel
        • By Claim
    • Russia
      • Pricing Analysis
      • Market Share Analysis, 2024
        • By Grade
        • By Function
        • By Product Type
        • By Channel
        • By Claim
    • Poland
      • Pricing Analysis
      • Market Share Analysis, 2024
        • By Grade
        • By Function
        • By Product Type
        • By Channel
        • By Claim
    • Hungary
      • Pricing Analysis
      • Market Share Analysis, 2024
        • By Grade
        • By Function
        • By Product Type
        • By Channel
        • By Claim
    • Kingdom of Saudi Arabia
      • Pricing Analysis
      • Market Share Analysis, 2024
        • By Grade
        • By Function
        • By Product Type
        • By Channel
        • By Claim
    • South Africa
      • Pricing Analysis
      • Market Share Analysis, 2024
        • By Grade
        • By Function
        • By Product Type
        • By Channel
        • By Claim
  19. Market Structure Analysis
    • Competition Dashboard
    • Competition Benchmarking
    • Market Share Analysis of Top Players
      • By Regional
      • By Grade
      • By Function
      • By Product Type
      • By Channel
      • By Claim
  20. Competition Analysis
    • Competition Deep Dive
      • BASF
        • Overview
        • Product Portfolio
        • Profitability by Market Segments (Product/Age /Sales Channel/Region)
        • Sales Footprint
        • Strategy Overview
        • Croda
        • DSM-Firmenich
        • Symrise
        • Evonik
        • Kobo Products
        • Unilever
        • L’Oréal
        • Johnson & Johnson
        • Neutrogena
    • Assumptions & Acronyms Used
    • Research Methodology

List of Tables

  • Table 1: Global Value (USD Million) Forecast by Region, 2020-2035
  • Table 2: Global Value (USD Million) Forecast by Grade, 2020-2035
  • Table 3: Global Value (USD Million) Forecast by Function, 2020-2035
  • Table 4: Global Value (USD Million) Forecast by Product Type, 2020-2035
  • Table 5: Global Value (USD Million) Forecast by Channel, 2020-2035
  • Table 6: Global Value (USD Million) Forecast by Claim, 2020-2035
  • Table 7: North America Value (USD Million) Forecast by Country, 2020-2035
  • Table 8: North America Value (USD Million) Forecast by Grade, 2020-2035
  • Table 9: North America Value (USD Million) Forecast by Function, 2020-2035
  • Table 10: North America Value (USD Million) Forecast by Product Type, 2020-2035
  • Table 11: North America Value (USD Million) Forecast by Channel, 2020-2035
  • Table 12: North America Value (USD Million) Forecast by Claim, 2020-2035
  • Table 13: Latin America Value (USD Million) Forecast by Country, 2020-2035
  • Table 14: Latin America Value (USD Million) Forecast by Grade, 2020-2035
  • Table 15: Latin America Value (USD Million) Forecast by Function, 2020-2035
  • Table 16: Latin America Value (USD Million) Forecast by Product Type, 2020-2035
  • Table 17: Latin America Value (USD Million) Forecast by Channel, 2020-2035
  • Table 18: Latin America Value (USD Million) Forecast by Claim, 2020-2035
  • Table 19: Europe Value (USD Million) Forecast by Country, 2020-2035
  • Table 20: Europe Value (USD Million) Forecast by Grade, 2020-2035
  • Table 21: Europe Value (USD Million) Forecast by Function, 2020-2035
  • Table 22: Europe Value (USD Million) Forecast by Product Type, 2020-2035
  • Table 23: Europe Value (USD Million) Forecast by Channel, 2020-2035
  • Table 24: Europe Value (USD Million) Forecast by Claim, 2020-2035
  • Table 25: East Asia Value (USD Million) Forecast by Country, 2020-2035
  • Table 26: East Asia Value (USD Million) Forecast by Grade, 2020-2035
  • Table 27: East Asia Value (USD Million) Forecast by Function, 2020-2035
  • Table 28: East Asia Value (USD Million) Forecast by Product Type, 2020-2035
  • Table 29: East Asia Value (USD Million) Forecast by Channel, 2020-2035
  • Table 30: East Asia Value (USD Million) Forecast by Claim, 2020-2035
  • Table 31: South Asia & Pacific Value (USD Million) Forecast by Country, 2020-2035
  • Table 32: South Asia & Pacific Value (USD Million) Forecast by Grade, 2020-2035
  • Table 33: South Asia & Pacific Value (USD Million) Forecast by Function, 2020-2035
  • Table 34: South Asia & Pacific Value (USD Million) Forecast by Product Type, 2020-2035
  • Table 35: South Asia & Pacific Value (USD Million) Forecast by Channel, 2020-2035
  • Table 36: South Asia & Pacific Value (USD Million) Forecast by Claim, 2020-2035
  • Table 37: Middle East and Africa Value (USD Million) Forecast by Country, 2020-2035
  • Table 38: Middle East and Africa Value (USD Million) Forecast by Grade, 2020-2035
  • Table 39: Middle East and Africa Value (USD Million) Forecast by Function, 2020-2035
  • Table 40: Middle East and Africa Value (USD Million) Forecast by Product Type, 2020-2035
  • Table 41: Middle East and Africa Value (USD Million) Forecast by Channel, 2020-2035
  • Table 42: Middle East and Africa Value (USD Million) Forecast by Claim, 2020-2035

List of Figures

  • Figure 1: Global Pricing Analysis
  • Figure 2: Global Value (USD Million) Forecast 2020-2035
  • Figure 3: Global Value Share and BPS Analysis by Grade, 2025 and 2035
  • Figure 4: Global Y-o-Y Growth Comparison by Grade, 2025-2035
  • Figure 5: Global Attractiveness Analysis by Grade
  • Figure 6: Global Value Share and BPS Analysis by Function, 2025 and 2035
  • Figure 7: Global Y-o-Y Growth Comparison by Function, 2025-2035
  • Figure 8: Global Attractiveness Analysis by Function
  • Figure 9: Global Value Share and BPS Analysis by Product Type, 2025 and 2035
  • Figure 10: Global Y-o-Y Growth Comparison by Product Type, 2025-2035
  • Figure 11: Global Attractiveness Analysis by Product Type
  • Figure 12: Global Value Share and BPS Analysis by Channel, 2025 and 2035
  • Figure 13: Global Y-o-Y Growth Comparison by Channel, 2025-2035
  • Figure 14: Global Attractiveness Analysis by Channel
  • Figure 15: Global Value Share and BPS Analysis by Claim, 2025 and 2035
  • Figure 16: Global Y-o-Y Growth Comparison by Claim, 2025-2035
  • Figure 17: Global Attractiveness Analysis by Claim
  • Figure 18: Global Value (USD Million) Share and BPS Analysis by Region, 2025 and 2035
  • Figure 19: Global Y-o-Y Growth Comparison by Region, 2025-2035
  • Figure 20: Global Attractiveness Analysis by Region
  • Figure 21: North America Incremental $ Opportunity, 2025-2035
  • Figure 22: Latin America Incremental $ Opportunity, 2025-2035
  • Figure 23: Europe Incremental $ Opportunity, 2025-2035
  • Figure 24: East Asia Incremental $ Opportunity, 2025-2035
  • Figure 25: South Asia & Pacific Incremental $ Opportunity, 2025-2035
  • Figure 26: Middle East and Africa Incremental $ Opportunity, 2025-2035
  • Figure 27: North America Value Share and BPS Analysis by Country, 2025 and 2035
  • Figure 28: North America Value Share and BPS Analysis by Grade, 2025 and 2035
  • Figure 29: North America Y-o-Y Growth Comparison by Grade, 2025-2035
  • Figure 30: North America Attractiveness Analysis by Grade
  • Figure 31: North America Value Share and BPS Analysis by Function, 2025 and 2035
  • Figure 32: North America Y-o-Y Growth Comparison by Function, 2025-2035
  • Figure 33: North America Attractiveness Analysis by Function
  • Figure 34: North America Value Share and BPS Analysis by Product Type, 2025 and 2035
  • Figure 35: North America Y-o-Y Growth Comparison by Product Type, 2025-2035
  • Figure 36: North America Attractiveness Analysis by Product Type
  • Figure 37: North America Value Share and BPS Analysis by Channel, 2025 and 2035
  • Figure 38: North America Y-o-Y Growth Comparison by Channel, 2025-2035
  • Figure 39: North America Attractiveness Analysis by Channel
  • Figure 40: North America Value Share and BPS Analysis by Claim, 2025 and 2035
  • Figure 41: North America Y-o-Y Growth Comparison by Claim, 2025-2035
  • Figure 42: North America Attractiveness Analysis by Claim
  • Figure 43: Latin America Value Share and BPS Analysis by Country, 2025 and 2035
  • Figure 44: Latin America Value Share and BPS Analysis by Grade, 2025 and 2035
  • Figure 45: Latin America Y-o-Y Growth Comparison by Grade, 2025-2035
  • Figure 46: Latin America Attractiveness Analysis by Grade
  • Figure 47: Latin America Value Share and BPS Analysis by Function, 2025 and 2035
  • Figure 48: Latin America Y-o-Y Growth Comparison by Function, 2025-2035
  • Figure 49: Latin America Attractiveness Analysis by Function
  • Figure 50: Latin America Value Share and BPS Analysis by Product Type, 2025 and 2035
  • Figure 51: Latin America Y-o-Y Growth Comparison by Product Type, 2025-2035
  • Figure 52: Latin America Attractiveness Analysis by Product Type
  • Figure 53: Latin America Value Share and BPS Analysis by Channel, 2025 and 2035
  • Figure 54: Latin America Y-o-Y Growth Comparison by Channel, 2025-2035
  • Figure 55: Latin America Attractiveness Analysis by Channel
  • Figure 56: Latin America Value Share and BPS Analysis by Claim, 2025 and 2035
  • Figure 57: Latin America Y-o-Y Growth Comparison by Claim, 2025-2035
  • Figure 58: Latin America Attractiveness Analysis by Claim
  • Figure 59: Europe Value Share and BPS Analysis by Country, 2025 and 2035
  • Figure 60: Europe Value Share and BPS Analysis by Grade, 2025 and 2035
  • Figure 61: Europe Y-o-Y Growth Comparison by Grade, 2025-2035
  • Figure 62: Europe Attractiveness Analysis by Grade
  • Figure 63: Europe Value Share and BPS Analysis by Function, 2025 and 2035
  • Figure 64: Europe Y-o-Y Growth Comparison by Function, 2025-2035
  • Figure 65: Europe Attractiveness Analysis by Function
  • Figure 66: Europe Value Share and BPS Analysis by Product Type, 2025 and 2035
  • Figure 67: Europe Y-o-Y Growth Comparison by Product Type, 2025-2035
  • Figure 68: Europe Attractiveness Analysis by Product Type
  • Figure 69: Europe Value Share and BPS Analysis by Channel, 2025 and 2035
  • Figure 70: Europe Y-o-Y Growth Comparison by Channel, 2025-2035
  • Figure 71: Europe Attractiveness Analysis by Channel
  • Figure 72: Europe Value Share and BPS Analysis by Claim, 2025 and 2035
  • Figure 73: Europe Y-o-Y Growth Comparison by Claim, 2025-2035
  • Figure 74: Europe Attractiveness Analysis by Claim
  • Figure 75: East Asia Value Share and BPS Analysis by Country, 2025 and 2035
  • Figure 76: East Asia Value Share and BPS Analysis by Grade, 2025 and 2035
  • Figure 77: East Asia Y-o-Y Growth Comparison by Grade, 2025-2035
  • Figure 78: East Asia Attractiveness Analysis by Grade
  • Figure 79: East Asia Value Share and BPS Analysis by Function, 2025 and 2035
  • Figure 80: East Asia Y-o-Y Growth Comparison by Function, 2025-2035
  • Figure 81: East Asia Attractiveness Analysis by Function
  • Figure 82: East Asia Value Share and BPS Analysis by Product Type, 2025 and 2035
  • Figure 83: East Asia Y-o-Y Growth Comparison by Product Type, 2025-2035
  • Figure 84: East Asia Attractiveness Analysis by Product Type
  • Figure 85: East Asia Value Share and BPS Analysis by Channel, 2025 and 2035
  • Figure 86: East Asia Y-o-Y Growth Comparison by Channel, 2025-2035
  • Figure 87: East Asia Attractiveness Analysis by Channel
  • Figure 88: East Asia Value Share and BPS Analysis by Claim, 2025 and 2035
  • Figure 89: East Asia Y-o-Y Growth Comparison by Claim, 2025-2035
  • Figure 90: East Asia Attractiveness Analysis by Claim
  • Figure 91: South Asia & Pacific Value Share and BPS Analysis by Country, 2025 and 2035
  • Figure 92: South Asia & Pacific Value Share and BPS Analysis by Grade, 2025 and 2035
  • Figure 93: South Asia & Pacific Y-o-Y Growth Comparison by Grade, 2025-2035
  • Figure 94: South Asia & Pacific Attractiveness Analysis by Grade
  • Figure 95: South Asia & Pacific Value Share and BPS Analysis by Function, 2025 and 2035
  • Figure 96: South Asia & Pacific Y-o-Y Growth Comparison by Function, 2025-2035
  • Figure 97: South Asia & Pacific Attractiveness Analysis by Function
  • Figure 98: South Asia & Pacific Value Share and BPS Analysis by Product Type, 2025 and 2035
  • Figure 99: South Asia & Pacific Y-o-Y Growth Comparison by Product Type, 2025-2035
  • Figure 100: South Asia & Pacific Attractiveness Analysis by Product Type
  • Figure 101: South Asia & Pacific Value Share and BPS Analysis by Channel, 2025 and 2035
  • Figure 102: South Asia & Pacific Y-o-Y Growth Comparison by Channel, 2025-2035
  • Figure 103: South Asia & Pacific Attractiveness Analysis by Channel
  • Figure 104: South Asia & Pacific Value Share and BPS Analysis by Claim, 2025 and 2035
  • Figure 105: South Asia & Pacific Y-o-Y Growth Comparison by Claim, 2025-2035
  • Figure 106: South Asia & Pacific Attractiveness Analysis by Claim
  • Figure 107: Global - Tier Structure Analysis
  • Figure 108: Global - Company Share Analysis

Frequently Asked Questions

How big is the Zinc Oxide Sunscreens Market in 2025?

The global Zinc Oxide Sunscreens Market is estimated to be valued at USD 4,201.4 million in 2025.

What will be the size of the Zinc Oxide Sunscreens Market in 2035?

The market size for the Zinc Oxide Sunscreens Market is projected to reach USD 11,203.4 million by 2035.

How much will be the Zinc Oxide Sunscreens Market growth between 2025 and 2035?

The Zinc Oxide Sunscreens Market is expected to grow at a CAGR of 10.3% between 2025 and 2035.

What are the key product types in the Zinc Oxide Sunscreens Market?

The key product types in the Zinc Oxide Sunscreens Market include lotions/creams, sticks, sprays, and tints/CC creams, with lotions and creams leading at 52.0% share in 2025.

Which formulation segment will contribute significant share in the Zinc Oxide Sunscreens Market in 2025?

In terms of formulation, the 100% mineral segment is projected to command 57.0% share, equal to USD 2,394.80 million, in the Zinc Oxide Sunscreens Market in 2025.

Explore Similar Insights

Future Market Insights

Zinc Oxide Sunscreens Market

Chat With MaRIA

Chat With

MaRIA

Hi There, I am MaRIA, Your Market Research Intelligence Assistant. How may I help you?