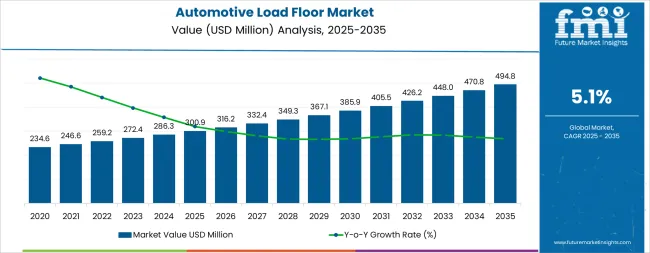
The automotive load floor market is projected to expand from USD 300.9 million in 2025 to USD 494.8 million by 2035, growing at a CAGR of 5.1%. Rising vehicle production, combined with OEM emphasis on functional and lightweight interiors, is driving industry demand. Load floors, which enhance trunk utility and cabin flexibility, are increasingly being built with composite panels and honeycomb cores to reduce weight without compromising strength.
Regulatory frameworks such as the EU’s Fit for 55 and USA fuel economy mandates are pushing automakers toward materials that help reduce overall vehicle mass. Industry associations, including the Society of Plastics Engineers, have spotlighted composite load floors as critical to next-gen platform development.
Innovation is a core theme across major OEMs and suppliers. Grupo Antolin and Magna International are investing in injection-molded and thermoformed solutions that align with electrified vehicle platforms. Hyundai's design team confirmed the integration of dual-level cargo systems in their upcoming SUV lineup to meet consumer demand for enhanced storage accessibility.
Traceability and sustainability are reshaping production and sourcing. In 2025, Stellant is launched QR-tag-based traceability for interior parts, including load floors, to align with circular economy initiatives. Teijin Ltd. received the 2024 Automotive Materials Innovation Award for its use of recycled thermoplastic composites in load floor assemblies.
By 2035, multi-functional and collapsible variants are projected to make up over 50% of total shipments, with SUVs and crossovers comprising 62% of demand. As automakers align design with emissions and circularity goals, load floors are becoming pivotal to next-generation cabin architecture.
Metric | Value |
---|---|
Industry Size (2025E) | USD 300.9 million |
Industry Value (2035F) | USD 494.8 million |
CAGR (2025 to 2035) | 5.1% |
The automotive load floor industry is analyzed across key material types, including hardboard, fluted polypropylene, honeycomb polypropylene, and composites. In terms of application, the market study covers interior systems, cargo systems, and load floor systems over the historical period from 2020 to 2024 and provides forecasts from 2025 to 2035. Regionally, the industry is divided into North America, Latin America, Western Europe, South Asia, East Asia, Eastern Europe, and the Middle East & Africa.
Among material types, honeycomb polypropylene is expected to emerge as the most lucrative segment in the industry, projected to grow from USD 1.21 billion in 2025 to USD 2.25 billion by 2035, registering a CAGR of 6.4%. Its high strength-to-weight ratio and recyclability align with OEM mandates for lightweighting and sustainability across electric and hybrid vehicle platforms. Additionally, the structural rigidity and crash energy absorption offered by honeycomb cores make them increasingly preferred in SUVs and crossovers, which together represent the fastest-growing vehicle class.
Composites are the second-most promising material segment, expected to reach USD 1.85 billion by 2035 from USD 1.13 billion in 2025, growing at a CAGR of 5.1%. Advancements in thermoplastic composite formulations and process automation are enabling high-volume manufacturing while maintaining performance standards. OEMs are integrating these materials for enhanced design flexibility and lifecycle impact reduction.
Fluted polypropylene will grow steadily from USD 0.94 billion in 2025 to USD 1.41 billion by 2035, at a CAGR of 4.1%, driven by its affordability and moisture resistance, making it suitable for cost-sensitive models and aftermarket applications.
Hardboard, being the most traditional material, is witnessing relatively slower growth. It is projected to rise from USD 0.87 billion in 2025 to USD 1.05 billion by 2035, reflecting a CAGR of just 1.9%, due to its heavier weight and limited compatibility with EV architectures.
As electrification and modular design advance, OEMs are increasingly reallocating sourcing budgets toward lightweight, high-performance materials, positioning honeycomb polypropylene and composites as strategic priorities.
Material Type | CAGR (2025 to 2035) |
---|---|
Honeycomb Polypropylene | 6.40% |
Composites | 5.10% |
Fluted Polypropylene | 4.10% |
Hardboard | 1.90% |
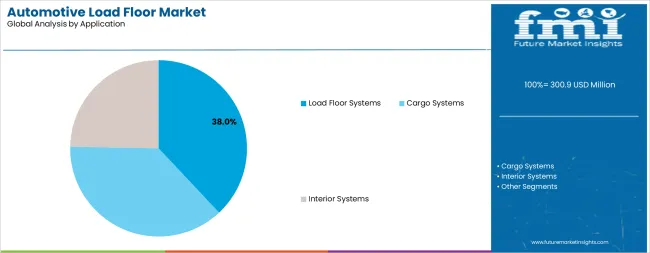
Among application segments, load floor systems are poised to be the most lucrative, projected to grow from USD 1.25 billion in 2025 to USD 2.15 billion by 2035, registering a CAGR of 5.4%.This growth is driven by increasing demand for modular and multifunctional cargo solutions, especially in SUVs and electric vehicles (EVs), where optimizing space and weight is crucial. The integration of advanced materials and design innovations enhances vehicle utility and aligns with sustainability goals.
Cargo systems are expected to expand from USD 1.05 billion in 2025 to USD 1.65 billion by 2035, reflecting a CAGR of 4.7%.Growth in this segment is supported by the rise in e-commerce and last-mile delivery services, necessitating efficient and durable cargo management solutions. Lightweight and customizable cargo systems contribute to improved fuel efficiency and payload capacity.
Interior systems are projected to increase from USD 0.85 billion in 2025 to USD 1.25 billion by 2035, with a CAGR of 3.9%.While this segment experiences steady growth, it is comparatively slower due to the maturity of the industry and the longer replacement cycles of interior components. However, advancements in materials and consumer preferences for enhanced aesthetics and comfort continue to drive demand.
Application Segment | CAGR (2025 to 2035) |
---|---|
Load Floor Systems | 5.40% |
Cargo Systems | 4.70% |
Interior Systems | 3.90% |
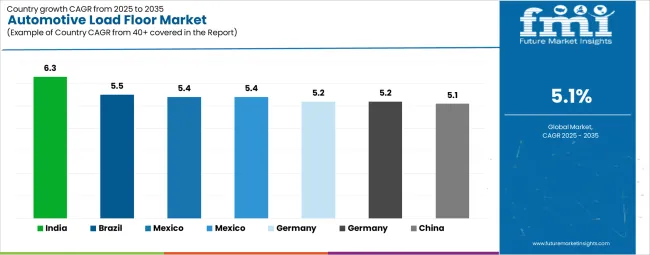
China leads the industry, bolstered by its unparalleled vehicle manufacturing scale and EV dominance. The industry is set to grow from USD 60.2 million in2025 to USD 98.5 million by 2035, with a CAGR of 5.1%. The government’s New Energy Vehicle (NEV) roadmap and “Made in China 2025” push for local innovation have elevated demand for recyclable, lightweight components like honeycomb polypropylene and composite load floors.
EVs and SUVs form the core of demand, with trunk and rear floor configurations increasingly adapting to battery platforms. Local OEMs such as BYD and NIO are rapidly shifting toward collapsible and dual-level load floor designs to enhance utility.
China’s Ministry of Industry and Information Technology (MIIT) has enforced a dual-credit system rewarding energy efficiency, indirectly promoting lighter interiors. The nation’s green procurement policies for government and commercial fleets emphasize low-carbon materials and modular designs, accelerating adoption.
Chinese Tier-1 suppliers are scaling production of thermoformed and injection-molded load floor units, while global companies form JVs to access scale efficiencies. With its strong policy support, maturing EV ecosystem, and low-cost supply base, China remains the most strategically important industry for load floor investments through 2035.
Country | CAGR (2025 to 2035) |
---|---|
China | 5.1% |
The USA industry is driven by its strong SUV and pickup truck culture, segments that inherently demand high-durability cargo platforms. The industry is expected to rise from USD 55.4 million in 2025 to USD 89.7 million by 2035, reflecting a CAGR of 5.0%. The transition to electrified vehicles, particularly in crossover and light truck categories, is boosting the adoption of lightweight composite and honeycomb polypropylene load floors. Regulatory tailwinds such as CAFE fuel economy targets and the Inflation Reduction Act have pushed OEMs to redesign interiors around sustainability benchmarks.
USA automakers like Ford and GM are integrating dual-level and fold-flat load floors across their SUV and EV lines, including models like the F-150 Lightning and Cadillac Lyriq. Meanwhile, aftermarket demand remains resilient, with accessory-based upgrades for load floors in utility vehicles seeing traction in both retail and fleet segments.
Suppliers are also responding to Buy America provisions, re-shoring composite production to align with federal EV sourcing mandates. With the rise of subscription models and fleet mobility platforms, modularity and material circularity are emerging as core purchase drivers. The USA industry will remain a cornerstone for high-margin, value-added load floor innovations.
Country | CAGR (2025 to 2035) |
---|---|
United States | 5.0% |
Japan’s automotive load floor industry is anchored by its domestic OEMs’ precision focus on compact, hybrid, and fuel-efficient vehicle architectures. The industry will expand from USD 45.1 million in 2025 to USD 70.3 million by 2035, growing at a CAGR of 4.5%. Although the average vehicle size is smaller than in Western markets, Japan’s emphasis on interior optimization drives innovation in multi-functional load floor systems. OEMs like Toyota and Honda continue to adopt honeycomb polypropylene panels due to their lightweight profile and crash-absorption capabilities.
Regulations from Japan’s Ministry of Economy, Trade and Industry (METI) are aligned with global sustainability goals, creating demand for load floors with high recyclability and lifecycle traceability. While Japan lags China and the USA in EV penetration, its hybrid dominance is creating demand for lighter and modular trunk configurations. Additionally, with autonomous vehicle trials expanding in Tokyo and Osaka, next-gen vehicle interiors are being reengineered to support flat-floor layouts.
Domestic Tier-1 suppliers such as Toyota Boshoku and TS Tech are leading investments in ultra-light lamination and rapid molding technologies. Japan’s cultural preference for quality, safety, and precision ensures steady demand, even if the volume growth remains moderate.
Country | CAGR (2025 to 2035) |
---|---|
Japan | 4.5% |
India is set to be the fastest-growing market in the automotive load floor industry, expanding from USD 35.7 million in 2025 to USD 65.2 million by 2035, at a CAGR of 6.3%. The surge is fueled by rising consumer preference for SUVs and multi-utility vehicles (MUVs), which now account for over 50% of new passenger vehicle sales. Local OEMs like Tata Motors, Mahindra, and Maruti Suzuki are prioritizing cost-effective and recyclable materials to meet fuel-efficiency mandates under Bharat Stage VI norms.
With India’s Production-Linked Incentive (PLI) schemes supporting domestic component manufacturing, the country has seen a wave of investments in plastic molding, composite panels, and modular interior platforms. OEMs are integrating foldable and tiered load floor designs to increase trunk functionality in budget vehicles.
Meanwhile, global automakers are leveraging India’s cost arbitrage for component exports. The government’s thrust on e-mobility and vehicle scrappage policies is prompting OEMs to redesign interiors with sustainable, detachable components, which directly benefits modular load floor formats. Given its young consumer base, price sensitivity, and growing localization of EV platforms, India offers both the fastest expansion and highest volume potential for load floor suppliers.
Country | CAGR (2025 to 2035) |
---|---|
India | 6.3% |
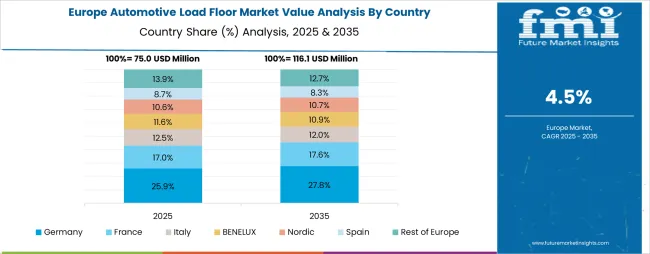
Germany, as Europe’s automotive technology hub, remains a key innovation node in the load floor segment. The industry is expected to grow from USD 40.3 million in 2025 to USD 66.7 million by 2035, at a CAGR of 5.2%. German OEMs, Volkswagen, BMW, and Mercedes-Benz, are deploying advanced composite load floor systems in their EV and luxury SUV platforms, prioritizing modularity, acoustic insulation, and recyclability.
The EU Green Deal and Euro 7 emissions standards are pushing for stringent lightweighting across interiors. Germany’s VDA (German Association of the Automotive Industry) is pushing Tier-1s toward closed-loop material systems, spurring demand for recycled thermoplastics and hybrid composite panels.
Premium OEMs are setting the benchmark by integrating powered load floor actuators and configurable panels to align with evolving customer experience metrics. On the supply side, local players like Dräxlmaier and Rehau are investing in circular design and AI-based molding optimization. With OEMs adopting flat-floor layouts in new EVs, the trunk is being reimagined as a key storage and design element. Germany will remain at the forefront of premium, regulation-driven load floor innovation.
Country | CAGR (2025 to 2035) |
---|---|
Germany | 5.2% |
South Korea's automotive load floor market is carving out a strategic role in the automotive load floor value chain, driven by its innovation in electric vehicles and battery-integrated platforms. The industry is expected to increase from USD 30.2 million in 2025 to USD 50.8 million by 2035, registering a CAGR of 5.4%. Hyundai and Kia are aggressively replat forming future models with E-GMP (Electric Global Modular Platform), which emphasizes flat-floor configurations and lighter interiors, naturally increasing demand for modular, multi-layer load floors made of composites and honeycomb polypropylene.
The Ministry of Trade, Industry and Energy (MOTIE) continues to incentivize domestic development of sustainable and lightweight materials through R&D grants and tax subsidies. South Korean Tier-1 suppliers like Hanwha Solutions and SL Corporation are scaling production of precision-molded floor systems and integrating structural adhesives that enhance torsional rigidity without adding mass. Furthermore, South Korea’s export-driven supply chains offer load floor producers access to global OEM programs across North America and Europe.
EV-specific trunk redesigns, especially with rear motor integration, are driving the need for elevated or double-layer cargo floor modules. Additionally, digital traceability mandates and growing consumer preference for recycled content in automotive interiors reinforce the adoption of newer material combinations. As South Korea tightens carbon footprint disclosures across vehicle components, the load floor segment stands to benefit from early regulatory alignment.
Country | CAGR (2025 to 2035) |
---|---|
South Korea | 5.4% |
Mexico is emerging as a manufacturing hub for automotive load floor components due to its role in North American vehicle assembly. The industry is projected to grow from USD 25.6 million in 2025 to USD 42.9 million by 2035, achieving a CAGR of 5.4%. The country's integration into USA and Canadian supply chains via the USMCA trade framework has prompted global OEMs, such as GM, Ford, and Stellant is, to source modular interior parts, including load floors, from Mexican Tier-1 vendors.
Proximity to USA markets, low labor costs, and expanding composites fabrication capabilities make Mexico attractive for both regional assembly and export. The Secretariat of Economy has prioritized automotive parts localization under the Pro Auto program, with subsidies and incentives for manufacturers deploying sustainable materials. Additionally, OEMs are increasingly introducing global platforms in Mexican plants-many of which are EVs-requiring new packaging architectures and corresponding changes in cargo floor design.
Mexican suppliers are upgrading from conventional hardboard units to thermoformed polypropylene and composite hybrid designs that meet global crash and fire resistance norms. Trunk configuration flexibility is becoming a key feature even in lower-cost models, boosting volume demand. With dual pull from local and export industries, Mexico will continue to be a cost-efficient but technically advancing region in this space.
Country | CAGR (2025 to 2035) |
---|---|
Mexico | 5.4% |
Brazil’s industry is growing in sync with its SUV-heavy vehicle mix and domestic manufacturing recovery. Valued at USD 20.3 million in 2025, the industry is projected to reach USD 34.6 million by 2035, posting a CAGR of 5.5%. With SUVs representing nearly 45% of vehicle sales in Brazil, and flexible cargo usage patterns being common among consumers, OEMs are prioritizing dual-level and collapsible load floor options to enhance utility without impacting cost targets.
The federal government’s Rota 2030 program continues to offer fiscal incentives for local production and innovation in lightweighting and energy efficiency, both of which benefit the evolution of cargo systems. Brazilian plants operated by Stellant is, Volkswagen, and Toyota are integrating lightweight composite load floors in volume models like the Fiat Pulse and VW T-Cross. Moreover, sustainability trends are accelerating, with increasing preference for recycled thermoplastics in Tier-1 sourcing.
Local suppliers are investing in improved lamination and thermoforming facilities to meet OEM requirements around durability, fit, and safety. Importantly, commercial and fleet demand-especially for load-bearing utility vehicles-is also growing, generating steady aftermarket needs. As the Brazilian auto industry pivots toward hybridization and functional design innovation, the load floor industry will consolidate its position as a core modular interior component.
Country | CAGR (2025 to 2035) |
---|---|
Brazil | 5.5% |
France is a critical innovation industry within Western Europe’s automotive load floor landscape, supported by strong government-led decarbonization targets. The industry in France is forecast to grow from USD 18.7 million in 2025 to USD 30.5 million by 2035, at a CAGR of 5.1%. Domestic OEMs such as Renault and Stellant is are actively restructuring EV models on platforms that emphasize flat interior architectures, directly influencing demand for multifunctional load floor solutions.
The French Agency for Ecological Transition (ADEME) mandates strict recycling, emissions, and lifecycle reporting for all interior components, encouraging early adoption of composite and polypropylene-based floor panels. Load floor designs are being optimized to fit battery-integrated vehicle bases while offering customizable storage compartments, particularly in popular B- and C-segment SUVs.
French Tier-1 suppliers like Faurecia and Plastic Omnium are pioneering foldable, recycled-material load floors compatible with automated assembly lines. These firms benefit from France’s active role in the European Battery Alliance and automotive circular economy initiatives. Additionally, France’s robust logistics and export orientation make it a bridgehead for component suppliers targeting wider EU platforms. With regulatory compliance acting as both pressure and incentive, the French industry will continue to reward innovation-led growth in this segment.
Country | CAGR (2025 to 2035) |
---|---|
France | 5.1% |
The UK’s automotive load floor industry is rebounding, driven by electrification commitments and advanced material integration. The market is anticipated to grow from USD 17.5 million in 2025 to USD 28.9 million by 2035, representing a CAGR of 5.2%. British brands like Jaguar Land Rover and Nissan are reshaping their product platforms to accommodate lightweight, dual-tiered load floor systems, especially in premium EV and SUV lines.
UK government policies, such as the Advanced Propulsion Centre’s funding initiatives and the zero-emissions vehicle (ZEV) mandate, are accelerating demand for recyclable, modular components. Load floor systems-often overlooked-have become central to vehicle weight optimization efforts, particularly as battery capacity and underbody cooling systems restrict packaging space. This has prompted OEMs to collaborate with suppliers on ultra-light composite floor panels and structural reinforcements that double as cargo decks.
Tier-1s such as Lear Corporation and IAC Group are leveraging UK-based R&D hubs to trial new fastening and collapsibility technologies that increase utility without inflating cost or complexity. Additionally, as the UK redefines its global trade alliances post-Brexit, localized manufacturing and circular material design will become competitive differentiators. The UK, though smaller in scale, remains influential in shaping next-gen vehicle interiors.
Country | CAGR (2025 to 2035) |
---|---|
United Kingdom | 5.2% |
Company Name | Estimated Market Share (%) |
---|---|
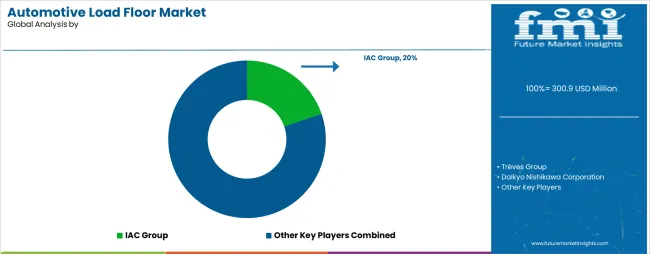
IAC Group | 19-21% |
Trèves Group | 13-15% |
DaikyoNishikawa Corporation | 11-13% |
Motus Integrated Technologies | 9-11% |
Toyota Boshoku Corporation | 8-10% |
IAC Group IAC Group (International Automotive Components) is the current industry leader in automotive load floor systems. The company operates over 40 manufacturing facilities globally and supplies major OEMs such as Ford, Stellant is, and BMW. IAC's core advantage lies in vertical integration and its ability to provide lightweight, multi-material load floors tailored for both ICE and EV platforms. Its European operations, particularly in Germany and the UK, anchor its leadership in modular, high-volume interior platforms. IAC has also made advances in laminated composite floors and acoustic-reducing load panels.
Trèves GroupTrèves is a leading European player with deep expertise in acoustic insulation, thermal barriers, and trunk systems, including load floors. The company’s competitive edge is its dual capability in design and material innovation, especially for NVH (Noise, Vibration, Harshness) compliant load floor solutions. With over 25 production sites, it serves PSA Group (Stellantis), Renault, and other European automakers. It is especially strong in B- and C-segment vehicle platforms and supplies a substantial share of semi-rigid foldable floorboards and molded trunk liners.
Daikyo Nishikawa CorporationDaikyo Nishikawa is a key supplier of resin-based automotive interiors in Asia, particularly in Japan and China. It has long-term partnerships with Toyota and Mazda and specializes in injection-molded polypropylene load floors optimized for light vehicles and compact hybrids. Its resin technologies offer a cost-effective yet durable solution, especially for industries prioritizing fuel efficiency and space optimization. The company is expanding its production in Southeast Asia to support localized platforms.
Motus Integrated Technologies focuses on complete interior systems, including headliners, panels, and load floors. The company serves Ford, GM, and Tesla, and its North American dominance stems from its engineered fiber and thermoplastic load floor solutions tailored for SUVs and pickups. Motus' unique advantage lies in its integration of structural support elements with decorative finish options. It is increasingly investing in modular cargo management floor assemblies for electrified platforms and fleet vehicles.
Toyota Boshoku Corporation Toyota Boshoku leverages its role within the Toyota Group to supply highly integrated load floor and cargo deck modules for sedans, MPVs, and SUVs. While historically focused on the Japanese landscape, its presence in China, Thailand, and North America is expanding. The company is known for combining load-bearing floor panels with seating and storage architecture, particularly for hybrid and crossover platforms. Toyota Boshoku’s strategy involves linking load floor designs with vehicle-wide sustainability metrics, such as recyclability and VOC compliance.
Attribute | Details |
---|---|
Current Total Market Size (2025) | USD 300.9 million |
Projected Market Size (2035) | USD 494.8 million |
CAGR (2025 to 2035) | 5.1% |
Base Year for Estimation | 2024 |
Historical Period | 2020 to 2024 |
Projections Period | 2025 to 2035 |
Report Parameter | Revenue in USD million |
By Material Type | Hardboard, Fluted Polypropylene, Honeycomb Polypropylene, and Composites |
By Application | Interior Systems, Cargo Systems, and Load Floor Systems |
Regions Covered | North America, Latin America, Western Europe, South Asia, East Asia, Eastern Europe, and the Middle East & Africa |
Countries Covered | China, the United States, Japan, India, Germany, South Korea, Mexico, Brazil, France, and the United Kingdom |
Key Players | A IAC Group, Trèves Group, DaikyoNishikawa Corporation, Motus Integrated Technologies, Toyota Boshoku Corporation, Faurecia SE (FORVIA), Summit Polymer Inc., Lear Corporation (interior systems segment), Adient plc, and Doosan Corporation. |
Additional Attributes | Dollar sales by value, market share analysis by region, and country-wise analysis |
Customization and Pricing | Available on request |
The automotive load floor industry is segmented into hardboard, fluted polypropylene, honeycomb polypropylene, and composites.
The industry is divided into interior systems, cargo systems, and load floor systems.
The industry includes North America, Latin America, Western Europe, South Asia, East Asia, Eastern Europe, and Middle East & Africa.
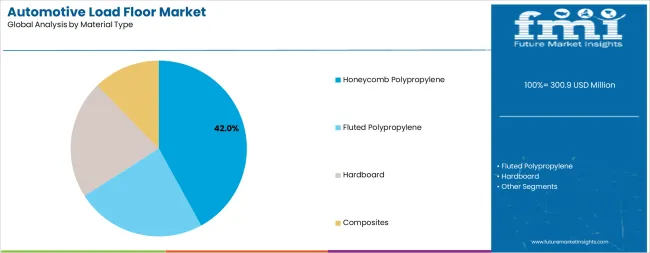
Table 1: Global Market Value (US$ Million) Forecast by Region, 2018 to 2033
Table 2: Global Market Volume (Units) Forecast by Region, 2018 to 2033
Table 3: Global Market Value (US$ Million) Forecast by Material Type, 2018 to 2033
Table 4: Global Market Volume (Units) Forecast by Material Type, 2018 to 2033
Table 5: Global Market Value (US$ Million) Forecast by Application, 2018 to 2033
Table 6: Global Market Volume (Units) Forecast by Application, 2018 to 2033
Table 7: Global Market Value (US$ Million) Forecast by Operation, 2018 to 2033
Table 8: Global Market Volume (Units) Forecast by Operation, 2018 to 2033
Table 9: Global Market Value (US$ Million) Forecast by Vehicle Type, 2018 to 2033
Table 10: Global Market Volume (Units) Forecast by Vehicle Type, 2018 to 2033
Table 11: North America Market Value (US$ Million) Forecast by Country, 2018 to 2033
Table 12: North America Market Volume (Units) Forecast by Country, 2018 to 2033
Table 13: North America Market Value (US$ Million) Forecast by Material Type, 2018 to 2033
Table 14: North America Market Volume (Units) Forecast by Material Type, 2018 to 2033
Table 15: North America Market Value (US$ Million) Forecast by Application, 2018 to 2033
Table 16: North America Market Volume (Units) Forecast by Application, 2018 to 2033
Table 17: North America Market Value (US$ Million) Forecast by Operation, 2018 to 2033
Table 18: North America Market Volume (Units) Forecast by Operation, 2018 to 2033
Table 19: North America Market Value (US$ Million) Forecast by Vehicle Type, 2018 to 2033
Table 20: North America Market Volume (Units) Forecast by Vehicle Type, 2018 to 2033
Table 21: Latin America Market Value (US$ Million) Forecast by Country, 2018 to 2033
Table 22: Latin America Market Volume (Units) Forecast by Country, 2018 to 2033
Table 23: Latin America Market Value (US$ Million) Forecast by Material Type, 2018 to 2033
Table 24: Latin America Market Volume (Units) Forecast by Material Type, 2018 to 2033
Table 25: Latin America Market Value (US$ Million) Forecast by Application, 2018 to 2033
Table 26: Latin America Market Volume (Units) Forecast by Application, 2018 to 2033
Table 27: Latin America Market Value (US$ Million) Forecast by Operation, 2018 to 2033
Table 28: Latin America Market Volume (Units) Forecast by Operation, 2018 to 2033
Table 29: Latin America Market Value (US$ Million) Forecast by Vehicle Type, 2018 to 2033
Table 30: Latin America Market Volume (Units) Forecast by Vehicle Type, 2018 to 2033
Table 31: Western Europe Market Value (US$ Million) Forecast by Country, 2018 to 2033
Table 32: Western Europe Market Volume (Units) Forecast by Country, 2018 to 2033
Table 33: Western Europe Market Value (US$ Million) Forecast by Material Type, 2018 to 2033
Table 34: Western Europe Market Volume (Units) Forecast by Material Type, 2018 to 2033
Table 35: Western Europe Market Value (US$ Million) Forecast by Application, 2018 to 2033
Table 36: Western Europe Market Volume (Units) Forecast by Application, 2018 to 2033
Table 37: Western Europe Market Value (US$ Million) Forecast by Operation, 2018 to 2033
Table 38: Western Europe Market Volume (Units) Forecast by Operation, 2018 to 2033
Table 39: Western Europe Market Value (US$ Million) Forecast by Vehicle Type, 2018 to 2033
Table 40: Western Europe Market Volume (Units) Forecast by Vehicle Type, 2018 to 2033
Table 41: Eastern Europe Market Value (US$ Million) Forecast by Country, 2018 to 2033
Table 42: Eastern Europe Market Volume (Units) Forecast by Country, 2018 to 2033
Table 43: Eastern Europe Market Value (US$ Million) Forecast by Material Type, 2018 to 2033
Table 44: Eastern Europe Market Volume (Units) Forecast by Material Type, 2018 to 2033
Table 45: Eastern Europe Market Value (US$ Million) Forecast by Application, 2018 to 2033
Table 46: Eastern Europe Market Volume (Units) Forecast by Application, 2018 to 2033
Table 47: Eastern Europe Market Value (US$ Million) Forecast by Operation, 2018 to 2033
Table 48: Eastern Europe Market Volume (Units) Forecast by Operation, 2018 to 2033
Table 49: Eastern Europe Market Value (US$ Million) Forecast by Vehicle Type, 2018 to 2033
Table 50: Eastern Europe Market Volume (Units) Forecast by Vehicle Type, 2018 to 2033
Table 51: South Asia and Pacific Market Value (US$ Million) Forecast by Country, 2018 to 2033
Table 52: South Asia and Pacific Market Volume (Units) Forecast by Country, 2018 to 2033
Table 53: South Asia and Pacific Market Value (US$ Million) Forecast by Material Type, 2018 to 2033
Table 54: South Asia and Pacific Market Volume (Units) Forecast by Material Type, 2018 to 2033
Table 55: South Asia and Pacific Market Value (US$ Million) Forecast by Application, 2018 to 2033
Table 56: South Asia and Pacific Market Volume (Units) Forecast by Application, 2018 to 2033
Table 57: South Asia and Pacific Market Value (US$ Million) Forecast by Operation, 2018 to 2033
Table 58: South Asia and Pacific Market Volume (Units) Forecast by Operation, 2018 to 2033
Table 59: South Asia and Pacific Market Value (US$ Million) Forecast by Vehicle Type, 2018 to 2033
Table 60: South Asia and Pacific Market Volume (Units) Forecast by Vehicle Type, 2018 to 2033
Table 61: East Asia Market Value (US$ Million) Forecast by Country, 2018 to 2033
Table 62: East Asia Market Volume (Units) Forecast by Country, 2018 to 2033
Table 63: East Asia Market Value (US$ Million) Forecast by Material Type, 2018 to 2033
Table 64: East Asia Market Volume (Units) Forecast by Material Type, 2018 to 2033
Table 65: East Asia Market Value (US$ Million) Forecast by Application, 2018 to 2033
Table 66: East Asia Market Volume (Units) Forecast by Application, 2018 to 2033
Table 67: East Asia Market Value (US$ Million) Forecast by Operation, 2018 to 2033
Table 68: East Asia Market Volume (Units) Forecast by Operation, 2018 to 2033
Table 69: East Asia Market Value (US$ Million) Forecast by Vehicle Type, 2018 to 2033
Table 70: East Asia Market Volume (Units) Forecast by Vehicle Type, 2018 to 2033
Table 71: Middle East and Africa Market Value (US$ Million) Forecast by Country, 2018 to 2033
Table 72: Middle East and Africa Market Volume (Units) Forecast by Country, 2018 to 2033
Table 73: Middle East and Africa Market Value (US$ Million) Forecast by Material Type, 2018 to 2033
Table 74: Middle East and Africa Market Volume (Units) Forecast by Material Type, 2018 to 2033
Table 75: Middle East and Africa Market Value (US$ Million) Forecast by Application, 2018 to 2033
Table 76: Middle East and Africa Market Volume (Units) Forecast by Application, 2018 to 2033
Table 77: Middle East and Africa Market Value (US$ Million) Forecast by Operation, 2018 to 2033
Table 78: Middle East and Africa Market Volume (Units) Forecast by Operation, 2018 to 2033
Table 79: Middle East and Africa Market Value (US$ Million) Forecast by Vehicle Type, 2018 to 2033
Table 80: Middle East and Africa Market Volume (Units) Forecast by Vehicle Type, 2018 to 2033
Figure 1: Global Market Value (US$ Million) by Material Type, 2023 to 2033
Figure 2: Global Market Value (US$ Million) by Application, 2023 to 2033
Figure 3: Global Market Value (US$ Million) by Operation, 2023 to 2033
Figure 4: Global Market Value (US$ Million) by Vehicle Type, 2023 to 2033
Figure 5: Global Market Value (US$ Million) by Region, 2023 to 2033
Figure 6: Global Market Value (US$ Million) Analysis by Region, 2018 to 2033
Figure 7: Global Market Volume (Units) Analysis by Region, 2018 to 2033
Figure 8: Global Market Value Share (%) and BPS Analysis by Region, 2023 to 2033
Figure 9: Global Market Y-o-Y Growth (%) Projections by Region, 2023 to 2033
Figure 10: Global Market Value (US$ Million) Analysis by Material Type, 2018 to 2033
Figure 11: Global Market Volume (Units) Analysis by Material Type, 2018 to 2033
Figure 12: Global Market Value Share (%) and BPS Analysis by Material Type, 2023 to 2033
Figure 13: Global Market Y-o-Y Growth (%) Projections by Material Type, 2023 to 2033
Figure 14: Global Market Value (US$ Million) Analysis by Application, 2018 to 2033
Figure 15: Global Market Volume (Units) Analysis by Application, 2018 to 2033
Figure 16: Global Market Value Share (%) and BPS Analysis by Application, 2023 to 2033
Figure 17: Global Market Y-o-Y Growth (%) Projections by Application, 2023 to 2033
Figure 18: Global Market Value (US$ Million) Analysis by Operation, 2018 to 2033
Figure 19: Global Market Volume (Units) Analysis by Operation, 2018 to 2033
Figure 20: Global Market Value Share (%) and BPS Analysis by Operation, 2023 to 2033
Figure 21: Global Market Y-o-Y Growth (%) Projections by Operation, 2023 to 2033
Figure 22: Global Market Value (US$ Million) Analysis by Vehicle Type, 2018 to 2033
Figure 23: Global Market Volume (Units) Analysis by Vehicle Type, 2018 to 2033
Figure 24: Global Market Value Share (%) and BPS Analysis by Vehicle Type, 2023 to 2033
Figure 25: Global Market Y-o-Y Growth (%) Projections by Vehicle Type, 2023 to 2033
Figure 26: Global Market Attractiveness by Material Type, 2023 to 2033
Figure 27: Global Market Attractiveness by Application, 2023 to 2033
Figure 28: Global Market Attractiveness by Operation, 2023 to 2033
Figure 29: Global Market Attractiveness by Vehicle Type, 2023 to 2033
Figure 30: Global Market Attractiveness by Region, 2023 to 2033
Figure 31: North America Market Value (US$ Million) by Material Type, 2023 to 2033
Figure 32: North America Market Value (US$ Million) by Application, 2023 to 2033
Figure 33: North America Market Value (US$ Million) by Operation, 2023 to 2033
Figure 34: North America Market Value (US$ Million) by Vehicle Type, 2023 to 2033
Figure 35: North America Market Value (US$ Million) by Country, 2023 to 2033
Figure 36: North America Market Value (US$ Million) Analysis by Country, 2018 to 2033
Figure 37: North America Market Volume (Units) Analysis by Country, 2018 to 2033
Figure 38: North America Market Value Share (%) and BPS Analysis by Country, 2023 to 2033
Figure 39: North America Market Y-o-Y Growth (%) Projections by Country, 2023 to 2033
Figure 40: North America Market Value (US$ Million) Analysis by Material Type, 2018 to 2033
Figure 41: North America Market Volume (Units) Analysis by Material Type, 2018 to 2033
Figure 42: North America Market Value Share (%) and BPS Analysis by Material Type, 2023 to 2033
Figure 43: North America Market Y-o-Y Growth (%) Projections by Material Type, 2023 to 2033
Figure 44: North America Market Value (US$ Million) Analysis by Application, 2018 to 2033
Figure 45: North America Market Volume (Units) Analysis by Application, 2018 to 2033
Figure 46: North America Market Value Share (%) and BPS Analysis by Application, 2023 to 2033
Figure 47: North America Market Y-o-Y Growth (%) Projections by Application, 2023 to 2033
Figure 48: North America Market Value (US$ Million) Analysis by Operation, 2018 to 2033
Figure 49: North America Market Volume (Units) Analysis by Operation, 2018 to 2033
Figure 50: North America Market Value Share (%) and BPS Analysis by Operation, 2023 to 2033
Figure 51: North America Market Y-o-Y Growth (%) Projections by Operation, 2023 to 2033
Figure 52: North America Market Value (US$ Million) Analysis by Vehicle Type, 2018 to 2033
Figure 53: North America Market Volume (Units) Analysis by Vehicle Type, 2018 to 2033
Figure 54: North America Market Value Share (%) and BPS Analysis by Vehicle Type, 2023 to 2033
Figure 55: North America Market Y-o-Y Growth (%) Projections by Vehicle Type, 2023 to 2033
Figure 56: North America Market Attractiveness by Material Type, 2023 to 2033
Figure 57: North America Market Attractiveness by Application, 2023 to 2033
Figure 58: North America Market Attractiveness by Operation, 2023 to 2033
Figure 59: North America Market Attractiveness by Vehicle Type, 2023 to 2033
Figure 60: North America Market Attractiveness by Country, 2023 to 2033
Figure 61: Latin America Market Value (US$ Million) by Material Type, 2023 to 2033
Figure 62: Latin America Market Value (US$ Million) by Application, 2023 to 2033
Figure 63: Latin America Market Value (US$ Million) by Operation, 2023 to 2033
Figure 64: Latin America Market Value (US$ Million) by Vehicle Type, 2023 to 2033
Figure 65: Latin America Market Value (US$ Million) by Country, 2023 to 2033
Figure 66: Latin America Market Value (US$ Million) Analysis by Country, 2018 to 2033
Figure 67: Latin America Market Volume (Units) Analysis by Country, 2018 to 2033
Figure 68: Latin America Market Value Share (%) and BPS Analysis by Country, 2023 to 2033
Figure 69: Latin America Market Y-o-Y Growth (%) Projections by Country, 2023 to 2033
Figure 70: Latin America Market Value (US$ Million) Analysis by Material Type, 2018 to 2033
Figure 71: Latin America Market Volume (Units) Analysis by Material Type, 2018 to 2033
Figure 72: Latin America Market Value Share (%) and BPS Analysis by Material Type, 2023 to 2033
Figure 73: Latin America Market Y-o-Y Growth (%) Projections by Material Type, 2023 to 2033
Figure 74: Latin America Market Value (US$ Million) Analysis by Application, 2018 to 2033
Figure 75: Latin America Market Volume (Units) Analysis by Application, 2018 to 2033
Figure 76: Latin America Market Value Share (%) and BPS Analysis by Application, 2023 to 2033
Figure 77: Latin America Market Y-o-Y Growth (%) Projections by Application, 2023 to 2033
Figure 78: Latin America Market Value (US$ Million) Analysis by Operation, 2018 to 2033
Figure 79: Latin America Market Volume (Units) Analysis by Operation, 2018 to 2033
Figure 80: Latin America Market Value Share (%) and BPS Analysis by Operation, 2023 to 2033
Figure 81: Latin America Market Y-o-Y Growth (%) Projections by Operation, 2023 to 2033
Figure 82: Latin America Market Value (US$ Million) Analysis by Vehicle Type, 2018 to 2033
Figure 83: Latin America Market Volume (Units) Analysis by Vehicle Type, 2018 to 2033
Figure 84: Latin America Market Value Share (%) and BPS Analysis by Vehicle Type, 2023 to 2033
Figure 85: Latin America Market Y-o-Y Growth (%) Projections by Vehicle Type, 2023 to 2033
Figure 86: Latin America Market Attractiveness by Material Type, 2023 to 2033
Figure 87: Latin America Market Attractiveness by Application, 2023 to 2033
Figure 88: Latin America Market Attractiveness by Operation, 2023 to 2033
Figure 89: Latin America Market Attractiveness by Vehicle Type, 2023 to 2033
Figure 90: Latin America Market Attractiveness by Country, 2023 to 2033
Figure 91: Western Europe Market Value (US$ Million) by Material Type, 2023 to 2033
Figure 92: Western Europe Market Value (US$ Million) by Application, 2023 to 2033
Figure 93: Western Europe Market Value (US$ Million) by Operation, 2023 to 2033
Figure 94: Western Europe Market Value (US$ Million) by Vehicle Type, 2023 to 2033
Figure 95: Western Europe Market Value (US$ Million) by Country, 2023 to 2033
Figure 96: Western Europe Market Value (US$ Million) Analysis by Country, 2018 to 2033
Figure 97: Western Europe Market Volume (Units) Analysis by Country, 2018 to 2033
Figure 98: Western Europe Market Value Share (%) and BPS Analysis by Country, 2023 to 2033
Figure 99: Western Europe Market Y-o-Y Growth (%) Projections by Country, 2023 to 2033
Figure 100: Western Europe Market Value (US$ Million) Analysis by Material Type, 2018 to 2033
Figure 101: Western Europe Market Volume (Units) Analysis by Material Type, 2018 to 2033
Figure 102: Western Europe Market Value Share (%) and BPS Analysis by Material Type, 2023 to 2033
Figure 103: Western Europe Market Y-o-Y Growth (%) Projections by Material Type, 2023 to 2033
Figure 104: Western Europe Market Value (US$ Million) Analysis by Application, 2018 to 2033
Figure 105: Western Europe Market Volume (Units) Analysis by Application, 2018 to 2033
Figure 106: Western Europe Market Value Share (%) and BPS Analysis by Application, 2023 to 2033
Figure 107: Western Europe Market Y-o-Y Growth (%) Projections by Application, 2023 to 2033
Figure 108: Western Europe Market Value (US$ Million) Analysis by Operation, 2018 to 2033
Figure 109: Western Europe Market Volume (Units) Analysis by Operation, 2018 to 2033
Figure 110: Western Europe Market Value Share (%) and BPS Analysis by Operation, 2023 to 2033
Figure 111: Western Europe Market Y-o-Y Growth (%) Projections by Operation, 2023 to 2033
Figure 112: Western Europe Market Value (US$ Million) Analysis by Vehicle Type, 2018 to 2033
Figure 113: Western Europe Market Volume (Units) Analysis by Vehicle Type, 2018 to 2033
Figure 114: Western Europe Market Value Share (%) and BPS Analysis by Vehicle Type, 2023 to 2033
Figure 115: Western Europe Market Y-o-Y Growth (%) Projections by Vehicle Type, 2023 to 2033
Figure 116: Western Europe Market Attractiveness by Material Type, 2023 to 2033
Figure 117: Western Europe Market Attractiveness by Application, 2023 to 2033
Figure 118: Western Europe Market Attractiveness by Operation, 2023 to 2033
Figure 119: Western Europe Market Attractiveness by Vehicle Type, 2023 to 2033
Figure 120: Western Europe Market Attractiveness by Country, 2023 to 2033
Figure 121: Eastern Europe Market Value (US$ Million) by Material Type, 2023 to 2033
Figure 122: Eastern Europe Market Value (US$ Million) by Application, 2023 to 2033
Figure 123: Eastern Europe Market Value (US$ Million) by Operation, 2023 to 2033
Figure 124: Eastern Europe Market Value (US$ Million) by Vehicle Type, 2023 to 2033
Figure 125: Eastern Europe Market Value (US$ Million) by Country, 2023 to 2033
Figure 126: Eastern Europe Market Value (US$ Million) Analysis by Country, 2018 to 2033
Figure 127: Eastern Europe Market Volume (Units) Analysis by Country, 2018 to 2033
Figure 128: Eastern Europe Market Value Share (%) and BPS Analysis by Country, 2023 to 2033
Figure 129: Eastern Europe Market Y-o-Y Growth (%) Projections by Country, 2023 to 2033
Figure 130: Eastern Europe Market Value (US$ Million) Analysis by Material Type, 2018 to 2033
Figure 131: Eastern Europe Market Volume (Units) Analysis by Material Type, 2018 to 2033
Figure 132: Eastern Europe Market Value Share (%) and BPS Analysis by Material Type, 2023 to 2033
Figure 133: Eastern Europe Market Y-o-Y Growth (%) Projections by Material Type, 2023 to 2033
Figure 134: Eastern Europe Market Value (US$ Million) Analysis by Application, 2018 to 2033
Figure 135: Eastern Europe Market Volume (Units) Analysis by Application, 2018 to 2033
Figure 136: Eastern Europe Market Value Share (%) and BPS Analysis by Application, 2023 to 2033
Figure 137: Eastern Europe Market Y-o-Y Growth (%) Projections by Application, 2023 to 2033
Figure 138: Eastern Europe Market Value (US$ Million) Analysis by Operation, 2018 to 2033
Figure 139: Eastern Europe Market Volume (Units) Analysis by Operation, 2018 to 2033
Figure 140: Eastern Europe Market Value Share (%) and BPS Analysis by Operation, 2023 to 2033
Figure 141: Eastern Europe Market Y-o-Y Growth (%) Projections by Operation, 2023 to 2033
Figure 142: Eastern Europe Market Value (US$ Million) Analysis by Vehicle Type, 2018 to 2033
Figure 143: Eastern Europe Market Volume (Units) Analysis by Vehicle Type, 2018 to 2033
Figure 144: Eastern Europe Market Value Share (%) and BPS Analysis by Vehicle Type, 2023 to 2033
Figure 145: Eastern Europe Market Y-o-Y Growth (%) Projections by Vehicle Type, 2023 to 2033
Figure 146: Eastern Europe Market Attractiveness by Material Type, 2023 to 2033
Figure 147: Eastern Europe Market Attractiveness by Application, 2023 to 2033
Figure 148: Eastern Europe Market Attractiveness by Operation, 2023 to 2033
Figure 149: Eastern Europe Market Attractiveness by Vehicle Type, 2023 to 2033
Figure 150: Eastern Europe Market Attractiveness by Country, 2023 to 2033
Figure 151: South Asia and Pacific Market Value (US$ Million) by Material Type, 2023 to 2033
Figure 152: South Asia and Pacific Market Value (US$ Million) by Application, 2023 to 2033
Figure 153: South Asia and Pacific Market Value (US$ Million) by Operation, 2023 to 2033
Figure 154: South Asia and Pacific Market Value (US$ Million) by Vehicle Type, 2023 to 2033
Figure 155: South Asia and Pacific Market Value (US$ Million) by Country, 2023 to 2033
Figure 156: South Asia and Pacific Market Value (US$ Million) Analysis by Country, 2018 to 2033
Figure 157: South Asia and Pacific Market Volume (Units) Analysis by Country, 2018 to 2033
Figure 158: South Asia and Pacific Market Value Share (%) and BPS Analysis by Country, 2023 to 2033
Figure 159: South Asia and Pacific Market Y-o-Y Growth (%) Projections by Country, 2023 to 2033
Figure 160: South Asia and Pacific Market Value (US$ Million) Analysis by Material Type, 2018 to 2033
Figure 161: South Asia and Pacific Market Volume (Units) Analysis by Material Type, 2018 to 2033
Figure 162: South Asia and Pacific Market Value Share (%) and BPS Analysis by Material Type, 2023 to 2033
Figure 163: South Asia and Pacific Market Y-o-Y Growth (%) Projections by Material Type, 2023 to 2033
Figure 164: South Asia and Pacific Market Value (US$ Million) Analysis by Application, 2018 to 2033
Figure 165: South Asia and Pacific Market Volume (Units) Analysis by Application, 2018 to 2033
Figure 166: South Asia and Pacific Market Value Share (%) and BPS Analysis by Application, 2023 to 2033
Figure 167: South Asia and Pacific Market Y-o-Y Growth (%) Projections by Application, 2023 to 2033
Figure 168: South Asia and Pacific Market Value (US$ Million) Analysis by Operation, 2018 to 2033
Figure 169: South Asia and Pacific Market Volume (Units) Analysis by Operation, 2018 to 2033
Figure 170: South Asia and Pacific Market Value Share (%) and BPS Analysis by Operation, 2023 to 2033
Figure 171: South Asia and Pacific Market Y-o-Y Growth (%) Projections by Operation, 2023 to 2033
Figure 172: South Asia and Pacific Market Value (US$ Million) Analysis by Vehicle Type, 2018 to 2033
Figure 173: South Asia and Pacific Market Volume (Units) Analysis by Vehicle Type, 2018 to 2033
Figure 174: South Asia and Pacific Market Value Share (%) and BPS Analysis by Vehicle Type, 2023 to 2033
Figure 175: South Asia and Pacific Market Y-o-Y Growth (%) Projections by Vehicle Type, 2023 to 2033
Figure 176: South Asia and Pacific Market Attractiveness by Material Type, 2023 to 2033
Figure 177: South Asia and Pacific Market Attractiveness by Application, 2023 to 2033
Figure 178: South Asia and Pacific Market Attractiveness by Operation, 2023 to 2033
Figure 179: South Asia and Pacific Market Attractiveness by Vehicle Type, 2023 to 2033
Figure 180: South Asia and Pacific Market Attractiveness by Country, 2023 to 2033
Figure 181: East Asia Market Value (US$ Million) by Material Type, 2023 to 2033
Figure 182: East Asia Market Value (US$ Million) by Application, 2023 to 2033
Figure 183: East Asia Market Value (US$ Million) by Operation, 2023 to 2033
Figure 184: East Asia Market Value (US$ Million) by Vehicle Type, 2023 to 2033
Figure 185: East Asia Market Value (US$ Million) by Country, 2023 to 2033
Figure 186: East Asia Market Value (US$ Million) Analysis by Country, 2018 to 2033
Figure 187: East Asia Market Volume (Units) Analysis by Country, 2018 to 2033
Figure 188: East Asia Market Value Share (%) and BPS Analysis by Country, 2023 to 2033
Figure 189: East Asia Market Y-o-Y Growth (%) Projections by Country, 2023 to 2033
Figure 190: East Asia Market Value (US$ Million) Analysis by Material Type, 2018 to 2033
Figure 191: East Asia Market Volume (Units) Analysis by Material Type, 2018 to 2033
Figure 192: East Asia Market Value Share (%) and BPS Analysis by Material Type, 2023 to 2033
Figure 193: East Asia Market Y-o-Y Growth (%) Projections by Material Type, 2023 to 2033
Figure 194: East Asia Market Value (US$ Million) Analysis by Application, 2018 to 2033
Figure 195: East Asia Market Volume (Units) Analysis by Application, 2018 to 2033
Figure 196: East Asia Market Value Share (%) and BPS Analysis by Application, 2023 to 2033
Figure 197: East Asia Market Y-o-Y Growth (%) Projections by Application, 2023 to 2033
Figure 198: East Asia Market Value (US$ Million) Analysis by Operation, 2018 to 2033
Figure 199: East Asia Market Volume (Units) Analysis by Operation, 2018 to 2033
Figure 200: East Asia Market Value Share (%) and BPS Analysis by Operation, 2023 to 2033
Figure 201: East Asia Market Y-o-Y Growth (%) Projections by Operation, 2023 to 2033
Figure 202: East Asia Market Value (US$ Million) Analysis by Vehicle Type, 2018 to 2033
Figure 203: East Asia Market Volume (Units) Analysis by Vehicle Type, 2018 to 2033
Figure 204: East Asia Market Value Share (%) and BPS Analysis by Vehicle Type, 2023 to 2033
Figure 205: East Asia Market Y-o-Y Growth (%) Projections by Vehicle Type, 2023 to 2033
Figure 206: East Asia Market Attractiveness by Material Type, 2023 to 2033
Figure 207: East Asia Market Attractiveness by Application, 2023 to 2033
Figure 208: East Asia Market Attractiveness by Operation, 2023 to 2033
Figure 209: East Asia Market Attractiveness by Vehicle Type, 2023 to 2033
Figure 210: East Asia Market Attractiveness by Country, 2023 to 2033
Figure 211: Middle East and Africa Market Value (US$ Million) by Material Type, 2023 to 2033
Figure 212: Middle East and Africa Market Value (US$ Million) by Application, 2023 to 2033
Figure 213: Middle East and Africa Market Value (US$ Million) by Operation, 2023 to 2033
Figure 214: Middle East and Africa Market Value (US$ Million) by Vehicle Type, 2023 to 2033
Figure 215: Middle East and Africa Market Value (US$ Million) by Country, 2023 to 2033
Figure 216: Middle East and Africa Market Value (US$ Million) Analysis by Country, 2018 to 2033
Figure 217: Middle East and Africa Market Volume (Units) Analysis by Country, 2018 to 2033
Figure 218: Middle East and Africa Market Value Share (%) and BPS Analysis by Country, 2023 to 2033
Figure 219: Middle East and Africa Market Y-o-Y Growth (%) Projections by Country, 2023 to 2033
Figure 220: Middle East and Africa Market Value (US$ Million) Analysis by Material Type, 2018 to 2033
Figure 221: Middle East and Africa Market Volume (Units) Analysis by Material Type, 2018 to 2033
Figure 222: Middle East and Africa Market Value Share (%) and BPS Analysis by Material Type, 2023 to 2033
Figure 223: Middle East and Africa Market Y-o-Y Growth (%) Projections by Material Type, 2023 to 2033
Figure 224: Middle East and Africa Market Value (US$ Million) Analysis by Application, 2018 to 2033
Figure 225: Middle East and Africa Market Volume (Units) Analysis by Application, 2018 to 2033
Figure 226: Middle East and Africa Market Value Share (%) and BPS Analysis by Application, 2023 to 2033
Figure 227: Middle East and Africa Market Y-o-Y Growth (%) Projections by Application, 2023 to 2033
Figure 228: Middle East and Africa Market Value (US$ Million) Analysis by Operation, 2018 to 2033
Figure 229: Middle East and Africa Market Volume (Units) Analysis by Operation, 2018 to 2033
Figure 230: Middle East and Africa Market Value Share (%) and BPS Analysis by Operation, 2023 to 2033
Figure 231: Middle East and Africa Market Y-o-Y Growth (%) Projections by Operation, 2023 to 2033
Figure 232: Middle East and Africa Market Value (US$ Million) Analysis by Vehicle Type, 2018 to 2033
Figure 233: Middle East and Africa Market Volume (Units) Analysis by Vehicle Type, 2018 to 2033
Figure 234: Middle East and Africa Market Value Share (%) and BPS Analysis by Vehicle Type, 2023 to 2033
Figure 235: Middle East and Africa Market Y-o-Y Growth (%) Projections by Vehicle Type, 2023 to 2033
Figure 236: Middle East and Africa Market Attractiveness by Material Type, 2023 to 2033
Figure 237: Middle East and Africa Market Attractiveness by Application, 2023 to 2033
Figure 238: Middle East and Africa Market Attractiveness by Operation, 2023 to 2033
Figure 239: Middle East and Africa Market Attractiveness by Vehicle Type, 2023 to 2033
Figure 240: Middle East and Africa Market Attractiveness by Country, 2023 to 2033
The industry is poised to reach USD 300.9 million in 2025.
The industry is slated to register USD 494.8 million by 2035.
Honeycomb polypropylene is widely used.
India, slated to grow at 6.3% CAGR during the study period, is poised for the fastest growth.
Key companies include AIAC Group, Trèves Group, DaikyoNishikawa Corporation, Motus Integrated Technologies, Toyota Boshoku Corporation, Faurecia SE (FORVIA), Summit Polymer Inc., Lear Corporation (interior systems segment), Adient plc, and Doosan Corporation.
Explore Similar Insights
Thank you!
You will receive an email from our Business Development Manager. Please be sure to check your SPAM/JUNK folder too.