

- Market Size (2026)
- USD 388.4 Mn
- Forecast (2036)
- USD 953.8 Mn
- CAGR (2026 to 2036)
- 9.4%
Adaptive Pressure Redistribution Seat Cushion Systems Market Size, Market Forecast and Outlook By FMI
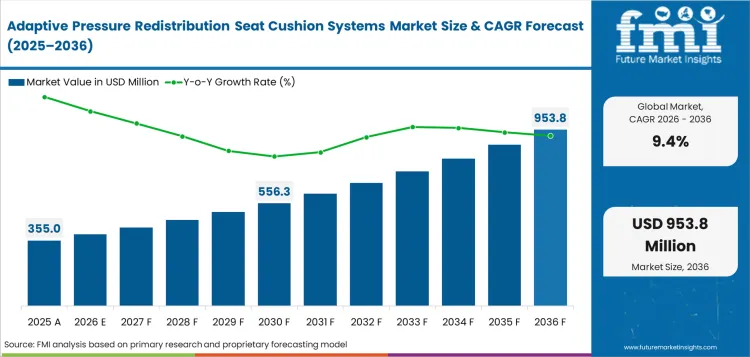
Adaptive pressure redistribution seat cushion systems market was valued at USD 355.0 million in 2025 and is projected to reach USD 388.4 million in 2026. It is forecast to reach USD 953.8 million by 2036 at 9.4% CAGR. Pneumatic air-cell systems are projected to lead system type demand with 42.0% share in 2026. OEM integrated systems are expected to hold 64.0% share by sales channel in 2026.
Summary of the Adaptive Pressure Redistribution Seat Cushion Systems Market
- Demand and Growth Drivers
- Demand for adaptive pressure redistribution seat cushion systems is rising as car makers add active comfort to higher value cabins.
- Market value is supported by long-distance driving needs and premium seating programs in passenger vehicles.
- OEM fitment is widening as pressure sensing reduces numbness during long trips.
- Smaller pneumatic packs and control modules help suppliers fit systems inside thinner seat structures.
- Product and Segment View
- Pneumatic air-cell systems are projected to account for 42.0% share in 2026 as air bladders provide direct pressure relief.
- Electromechanical cushion modules are expected to hold 31.0% share in 2026 as motor control suits premium front seats.
- Pressure-sensor adaptive control is projected to account for 48.0% share in 2026 as real-time body mapping improves response.
- The category overlaps with automotive seating systems and comfort electronics as seat functions move into software-defined cabins.
- Geography and Competitive Outlook
- China is expected to post 10.8% CAGR through 2036 as local premium EV brands add wellness seating functions.
- South Korea is projected at 10.1% CAGR through 2036 due to Hyundai and Kia cabin technology depth.
- Companies such as Lear, FORVIA, Adient, and Magna shape the system direction through comfort seating and module integration.
- Gentherm and AUMOVIO raise electronics exposure as pneumatic control and thermal comfort move closer together.
- Analyst Opinion
- Nikhil Kaitwade, Principal Consultant at FMI says, “I see this market as a comfort control problem. Buyers do not only want softer seats. They want a seat that reads the occupant and changes pressure without making noise or adding bulky parts. The real pressure is coming from premium EV cabins and longer screen-based travel time inside vehicles. Suppliers with sensors and air cells plus valve control and seat trim know-how are expected to have an advantage.”
- Adaptive Pressure Redistribution Seat Cushion Systems Market Value Analysis
- Seat programs are shifting from manual lumbar support toward automatic cushion response based on occupant comfort data.
- Premium EV cabins support higher system value as buyers expect quieter seats and more individual adjustment.
- Long-distance drivers create a practical use case as pressure change reduces numbness during repeated seat time.
- OEM integration raises value since cushion cells and valve packs plus control software are specified before seat launch.
- Aftermarket retrofit kits hold a smaller share since packaging and warranty limits make factory integration the cleaner route.
Key Takeaways, Market Size, and Forecast
- The adaptive pressure redistribution seat cushion systems market was valued at USD 355.0 million in 2025.
- By 2036, the adaptive pressure redistribution seat cushion systems market is expected to be worth USD 953.8 million.
- From 2026 to 2036, the market is projected to expand at 9.4% CAGR.
- The market is projected to create an incremental opportunity of USD 565.4 million between 2026 and 2036.
- Pneumatic air-cell systems are projected to account for 42.0% share of system type demand in 2026.
- OEM integrated systems are expected to account for 64.0% share of sales channel demand in 2026.
- China at 10.8% CAGR and South Korea at 10.1% CAGR are some countries with stable demand outlook.
Long periods of sitting can increase the risk of pressure injuries when seat cushions do not adapt to a person’s body or movement. Reimbursement rules are making clinical proof more important for market access. For example, in May 2026, CMS stated that custom‑fabricated seat cushions (HCPCS code E2609) require a physical or occupational therapist evaluation explaining why a standard cushion is not suitable. This means suppliers must demonstrate proper patient fit before insurance coverage is approved.
Product innovation is also aligning with these requirements. In April 2024, Kalogon reported that Orbiter Med received CMS approval under the same E2609 code, and highlighted the use of machine learning and air‑cell technology to improve weight distribution. This shows how manufacturers are developing smarter systems for pressure control and posture support. Practical care factors influence product selection. For instance, Vicair noted that its Adjuster O2 cushion supports users up to 250 kg and can be machine‑washed at 60°C. These types of specifications help healthcare providers choose products based on ease of use and patient handling needs
Adaptive Pressure Redistribution Seat Cushion Systems Market Definition
The adaptive pressure redistribution seat cushion systems market covers active cushion assemblies used in vehicle seats to change load points under the occupant. The scope includes air-cell cushions and electromechanical support pads. It also covers control valves, pressure sensors and embedded software. These systems support comfort and fatigue reduction. They also support posture control and premium cabin functions. The scope excludes static foam cushions and basic seat covers. It also excludes medical wheelchair cushions sold outside vehicle programs.
Adaptive Pressure Redistribution Seat Cushion Systems Market Inclusions
Market scope includes factory fitted cushion modules and pneumatic packs. It also includes sensor mats, control units, retrofit kits and service parts sold to OEMs and Tier 1 suppliers. Fleet and specialty installer demand is included when the system changes pressure during use.
Adaptive Pressure Redistribution Seat Cushion Systems Market Exclusions
Scope excludes static cushions and hospital mattresses. It also excludes non-vehicle wheelchair pads, decorative covers and basic lumbar supports that do not adjust pressure during use.
Adaptive Pressure Redistribution Seat Cushion Systems Market Research Methodology
- Primary Research: FMI analysts reviewed seat module programs and OEM comfort specifications. Supplier product portfolios and integrator feedback from automotive seating buyers were checked separately.
- Desk Research: The study used public data from government transport agencies and automotive trade bodies. Company technical pages and official company releases were reviewed separately.
- Market sizing and forecasting: Market size was estimated through a hybrid bottom-up and top-down model. Vehicle production and premium seat fitment were used to build the base year. Average system pricing and channel mix were checked separately.
- Data validation: Forecast checks compared vehicle production and EV cabin programs. automotive seat heater systems pneumatic comfort systems and supplier developments were checked before finalizing values.
Why is the Adaptive Pressure Redistribution Seat Cushion Systems Market Growing?
- Premium EV buyers are asking for comfort features that make longer cabin time easier to tolerate.
- Automakers are using cushion control to make seats feel personal without adding thick foam layers.
- Fleet and commercial drivers need pressure relief as daily vehicle use stays high in major markets.
- Seat suppliers are packaging sensors with air cells so OEMs can specify comfort as a software feature.
Longer vehicle use is turning cushion comfort into a measurable design issue. The United States Census Bureau reported a 27.2 minute mean one-way travel time for workers in 2024. It also reported that 9.3% of workers traveled 60 minutes or longer. That level of repeated sitting makes pressure relief more than a premium feature. It becomes a way to reduce discomfort during daily travel and work trips. OEMs are therefore asking suppliers for cushions that shift load points without forcing the occupant to adjust the seat manually.
Electrified cabins are giving comfort systems a wider role inside vehicle design. The International Energy Agency reported that global electric car sales exceeded 17 million in 2024 and accounted for over 20% of new car sales. EV buyers often compare quietness and cabin space during the same purchase decision. Comfort functions add another selection layer. Seat design therefore changes from a passive trim item into an active comfort system. As per FMI, the next buying step is expected to favor modules that combine pressure relief with low noise and low power draw.
Market Segmentation Analysis
- Pneumatic air-cell systems are projected to reach 42.0% share in 2026 as air bladders can change cushion pressure without thick structures.
- With an estimated 46.0% share in 2026, premium passenger cars are expected to lead vehicle type demand as comfort options carry higher trim value.
- Pressure-sensor adaptive control is anticipated to hold 48.0% of control mode demand in 2026 as body pressure mapping makes adjustment automatic.
- Front-row cushions are forecast to account for 58.0% share in 2026 since driver comfort is the first buyer reference point.
- OEM integrated systems are projected to capture 64.0% share in 2026 as warranty and packaging needs favor factory installation.
- Premium mobility applications are expected to represent 39.0% share in 2026 as luxury cabins use active comfort to stand out.
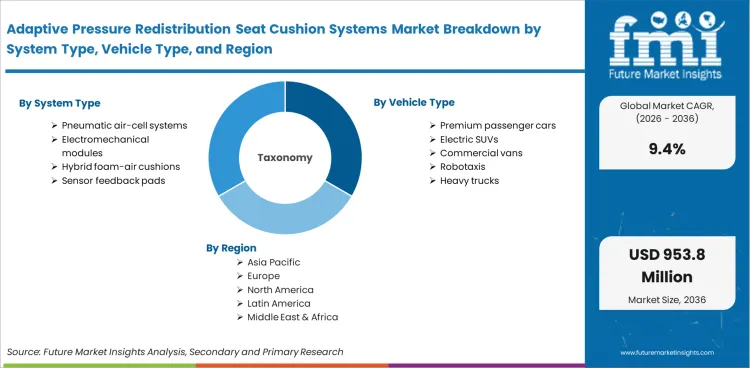
The market for adaptive pressure redistribution seat cushion systems is divided into six primary segment groups. These are system type, vehicle type, control mode, seat position, sales channel and end use. System type explains the pressure relief mechanism. Vehicle type and seat position show where automakers place the feature first. Control mode and sales channel explain how suppliers package the system. End use shows which buyers value it most.
Insights into the Pneumatic Air-Cell Systems System Type Segment
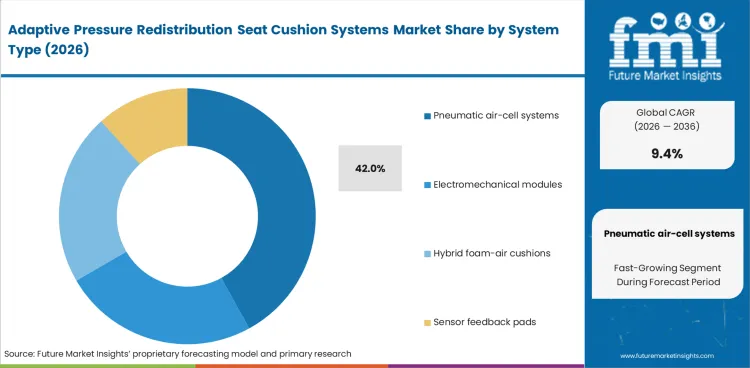
- Pneumatic air-cell systems are projected to account for 42.0% share of system type demand in 2026. Air cells can redistribute load across the cushion without changing the whole seat frame.
- Electromechanical modules remain useful in premium seats, but air cells are easier to tune for massage and pressure relief. Valve noise and bladder durability decide supplier acceptance.
Insights into the Premium Passenger Cars Vehicle Type Segment
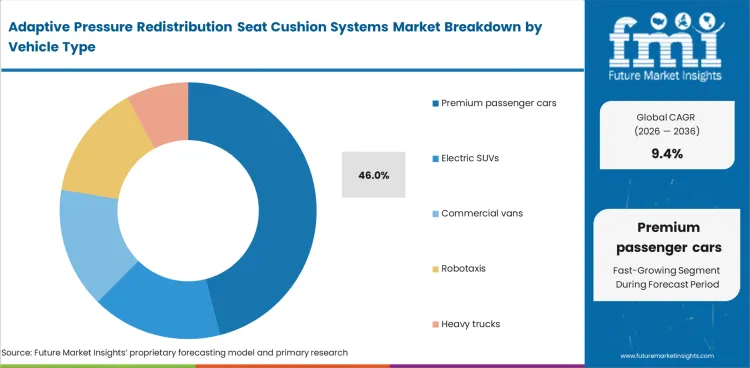
- Premium passenger cars are expected to account for 46.0% share of vehicle type demand in 2026. Buyers in this segment already pay for massage and heating.
- Electric SUVs follow as a wider growth channel for active seating. The use of weight-planned EV seating components is becoming important, as seat design must balance comfort with lightweight construction to protect vehicle range.
Insights into the Pressure-Sensor Adaptive Control Mode Segment
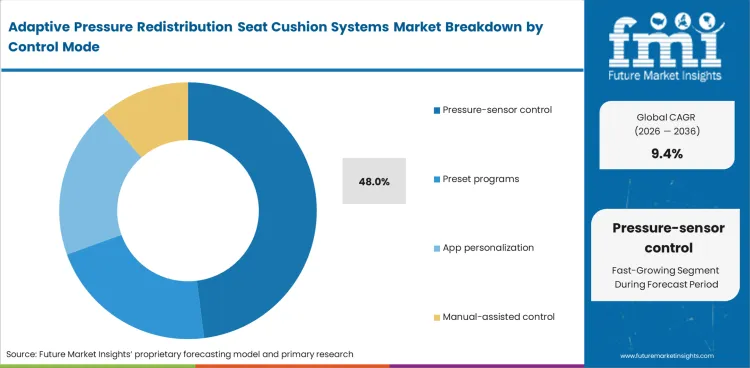
- Pressure-sensor adaptive control is projected to account for 48.0% share of control mode demand in 2026. Sensors allow the cushion to respond to posture change without manual input.
- Preset comfort programs cost less and suit mid-trim vehicles. Sensor-based control holds dominance when OEMs want the seat to behave like a personalized cabin system.
Insights into the Front-Row Cushions Seat Position Segment
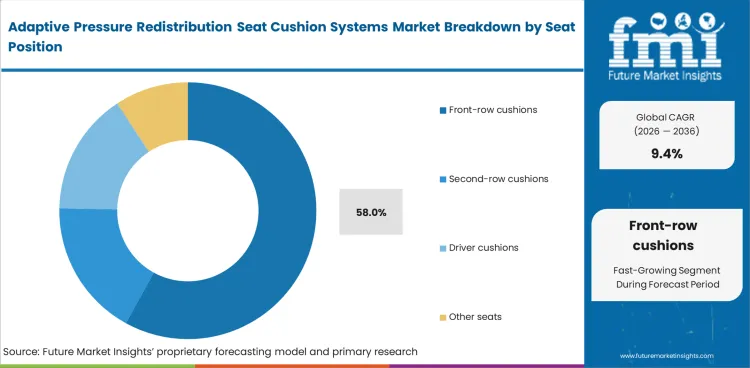
- Front-row cushions are forecast to account for 58.0% share of seat position demand in 2026. Drivers feel fatigue first and use comfort settings most often during repeated trips.
- Second-row lounge cushions are increasing in premium mobility. This segment overlaps with passenger car seats, where cabin experience is expanding beyond the driver.
Insights into the OEM Integrated Systems Sales Channel Segment
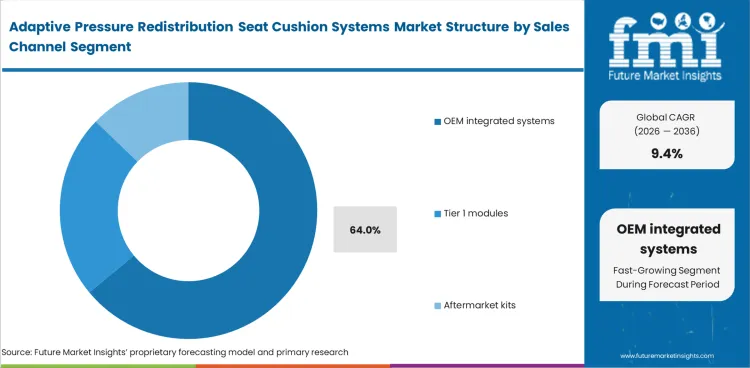
- OEM integrated systems are projected to account for 64.0% share of sales channel demand in 2026. Factory fitting lowers fitment risk and keeps warranty responsibility clear.
- Tier 1 module supply remains important for platform programs. Aftermarket kits serve drivers with pain points, but packaging limits reduce broader retrofit reach.
Insights into the Premium Mobility End Use Segment
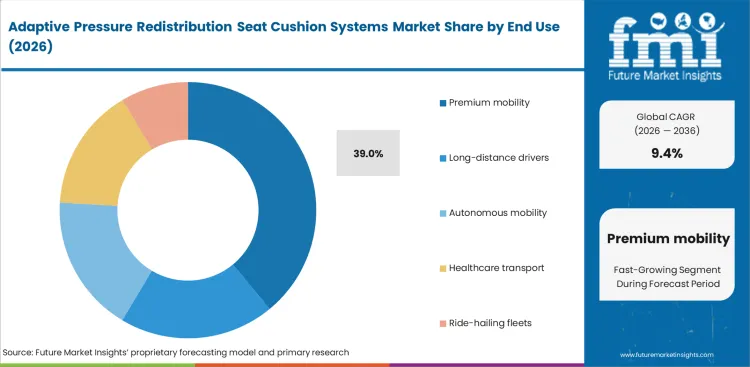
- Premium mobility is expected to account for 39.0% share of end-use demand in 2026. Luxury EVs and business-class cabins use seat comfort as a clear selling point.
- Long-distance driver use follows as a practical category. Ride-hailing and shuttle operators will test cushions where comfort feedback affects repeat use.
Adaptive Pressure Redistribution Seat Cushion Systems Market Drivers, Restraints, and Opportunities
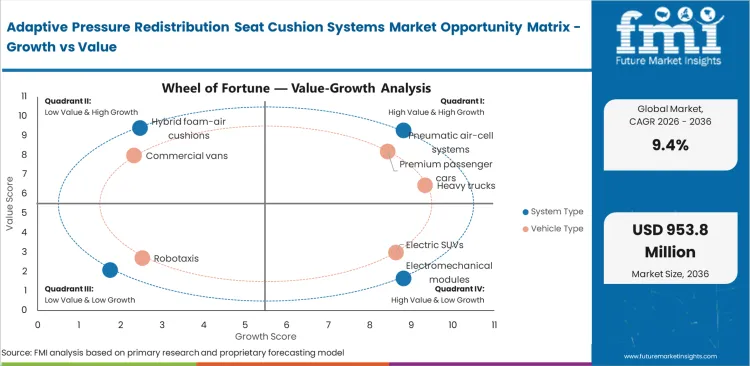
- Comfort software is raising interest in cushions that change pressure based on occupant posture.
- High module cost slows use in mass-market cars since air cells and sensors add validation work.
- Second-row lounge seating creates opportunity as premium EV brands use relaxation features to lift cabin value.
- Thermal and pressure functions are moving together as suppliers package ventilation with active support.
Adaptive Cushion Control Raises Value
Seat comfort is being redesigned around sensing and response instead of one-time adjustment. Lear states that INTU seats are programmed to identify occupant needs or points of discomfort and adjust dynamically. That approach changes the cushion from foam support into a control surface. For OEMs this means the seat must coordinate pressure relief and massage patterns with thermal feel through one user interface. Suppliers that already build seat electronics and power seat switches can turn this into a higher value package.
Cost Limits Mid-Trim Adoption
A market restraint is system cost and seat packaging. Pneumatic cells need valves and small pumps plus hoses and quiet controls inside a narrow cushion stack. Gentherm reported that its Automotive segment generated USD 1,406.3 million in 2024, with revenue gains in lumbar and massage comfort solutions. The figure shows real comfort spending. It also shows that buyers compare active pressure relief with thermal systems and massage. Suppliers need modular designs that reduce part count before this market expands beyond premium trims.
Second-Row Lounge Seats Open Space
Rear-seat comfort is becoming more important as premium EVs use long wheelbases and quieter cabins to sell passenger experience. Magna’s 2024 reconfigurable seating award used fully rotating front seats with long rails and a 270-degree rotation capability for the driver and front passenger seats. That type of cabin architecture raises the value of cushions that respond to relaxed postures and changed seat angles. The clearest opportunity is for suppliers that combine cushion pressure and auto ventilated seats with quiet control in one package.
Analysis of Adaptive Pressure Redistribution Seat Cushion Systems Market by Key Countries
.webp "Top Country Growth Comparison Adaptive Pressure Redistribution Seat Cushion Systems Market Cagr (2026 2036)")
| Country | CAGR |
|---|---|
| United States | 9.5% |
| China | 10.8% |
| India | 9.9% |
| Germany | 9.2% |
| Japan | 8.8% |
| South Korea | 10.1% |
| United Kingdom | 8.4% |
Source: Future Market Insights, 2026.
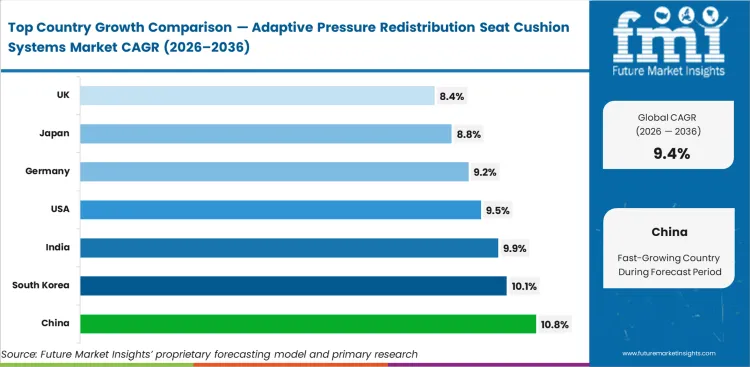
Adaptive Pressure Redistribution Seat Cushion Systems Market CAGR Analysis by Country
- China is projected to record a 10.8% CAGR through 2036 as premium EV brands add wellness seating to local models.
- South Korea is expected to expand at 10.1% CAGR through 2036 since domestic OEMs use cabin software as a brand signal.
- India is forecast to grow at 9.9% CAGR through 2036 as premium utility vehicles add powered comfort features.
- The United States is expected to advance at 9.5% CAGR through 2036 given the scale of long commutes and truck use.
- Germany is projected to rise at 9.2% CAGR through 2036 where premium OEMs test comfort features in EV programs.
- Japan is forecast at 8.8% CAGR through 2036 as domestic suppliers focus on compact mechanisms and quiet actuation.
- The United Kingdom is expected to post 8.4% CAGR through 2036 as lower vehicle output keeps volume below Asia.
The global market is forecast to rise at 9.4% CAGR from 2026 to 2036. China and South Korea are forecast above the global average. India is also estimated to witness significant expansion rate as premium EV and utility vehicle programs use comfort seating to stand out. Japan and the United Kingdom are below the global rate due to smaller production scale.
Demand Outlook for Adaptive Pressure Redistribution Seat Cushion Systems Market in the United States
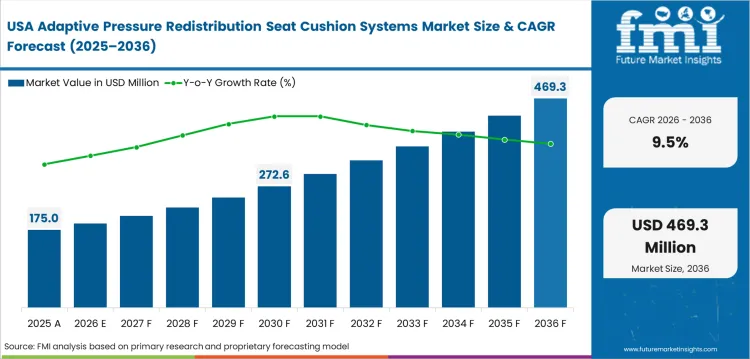
Long daily travel keeps the United States relevant for active cushion suppliers. The United States Census Bureau reported a 27.2 minute mean one-way travel time in 2024. The United States is expected to advance at 9.5% CAGR through 2036 given the scale of long commutes and truck use. Pressure redistribution fits premium pickups and long-range EVs that sell comfort as part of the cabin package.
- Michigan seating suppliers can use Detroit-area OEM links to test pressure cells with powered seat structures.
- California EV programs create a route for app-based comfort settings and automotive interior programs.
- Texas pickup and SUV demand supports front-row driver cushions built for long daily mileage.
Sales Analysis of Adaptive Pressure Redistribution Seat Cushion Systems Market in China
China is the main volume route for active comfort seating. Total auto output reached 34.531 million units in 2025 according to the State Council of China. China is projected to record a 10.8% CAGR through 2036 as premium EV brands add wellness seating to local models. Local OEMs move fast on cockpit features and often treat seat comfort as part of the software-based cabin. Suppliers need local validation and quick tooling support to capture platform programs.
- Shanghai premium EV brands can combine adaptive cushions with screen-based cabin controls.
- Shenzhen electronics clusters support pressure sensors and low-noise control boards for seat modules.
- Hefei and Chongqing vehicle plants give suppliers routes into high-volume electric SUV programs.
Demand Analysis of Adaptive Pressure Redistribution Seat Cushion Systems Market in India
India is producing more higher value passenger vehicles as local manufacturing scale widens. India’s Press Information Bureau reported passenger vehicle production of 53.8 lakh units in January to December 2025. India is forecast to grow at 9.9% CAGR through 2036 as premium utility vehicles add powered comfort features. The first adoption wave is projected to be in higher trim SUVs and fleet vehicles used for long trips.
- Maharashtra auto clusters can support seat integration for utility vehicle platforms.
- Gurugram and Manesar suppliers can connect cushion modules with automotive fabrics and trim programs.
- Tamil Nadu vehicle plants can qualify pressure cushions for export models and domestic premium variants.
Opportunity Analysis of Adaptive Pressure Redistribution Seat Cushion Systems Market in Germany
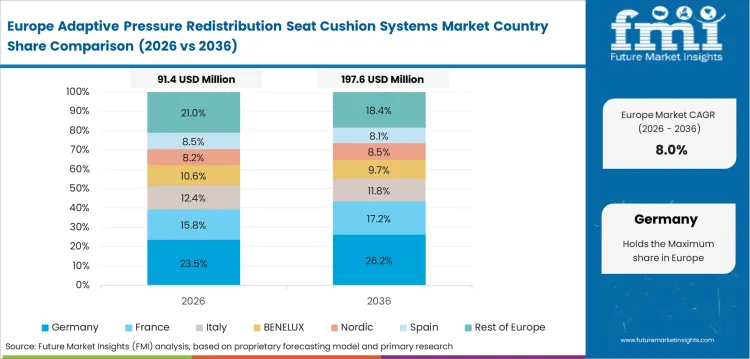
German adoption depends on premium platform planning and supplier engineering depth. Germany Trade and Invest stated in May 2025 that German plants made almost 4.1 million passenger cars in 2024. Germany is projected to rise at 9.2% CAGR through 2036 where premium OEMs test comfort features in EV programs. Cushion suppliers must prove low noise and low weight. Safety compatibility must be clear before serial use. This favors companies with local testing and seat electronics experience.
- Bavaria premium EV programs can use adaptive cushions as part of high-comfort interior packages.
- Stuttgart seat engineering teams need pressure systems that match crash and airbag requirements.
- Saxony electric vehicle plants create demand for lightweight automotive foams and compact cushion modules.
Future Outlook for Adaptive Pressure Redistribution Seat Cushion Systems Market in Japan
Japan’s market is shaped by compact packaging and supplier precision. The Japan Automobile Manufacturers Association reported motor vehicle production of 8.23 million units in 2024. Japan is forecast at 8.8% CAGR through 2036 as domestic suppliers focus on compact mechanisms and quiet actuation. Automakers are predicted to test these systems where seat thickness and reliability are tightly specified.
- Aichi vehicle programs can test compact cushions in Toyota-linked seat platforms.
- Tokyo concept mobility projects give suppliers a route for relaxation seats and cabin software.
- Kyushu production clusters can support smaller modules paired with automotive climate control systems.
Demand Outlook for Adaptive Pressure Redistribution Seat Cushion Systems Market in South Korea
South Korea’s seating opportunity starts from electronics-rich vehicle programs. The Ministry of Trade, Industry and Energy reported electric and low-emission vehicle sales of 76,000 units in February 2026. South Korea is expected to expand at 10.1% CAGR through 2036 since domestic OEMs use cabin software as a brand signal. Pressure redistribution systems suit premium EVs that combine comfort screens and seat climate plus relaxation modes. Supplier success depends on software response and close links with Hyundai and Kia programs.
- Gyeonggi engineering centers can connect pressure sensors with seat memory and display controls.
- Ulsan vehicle output supports factory fitted cushions in premium Hyundai and Genesis trims.
- Seoul mobility design studios can trial rear-seat comfort paired with HVAC blower units and cabin airflow.
In-depth Analysis of Adaptive Pressure Redistribution Seat Cushion Systems Market in the United Kingdom
United Kingdom demand is smaller but useful for premium and specialty vehicle programs. The Society of Motor Manufacturers and Traders said UK vehicle production reached 764,715 units in 2025. The United Kingdom is expected to post 8.4% CAGR through 2036 as lower vehicle output keeps volume below Asia. Premium brands and engineering consultancies still create a route for low-volume systems. The constraint is scale, so suppliers need projects with clear comfort value and export routes.
- Sunderland EV production can use active cushions in export-focused interiors.
- Midlands seat engineering firms can test cushion prototypes for low-volume premium programs.
- Oxford and Gaydon vehicle programs can link seat pressure relief with HVAC ducts and cabin packaging.
Competitive Landscape and Strategic Positioning
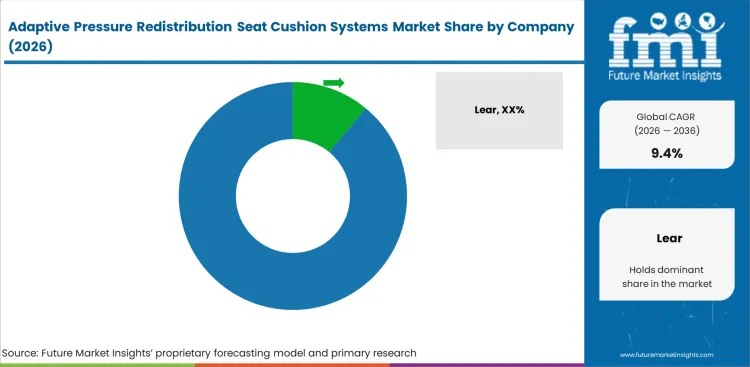
- The market is concentrated around seating integration and cushion control know-how.
- Lear and FORVIA shape system direction through intelligent seating and pneumatic comfort functions.
- Specialist suppliers compete with air bladders and valves. Low-noise control modules create the next selection point.
- Entry barriers include crash compatibility and seat trim durability. Actuator life and OEM validation time add further checks.
Lear is one of the clearest competitors in intelligent seat comfort.
The competitive landscape for adaptive pressure redistribution seat cushion systems is shaped by a mix of full-seat integrators and specialists with strengths in comfort electronics, and seat architecture. Lear holds a strong position in intelligent seat comfort, with the ability to integrate active cushion systems alongside heating and active safety logic. This gives Lear a route to combine active cushions with heat and ventilation plus active safety systems logic. Companies such as FORVIA bring a different strength through pneumatic comfort and seat architecture. Its intelligent seating content describes a Transformer Seat that adjusts up to 10 parameters based on occupant shape and driving conditions.
Players such as Adient and Magna focus on seat structure and cabin layout positions. Magna won a 2024 contract for a reconfigurable seating system with rotating seats and long rails for a Chinese OEM. These moves show that comfort is moving beyond a static front-row setting. Suppliers that connect pressure relief with car seat accessories and premium trim can address both OEM and specialty channels.
Gentherm and AUMOVIO are focusing around electronics and actuation. Brose adds seat adjustment and mechatronic system depth. Gentherm reported revenue gains in lumbar and massage comfort solutions within its 2024 automotive results. AUMOVIO lists pneumatic seat systems under seat comfort systems. These developments indicate that suppliers linking pressure redistribution with advanced seat configurations and premium trim solutions can compete across both OEM and specialized mobility applications.
Key Companies in the Adaptive Pressure Redistribution Seat Cushion Systems Market
Competition is best read by role because seat integration, pneumatic actuation, and electronics capability differ across suppliers.
- Seat System Integrators: Lear, FORVIA and Adient compete through complete seat programs and OEM platform access. Magna, Toyota Boshoku and Hyundai Transys add seat architecture depth. Their advantage comes from seat frame packaging and trim integration.
- Comfort Module Specialists: Gentherm and AUMOVIO compete around actuation and thermal comfort. Brose and Leggett & Platt add pneumatic control and seat mechanism depth.
- Material and Cushion Partners: Dow and Woodbridge support the cushioning layer behind active pressure control. Specialty foam or bladder makers add material depth. Partnerships with seating integrators will matter as soft trim interior materials move toward lighter cushion stacks.
Competitive Benchmarking: Adaptive Pressure Redistribution Seat Cushion Systems Market
| Company | Seat Integration Depth | Pneumatic Control Depth | Comfort Software Readiness | Geographic Footprint |
|---|---|---|---|---|
| Lear | High | Strong | Strong | Global with North America and Europe OEM depth |
| FORVIA | High | Strong | Strong | Global with Europe and China seating depth |
| Adient | High | Medium | Strong | Global with high-volume seating programs |
| Magna | High | Medium | Medium | Global with China reconfigurable seating award |
| Toyota Boshoku | High | Medium | Medium | Japan centered with Toyota-linked platform access |
| Gentherm | Medium | High | Strong | Global with thermal and pneumatic comfort focus |
| AUMOVIO | Medium | High | Medium | Europe centered with seat electronics and controls |
| Brose | Medium | Medium | Medium | Europe centered with seat adjustment mechanisms |
| Hyundai Transys | High | Medium | Medium | South Korea centered with Hyundai and Kia depth |
| Leggett & Platt | Medium | Medium | Low | North America centered with seat mechanisms and components |
Source: Future Market Insights competitive analysis, 2026. Ratings reflect relative positioning based on seat integration depth and pneumatic control depth. Comfort software readiness is assessed separately.
Key Developments in Adaptive Pressure Redistribution Seat Cushion Systems Market
- In February 2025, Lear announced ComfortMax Seat engineering integration with General Motors. The launch supports trim-integrated comfort modules that can host pressure and thermal functions.
- In July 2025, Adient launched a mechanical massage seat solution in GAC-Trumpchi’s M8 PHEV. The system points to higher comfort content in three-row vehicles.
- In October 2025, Toyota Boshoku showcased a Relaxation and safety Seat for Japan Mobility Show. The concept supports comfort features for future mobility spaces.
Key Players in the Adaptive Pressure Redistribution Seat Cushion Systems Market
Seat System Integrators:
- Lear
- FORVIA
- Adient
- Magna
- Toyota Boshoku
- Hyundai Transys
Comfort Module Specialists:
- Gentherm
- AUMOVIO
- Brose
- Leggett & Platt
Material and Cushion Partners:
- Dow
- Woodbridge
- TS TECH
- Tata AutoComp Systems
Report Scope and Coverage
| Parameter | Details |
|---|---|
| Quantitative Units | USD 388.4 million to USD 953.8 million, at 9.4% CAGR |
| Market Definition | Active vehicle seat cushion systems that change pressure distribution under the occupant during use |
| System Type | Pneumatic air-cell systems, Electromechanical cushion modules, Hybrid foam-air cushions, Sensor feedback pads |
| Vehicle Type | Premium passenger cars, Electric SUVs, Commercial vans, Robotaxis, Heavy trucks |
| Control Mode | Pressure-sensor adaptive control, Preset comfort programs, App-linked personalization, Manual-assisted control |
| Seat Position | Front-row cushions, Second-row lounge cushions, Driver long-haul cushions, Other seats |
| Sales Channel | OEM integrated systems, Tier 1 module supply, Aftermarket retrofit kits |
| End Use | Premium mobility, Long-distance drivers, Autonomous mobility, Healthcare-related transport, Ride-hailing fleets |
| Regions Covered | North America, Latin America, Western Europe, Eastern Europe, East Asia, South Asia and Pacific, Middle East and Africa |
| Countries Covered | United States, China, India, Germany, Japan, South Korea, United Kingdom, and 30+ countries |
| Key Companies Profiled | Lear, FORVIA, Adient, Magna, Gentherm, Toyota Boshoku, AUMOVIO, Brose, Hyundai Transys, Leggett & Platt |
| Forecast Period | 2026 to 2036 |
| Approach | Hybrid bottom-up and top-down methodology using vehicle output, premium seat fitment, module pricing, and country adoption rates |
Source: Future Market Insights, 2026.
Adaptive Pressure Redistribution Seat Cushion Systems Market Breakdown by System Type, Vehicle Type, Control Mode, Seat Position, Sales Channel, End Use, and Region
Adaptive Pressure Redistribution Seat Cushion Systems Market Segmented by System Type:
- Pneumatic air-cell systems
- Electromechanical modules
- Hybrid foam-air cushions
- Sensor feedback pads
Adaptive Pressure Redistribution Seat Cushion Systems Market Segmented by Vehicle Type:
- Premium passenger cars
- Electric SUVs
- Commercial vans
- Robotaxis
- Heavy trucks
Adaptive Pressure Redistribution Seat Cushion Systems Market Segmented by Control Mode:
- Pressure-sensor control
- Preset programs
- App personalization
- Manual-assisted control
Adaptive Pressure Redistribution Seat Cushion Systems Market Segmented by Seat Position:
- Front-row cushions
- Second-row cushions
- Driver cushions
- Other seats
Adaptive Pressure Redistribution Seat Cushion Systems Market Segmented by Sales Channel:
- OEM integrated systems
- Tier 1 modules
- Aftermarket kits
Adaptive Pressure Redistribution Seat Cushion Systems Market Segmented by End Use:
- Premium mobility
- Long-distance drivers
- Autonomous mobility
- Healthcare transport
- Ride-hailing fleets
Adaptive Pressure Redistribution Seat Cushion Systems Market by Region:
- North America
- United States
- Canada
- Mexico
- Latin America
- Brazil
- Chile
- Rest of Latin America
- Western Europe
- Germany
- United Kingdom
- Italy
- Spain
- France
- Nordic
- BENELUX
- Rest of Western Europe
- Eastern Europe
- Russia
- Poland
- Hungary
- Balkan and Baltic
- Rest of Eastern Europe
- East Asia
- China
- Japan
- South Korea
- South Asia and Pacific
- India
- ASEAN
- Australia and New Zealand
- Rest of South Asia and Pacific
- Middle East and Africa
- Kingdom of Saudi Arabia
- Other GCC Countries
- Turkiye
- South Africa
- Other African Union
- Rest of Middle East and Africa
Research Sources and Bibliography
- United States Census Bureau. (2025, September 22). American Community Survey 1-year estimates: Commuting guidance. United States Census Bureau.
- International Energy Agency. (2025, May 14). Global EV Outlook 2025. International Energy Agency.
- State Council of the People’s Republic of China. (2026, January 14). China’s auto output and sales reach new highs in 2025. State Council of the People’s Republic of China.
- Press Information Bureau. (2026, February 10). Status of heavy industries sector. Government of India.
- Germany Trade and Invest. (2025, May 20). The automotive industry in Germany. Germany Trade and Invest.
- Japan Automobile Manufacturers Association. (2025, September 26). The Motor Industry of Japan 2025. Japan Automobile Manufacturers Association.
- Society of Motor Manufacturers and Traders. (2026, January 29). Tough year for Auto but new models and Industrial Strategy can deliver growth. Society of Motor Manufacturers and Traders.
- Ministry of Trade, Industry and Energy. (2026, March 19). February 2026 automobile exports reach USD 4.8 billion. Government of the Republic of Korea.
- Lear Corporation. (2025, February 5). Lear integrates ComfortMax Seat engineering technology with General Motors. Lear Corporation.
- FORVIA. (2024, September 17). Mobility experiences that matter to people. FORVIA.
- Adient plc. (2025, July 15). Adient launches mechanical massage seating innovation. Adient plc.
- Magna International Inc. (2024, June 18). Magna awarded reconfigurable seating business with Chinese OEM. Magna International Inc.
- Gentherm Incorporated. (2025, February 19). Gentherm reports 2024 fourth quarter and full year results. Gentherm Incorporated.
- Toyota Boshoku Corporation. (2025, October 30). Toyota Boshoku exhibits at Japan Mobility Show 2025. Toyota Boshoku Corporation.
The bibliography uses government, trade body, company, and official technical sources relevant to vehicle seating and cabin comfort demand signals.
This Report Answers
- What is the current and future size of the adaptive pressure redistribution seat cushion systems market?
- How fast is the adaptive pressure redistribution seat cushion systems market expected to expand between 2026 and 2036?
- Which system type is projected to account for the leading share in 2026?
- Which vehicle type is expected to use adaptive pressure redistribution cushion systems first?
- Why are pneumatic air-cell cushions important for comfort seating programs?
- How do pressure sensors and control modules affect market value?
- Which countries are forecast to record faster demand during the assessment period?
- Who are the main companies active in adaptive pressure redistribution seat cushion systems?
- How does FMI define the adaptive pressure redistribution seat cushion systems scope?
- How does FMI estimate and validate the adaptive cushion systems forecast?
Frequently Asked Questions
What is the global market demand for Adaptive Pressure Redistribution Seat Cushion Systems in 2026?
In 2026, the global adaptive pressure redistribution seat cushion systems market is expected to be worth USD 388.4 million as OEM fitment expands.
How big will the Adaptive Pressure Redistribution Seat Cushion Systems Market be in 2036?
By 2036, the adaptive pressure redistribution seat cushion systems market is expected to be worth USD 953.8 million as active comfort functions widen.
How much is demand for Adaptive Pressure Redistribution Seat Cushion Systems expected to expand between 2026 and 2036?
Demand for adaptive pressure redistribution seat cushion systems is projected to expand at 9.4% CAGR between 2026 and 2036.
Which system type is expected to lead the Adaptive Pressure Redistribution Seat Cushion Systems Market in 2026?
Pneumatic air-cell systems are projected to lead with 42.0% share in 2026 as air bladders adjust pressure with compact hardware.
Which sales channel is expected to lead the Adaptive Pressure Redistribution Seat Cushion Systems Market in 2026?
OEM integrated systems are expected to lead with 64.0% share in 2026 since factory installation reduces fitment and warranty risk.
Which country is expected to grow fastest in the Adaptive Pressure Redistribution Seat Cushion Systems Market?
China is expected to grow fastest at 10.8% CAGR through 2036 as premium EV brands add wellness seating functions.
What does the Adaptive Pressure Redistribution Seat Cushion Systems Market include?
The market includes active vehicle cushion systems with air cells and sensors. It also includes actuators, valves and software that change pressure under the occupant.
How does FMI forecast the Adaptive Pressure Redistribution Seat Cushion Systems Market?
FMI uses vehicle output and premium seat fitment to validate its 2026 to 2036 forecast. Supplier portfolios, system pricing and primary interviews support the checks.
Which adaptive seat cushion system is best for long-distance drivers?
Pneumatic air-cell cushions suit long-distance drivers because they shift pressure points during travel and reduce repeated load on one cushion area.
Preview the report firsthand - request a free sample
Get SampleGet the brochure for pricing and purchase details.
Get PDFTable of Content
- Key Takeaways
- Market Size and CAGR
- Top Growth Driver
- Fastest Growing Segment
- Leading Region
- Key Companies
- Emerging Opportunities
- Executive Summary
- Global Market Outlook
- Demand-side Trends
- Supply-side Trends
- Technology Roadmap Analysis
- Analysis and Recommendations
- Analyst Perspective (What is happening? Why now? What should investors know?)
- Key Questions Answered
- How large is the market?
- What is the CAGR?
- What are key trends?
- Which region dominates?
- Who are the leaders?
- Market Overview
- Market Coverage / Taxonomy
- Market Definition / Scope / Limitations
- Research Methodology
- Chapter Orientation
- Analytical Lens and Working Hypotheses
- Market Structure, Signals, and Trend Drivers
- Benchmarking and Cross-market Comparability
- Market Sizing, Forecasting, and Opportunity Mapping
- Research Design and Evidence Framework
- Desk Research Programme (Secondary Evidence)
- Expert Input and Fieldwork (Primary Evidence)
- Tooling, Models, and Reference Databases
- Data Engineering and Model Build
- Quality Assurance and Audit Trail
- Market Background
- Market Dynamics (Drivers, Restraints, Opportunity, Trends)
- Scenario Forecast (Optimistic, Likely, Conservative)
- Impact Analysis
- AI Impact
- Sustainability Impact
- Regulatory Impact
- Technology Impact
- Consumer / Buyer Analysis
- Purchase Drivers
- Adoption Barriers
- Buyer Journey
- Opportunity Map Analysis
- Product Life Cycle Analysis
- Supply Chain Analysis
- Investment Feasibility Matrix
- Value Chain Analysis
- PESTLE and Porter's Analysis
- Regulatory Landscape
- Regional Parent Market Outlook
- Production and Consumption Statistics
- Import and Export Statistics
- Global Market Analysis and Forecast, 2021 to 2036
- Historical Market Size Value (USD Million) & Volume (Unit) Analysis, 2021 to 2025
- Current and Future Market Size Value (USD Million) & Volume (Unit) Projections, 2026 to 2036
- Y-o-Y Growth Trend Analysis
- Absolute $ Opportunity Analysis
- Global Market Pricing Analysis, 2021 to 2036
- Global Market Analysis and Forecast, By System Type, 2021 to 2036
- Introduction / Key Findings
- Historical Market Size Value (USD Million) & Volume (Unit) Analysis By System Type, 2021 to 2025
- Current and Future Market Size Value (USD Million) & Volume (Unit) Analysis and Forecast By System Type, 2026 to 2036
- Pneumatic air-cell systems
- Electromechanical modules
- Hybrid foam-air cushions
- Sensor feedback pads
- Pneumatic air-cell systems
- Y-o-Y Growth Trend Analysis By System Type, 2021 to 2025
- Absolute $ Opportunity Analysis By System Type, 2026 to 2036
- Global Market Analysis and Forecast, By Vehicle Type, 2021 to 2036
- Introduction / Key Findings
- Historical Market Size Value (USD Million) & Volume (Unit) Analysis By Vehicle Type, 2021 to 2025
- Current and Future Market Size Value (USD Million) & Volume (Unit) Analysis and Forecast By Vehicle Type, 2026 to 2036
- Premium passenger cars
- Electric SUVs
- Commercial vans
- Robotaxis
- Heavy trucks
- Premium passenger cars
- Y-o-Y Growth Trend Analysis By Vehicle Type, 2021 to 2025
- Absolute $ Opportunity Analysis By Vehicle Type, 2026 to 2036
- Global Market Analysis and Forecast, By Control Mode, 2021 to 2036
- Introduction / Key Findings
- Historical Market Size Value (USD Million) & Volume (Unit) Analysis By Control Mode, 2021 to 2025
- Current and Future Market Size Value (USD Million) & Volume (Unit) Analysis and Forecast By Control Mode, 2026 to 2036
- Pressure-sensor control
- Preset programs
- App personalization
- Manual-assisted control
- Pressure-sensor control
- Y-o-Y Growth Trend Analysis By Control Mode, 2021 to 2025
- Absolute $ Opportunity Analysis By Control Mode, 2026 to 2036
- Global Market Analysis and Forecast, By Seat Position, 2021 to 2036
- Introduction / Key Findings
- Historical Market Size Value (USD Million) & Volume (Unit) Analysis By Seat Position, 2021 to 2025
- Current and Future Market Size Value (USD Million) & Volume (Unit) Analysis and Forecast By Seat Position, 2026 to 2036
- Front-row cushions
- Second-row cushions
- Driver cushions
- Other seats
- Front-row cushions
- Y-o-Y Growth Trend Analysis By Seat Position, 2021 to 2025
- Absolute $ Opportunity Analysis By Seat Position, 2026 to 2036
- Global Market Analysis and Forecast, By Sales Channel, 2021 to 2036
- Introduction / Key Findings
- Historical Market Size Value (USD Million) & Volume (Unit) Analysis By Sales Channel, 2021 to 2025
- Current and Future Market Size Value (USD Million) & Volume (Unit) Analysis and Forecast By Sales Channel, 2026 to 2036
- OEM integrated systems
- Tier 1 modules
- Aftermarket kits
- OEM integrated systems
- Y-o-Y Growth Trend Analysis By Sales Channel, 2021 to 2025
- Absolute $ Opportunity Analysis By Sales Channel, 2026 to 2036
- Global Market Analysis and Forecast, By End Use
- Introduction / Key Findings
- Historical Market Size Value (USD Million) & Volume (Unit) Analysis By End Use, 2021 to 2025
- Current and Future Market Size Value (USD Million) & Volume (Unit) Analysis and Forecast By End Use, 2026 to 2036
- Premium mobility
- Long-distance drivers
- Autonomous mobility
- Healthcare transport
- Ride-hailing fleets
- Premium mobility
- Y-o-Y Growth Trend Analysis By End Use, 2021 to 2025
- Absolute $ Opportunity Analysis By End Use, 2026 to 2036
- Global Market Analysis and Forecast, By Region, 2021 to 2036
- Introduction
- Historical Market Size Value (USD Million) & Volume (Unit) Analysis By Region, 2021 to 2025
- Current Market Size Value (USD Million) & Volume (Unit) Analysis and Forecast By Region, 2026 to 2036
- North America
- Latin America
- Western Europe
- Eastern Europe
- East Asia
- South Asia and Pacific
- Middle East & Africa
- Market Attractiveness Analysis By Region
- North America Market Analysis and Forecast, By Country, 2021 to 2036
- Historical Market Size Value (USD Million) & Volume (Unit) Trend Analysis By Market Taxonomy, 2021 to 2025
- Market Size Value (USD Million) & Volume (Unit) Forecast By Market Taxonomy, 2026 to 2036
- By Country
- USA
- Canada
- Mexico
- By System Type
- By Vehicle Type
- By Control Mode
- By Seat Position
- By Sales Channel
- By End Use
- By Country
- Market Attractiveness Analysis
- By Country
- By System Type
- By Vehicle Type
- By Control Mode
- By Seat Position
- By Sales Channel
- By End Use
- Key Takeaways
- Latin America Market Analysis and Forecast, By Country
- Historical Market Size Value (USD Million) & Volume (Unit) Trend Analysis By Market Taxonomy, 2021 to 2025
- Market Size Value (USD Million) & Volume (Unit) Forecast By Market Taxonomy, 2026 to 2036
- By Country
- Brazil
- Chile
- Rest of Latin America
- By System Type
- By Vehicle Type
- By Control Mode
- By Seat Position
- By Sales Channel
- By End Use
- By Country
- Market Attractiveness Analysis
- By Country
- By System Type
- By Vehicle Type
- By Control Mode
- By Seat Position
- By Sales Channel
- By End Use
- Key Takeaways
- Western Europe Market Analysis and Forecast, By Country
- Historical Market Size Value (USD Million) & Volume (Unit) Trend Analysis By Market Taxonomy, 2021 to 2025
- Market Size Value (USD Million) & Volume (Unit) Forecast By Market Taxonomy, 2026 to 2036
- By Country
- Germany
- UK
- Italy
- Spain
- France
- Nordic
- BENELUX
- Rest of Western Europe
- By System Type
- By Vehicle Type
- By Control Mode
- By Seat Position
- By Sales Channel
- By End Use
- By Country
- Market Attractiveness Analysis
- By Country
- By System Type
- By Vehicle Type
- By Control Mode
- By Seat Position
- By Sales Channel
- By End Use
- Key Takeaways
- Eastern Europe Market Analysis and Forecast, By Country
- Historical Market Size Value (USD Million) & Volume (Unit) Trend Analysis By Market Taxonomy, 2021 to 2025
- Market Size Value (USD Million) & Volume (Unit) Forecast By Market Taxonomy, 2026 to 2036
- By Country
- Russia
- Poland
- Hungary
- Balkan & Baltic
- Rest of Eastern Europe
- By System Type
- By Vehicle Type
- By Control Mode
- By Seat Position
- By Sales Channel
- By End Use
- By Country
- Market Attractiveness Analysis
- By Country
- By System Type
- By Vehicle Type
- By Control Mode
- By Seat Position
- By Sales Channel
- By End Use
- Key Takeaways
- East Asia Market Analysis and Forecast, By Country
- Historical Market Size Value (USD Million) & Volume (Unit) Trend Analysis By Market Taxonomy, 2021 to 2025
- Market Size Value (USD Million) & Volume (Unit) Forecast By Market Taxonomy, 2026 to 2036
- By Country
- China
- Japan
- South Korea
- By System Type
- By Vehicle Type
- By Control Mode
- By Seat Position
- By Sales Channel
- By End Use
- By Country
- Market Attractiveness Analysis
- By Country
- By System Type
- By Vehicle Type
- By Control Mode
- By Seat Position
- By Sales Channel
- By End Use
- Key Takeaways
- South Asia and Pacific Market Analysis and Forecast, By Country
- Historical Market Size Value (USD Million) & Volume (Unit) Trend Analysis By Market Taxonomy, 2021 to 2025
- Market Size Value (USD Million) & Volume (Unit) Forecast By Market Taxonomy, 2026 to 2036
- By Country
- India
- ASEAN
- Australia & New Zealand
- Rest of South Asia and Pacific
- By System Type
- By Vehicle Type
- By Control Mode
- By Seat Position
- By Sales Channel
- By End Use
- By Country
- Market Attractiveness Analysis
- By Country
- By System Type
- By Vehicle Type
- By Control Mode
- By Seat Position
- By Sales Channel
- By End Use
- Key Takeaways
- Middle East & Africa Market Analysis and Forecast, By Country
- Historical Market Size Value (USD Million) & Volume (Unit) Trend Analysis By Market Taxonomy, 2021 to 2025
- Market Size Value (USD Million) & Volume (Unit) Forecast By Market Taxonomy, 2026 to 2036
- By Country
- Kingdom of Saudi Arabia
- Other GCC Countries
- Türkiye
- South Africa
- Other African Union
- Rest of Middle East & Africa
- By System Type
- By Vehicle Type
- By Control Mode
- By Seat Position
- By Sales Channel
- By End Use
- By Country
- Market Attractiveness Analysis
- By Country
- By System Type
- By Vehicle Type
- By Control Mode
- By Seat Position
- By Sales Channel
- By End Use
- Key Takeaways
- Key Countries Market Analysis
- USA
- Pricing Analysis
- Market Share Analysis, 2025
- By System Type
- By Vehicle Type
- By Control Mode
- By Seat Position
- By Sales Channel
- By End Use
- Canada
- Pricing Analysis
- Market Share Analysis, 2025
- By System Type
- By Vehicle Type
- By Control Mode
- By Seat Position
- By Sales Channel
- By End Use
- Mexico
- Pricing Analysis
- Market Share Analysis, 2025
- By System Type
- By Vehicle Type
- By Control Mode
- By Seat Position
- By Sales Channel
- By End Use
- Brazil
- Pricing Analysis
- Market Share Analysis, 2025
- By System Type
- By Vehicle Type
- By Control Mode
- By Seat Position
- By Sales Channel
- By End Use
- Chile
- Pricing Analysis
- Market Share Analysis, 2025
- By System Type
- By Vehicle Type
- By Control Mode
- By Seat Position
- By Sales Channel
- By End Use
- Germany
- Pricing Analysis
- Market Share Analysis, 2025
- By System Type
- By Vehicle Type
- By Control Mode
- By Seat Position
- By Sales Channel
- By End Use
- UK
- Pricing Analysis
- Market Share Analysis, 2025
- By System Type
- By Vehicle Type
- By Control Mode
- By Seat Position
- By Sales Channel
- By End Use
- Italy
- Pricing Analysis
- Market Share Analysis, 2025
- By System Type
- By Vehicle Type
- By Control Mode
- By Seat Position
- By Sales Channel
- By End Use
- Spain
- Pricing Analysis
- Market Share Analysis, 2025
- By System Type
- By Vehicle Type
- By Control Mode
- By Seat Position
- By Sales Channel
- By End Use
- France
- Pricing Analysis
- Market Share Analysis, 2025
- By System Type
- By Vehicle Type
- By Control Mode
- By Seat Position
- By Sales Channel
- By End Use
- India
- Pricing Analysis
- Market Share Analysis, 2025
- By System Type
- By Vehicle Type
- By Control Mode
- By Seat Position
- By Sales Channel
- By End Use
- ASEAN
- Pricing Analysis
- Market Share Analysis, 2025
- By System Type
- By Vehicle Type
- By Control Mode
- By Seat Position
- By Sales Channel
- By End Use
- Australia & New Zealand
- Pricing Analysis
- Market Share Analysis, 2025
- By System Type
- By Vehicle Type
- By Control Mode
- By Seat Position
- By Sales Channel
- By End Use
- China
- Pricing Analysis
- Market Share Analysis, 2025
- By System Type
- By Vehicle Type
- By Control Mode
- By Seat Position
- By Sales Channel
- By End Use
- Japan
- Pricing Analysis
- Market Share Analysis, 2025
- By System Type
- By Vehicle Type
- By Control Mode
- By Seat Position
- By Sales Channel
- By End Use
- South Korea
- Pricing Analysis
- Market Share Analysis, 2025
- By System Type
- By Vehicle Type
- By Control Mode
- By Seat Position
- By Sales Channel
- By End Use
- Russia
- Pricing Analysis
- Market Share Analysis, 2025
- By System Type
- By Vehicle Type
- By Control Mode
- By Seat Position
- By Sales Channel
- By End Use
- Poland
- Pricing Analysis
- Market Share Analysis, 2025
- By System Type
- By Vehicle Type
- By Control Mode
- By Seat Position
- By Sales Channel
- By End Use
- Hungary
- Pricing Analysis
- Market Share Analysis, 2025
- By System Type
- By Vehicle Type
- By Control Mode
- By Seat Position
- By Sales Channel
- By End Use
- Kingdom of Saudi Arabia
- Pricing Analysis
- Market Share Analysis, 2025
- By System Type
- By Vehicle Type
- By Control Mode
- By Seat Position
- By Sales Channel
- By End Use
- Türkiye
- Pricing Analysis
- Market Share Analysis, 2025
- By System Type
- By Vehicle Type
- By Control Mode
- By Seat Position
- By Sales Channel
- By End Use
- South Africa
- Pricing Analysis
- Market Share Analysis, 2025
- By System Type
- By Vehicle Type
- By Control Mode
- By Seat Position
- By Sales Channel
- By End Use
- USA
- Market Structure Analysis
- Competition Dashboard
- Competition Benchmarking
- Market Share Analysis of Top Players
- By Regional
- By System Type
- By Vehicle Type
- By Control Mode
- By Seat Position
- By Sales Channel
- By End Use
- Emerging Startups
- Innovation Benchmarking
- Competition Analysis
- Competition Deep Dive
- Lear
- Overview
- Product Portfolio
- Profitability by Market Segments (Product/Region/Sales Channel)
- Sales Footprint
- Strategy Overview
- Marketing Strategy
- Product Strategy
- Channel Strategy
- FORVIA
- Adient
- Magna
- Toyota Boshoku
- Gentherm
- AUMOVIO
- Brose
- Hyundai Transys
- Leggett & Platt
- Lear
- Case Studies
- Success Stories
- Recent Developments
- Competition Deep Dive
- Assumptions & Acronyms Used


