
- Market Size (2026)
- USD 2.2 Bn
- Forecast (2036)
- USD 5.3 Bn
- CAGR (2026 to 2036)
- 9.1%
How Big Is the Anemia Supplements Market in 2026?
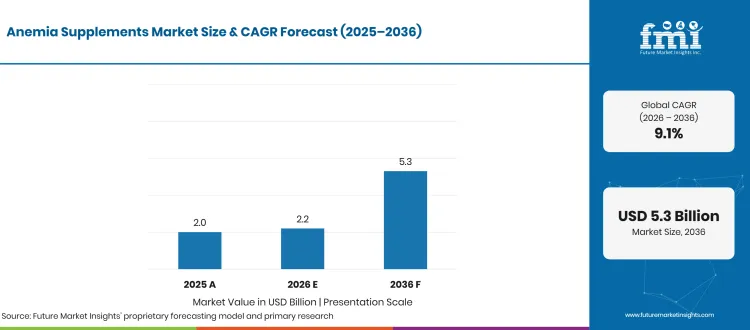
Global anemia supplements market recorded a valuation of USD 2.0 billion in 2025, climbed to USD 2.2 billion in 2026, and is projected to reach USD 5.3 billion by 2036, expanding at a steady 9.1% CAGR over the forecast decade. Accelerating clinical diagnosis and expanding preventative maternal care generate an incremental market opportunity of USD 3.1 billion. Retail pharmacies and direct healthcare channels anchor this long-term sales momentum through extended iron repletion courses.
| Market Metric | Valuation / Share / Forecast Benchmark |
|---|---|
| 2025 Market Size (Historical) | USD 2.0 billion |
| 2026 Market Size (Estimated) | USD 2.2 billion |
| 2036 Market Size (Projected) | USD 5.3 billion |
| Compound Annual Growth Rate (2026 to 2036) | 9.1% CAGR |
| Incremental Dollar Opportunity (2026 to 2036) | USD 3.1 billion |
| Dominant Product Segment (2026 Share) | Ferrous Fumarate (38.0% share in 2026) | Other Segment Combined (62.0%) |
| Leading Application Segment (2026 Share) | Iron Deficiency Anemia (IDA) Treatment (42.0% share in 2026) | Other Segment Combined (58.0%) |
| Leading Form Segment (2026 Share) | Tablets (49.0% share in 2026) | Other Segment Combined (51.0%) |
| Leading Distribution Channel (2026 Share) | Brick and Mortar (34.0% share in 2026) | Other Segment Combined (66.0%) |
| Fastest-Growing Country Markets (2026 to 2036) | Germany (10.6% CAGR), UK (10.3% CAGR), China (10.0% CAGR) |
| Leading Tier-1 Companies | Vitabiotics Ltd., Pharmavite, NovaFerrum, Floradix, VESPYR Brands, Inc., Solgar, Pure Encapsulations, Garden of Life LLC, MegaFood, Thorne |
Source: Future Market Insights analysis of the anemia supplements market, 2026.
Executive Market Overview
Maternal healthcare initiatives and routine blood diagnostic screenings are driving widespread clinical adoption of oral iron supplements, encouraging medical providers to recommend bioavailable formulations that minimize stomach discomfort. Patient compliance depends heavily on balancing elemental iron potency with gastrointestinal comfort across women's health supplements and prenatal vitamin supplements, especially since standard iron salts frequently trigger therapy drop-off. Clinical tracking from the World Health Organization (February 2025) indicates that anemia affects 30% of women aged 15 to 49 along with 37% of pregnant patients. Widespread clinical screening creates steady commercial demand for gentle iron compounds across public health networks and private retail dispensaries.
While conventional ferrous salts anchor first-line pharmacy dispensing, supplement brands are expanding dollar margins through chelated iron bisglycinate capsules and measured pediatric drops. Formulators pairing gentle iron chelates with vitamin C and folic acid formulations achieve superior patient adherence across retail pharmacies and recurring consumer subscriptions. Demonstrating this operational focus, Press Information Bureau, India (August 2026) updated national Anemia Mukt Bharat Abhiyaan guidelines to prioritize systematic screening and oral supplementation, while Pharmavite (May 2025) invested USD 250 million in its New Albany facility to expand domestic manufacturing. Market valuation measures commercial sales of solid tablets and oral liquid drops, while excluding intravenous infusions and fortified staple foods.
This Report Answers
- How large the anemia supplements market is in 2026 and what it reaches by 2036
- Which product, application, form and distribution channel segments lead in 2026
- What is driving demand and what is holding the category back
- Which countries grow fastest between 2026 and 2036
- What Vitabiotics Ltd. and other leading players have launched
- How the anemia supplements market is defined, segmented and measured
Analyst Perspective
"Oral anemia supplement makers will capture faster value growth by formulating non-constipating chelated capsules and calibrated pediatric liquid drops that keep patients on therapy through full ferritin repletion. The primary commercial restraint is gastrointestinal discontinuation on unbuffered ferrous salts and strict European and Japanese regulatory boundaries against unverified fatigue claims."
- Anurag Sharma, Principal Consultant, Future Market Insights (FMI)
Key Market Trends & Insights
- Shift Toward Chelated Bisglycinate and Whole-Food Iron for Digestive Compliance: Clinicians and retail pharmacists increasingly recommend amino-acid chelated iron to patients who discontinue conventional ferrous sulfate due to gastric upset. Chelated and food-fermented iron products capture premium retail pricing within fertility supplements, reflecting higher treatment completion rates among reproductive-age women. Product registrations in the National Institutes of Health, Office of Dietary Supplements (January 2025) document Thorne Iron Bisglycinate delivering 25 mg elemental iron per capsule with NSF verification, while National Institutes of Health, Office of Dietary Supplements (February 2025) notes Garden of Life Vitamin Code Raw Iron vegan capsules with 28 mg non-binding iron. Superior digestive tolerance encourages consumers to maintain multi-month therapy regimens.
- Age-Stratified National Dietary Reference Updates Refine Target Dosing: Public health authorities in Europe and East Asia are revising daily iron intake recommendations to distinguish menstruating women from older adults. Updated life-stage guidelines prompt supplement manufacturers to introduce differentiated product potencies across vitamin and mineral supplements. Official reports from the Japan Ministry of Health, Labour and Welfare (February 2025) for Dietary Reference Intakes calibrate iron targets by menstruation and pregnancy stage, while German Nutrition Society (September 2025) guidelines mandate verified blood deficiency before high-dose supplementation. Targeted dosage strengths replace generic multivitamins with specialized therapeutic formulas.
- Subscription Replenishment and Packaging Clarity Support 90-Day Repletion Courses: Restoring depleted serum ferritin levels requires several months of continuous supplementation, making multi-pack subscriptions and prominent elemental iron labeling commercially decisive. Direct auto-ship delivery models and clear salt labeling prevent patient drop-off by clarifying the difference between high-potency ferrous sulfate and gentle chelates. Packaging renewals by VESPYR Brands, Inc. (2025) for Feosol Original help consumers identify appropriate elemental strengths, while Vitabiotics Ltd. (2026) expands recurring delivery options for Feroglobin lines. Convenient auto-delivery schedules ensure patients complete full repletion therapies without missing daily doses.
What Are the Main Drivers, Restraints, and Opportunities?
High maternal and female iron-deficiency prevalence and structured national screening guidelines drive sustained oral iron courses, whereas dose-dependent gastrointestinal side effects restrain adherence, creating growth opportunities for pediatric liquid drops and chelated formulations.
Driver: High Global Maternal Anemia Prevalence and Antenatal Screening Protocols
Routine hemoglobin and ferritin evaluations during prenatal visits directly translate clinical diagnoses into recurring multi-month supplement sales. Standardized antenatal care guidelines secure predictable prescription volume across retail pharmacies by recommending therapeutic iron doses paired with complementary vitamins and minerals. Clinical documentation from the World Health Organization (February 2025) indicates that pregnancy elevates iron demand substantially to support maternal plasma expansion and fetal growth. Heightened awareness of maternal health risks drives dependable reorder velocity for iron therapies across hospital and outpatient networks.
Restraint: Gastrointestinal Intolerance and Unsupervised High-Dose Toxicity Risks
Unabsorbed elemental iron within the gastrointestinal tract frequently causes nausea and abdominal cramping, leading many consumers to abandon oral therapy prematurely. High discontinuation rates constrain commercial market potential and prompt clinical providers to seek specialized alternatives within oral clinical nutrition. European Food Safety Authority (2026) safety assessments confirm that non-chelated ferrous salts require precise dosing controls to prevent gastrointestinal irritation. Persistent digestive discomfort limits long-term patient compliance and caps repeat sales of basic ferrous formulas.
Opportunity: Pediatric Liquid Drops and Third-Party Purity-Verified Chelated Formats
Supplement formulators can capture high-value growth by developing flavored liquid drops and chewable formats for pediatric and geriatric patients who struggle with standard pills. Manufacturing palatable pediatric formulations requires advanced masking agents and specialized nutraceutical excipients that neutralize metallic mineral aftertastes. Brand owners including Vitabiotics Ltd. (2026) often market dual-action pediatric tonics in conjunction with children appetite stimulants to support broad developmental recovery in underweight infants. Partnering with outpatient pediatric clinics enables manufacturers to secure steady wholesale distribution for certified gentle drops.
How Is the Anemia Supplements Market Segmented?
Anemia Supplements Market is segmented by Product and Application categories as well as Form. Forecast period from 2026 to 2036.
| Segmentation Axis | Sub-Segments Covered | 2026 Leading Segment & Share | Other Segment Combined & Total |
|---|---|---|---|
| Product | Ferrous Fumarate, Ferrous Gluconate, Ferrous Sulfate, Iron Bisglycinate, Others | Ferrous Fumarate (38.0% share in 2026) | Other Segment Combined (62.0%) | Total (100.0%) |
| Application | Iron Deficiency Anemia (IDA) Treatment, Pediatric Care, Prenatal Use, Sports Nutrition | Iron Deficiency Anemia (IDA) Treatment (42.0% share in 2026) | Other Segment Combined (58.0%) | Total (100.0%) |
| Form | Tablets, Capsules, Liquids | Tablets (49.0% share in 2026) | Other Segment Combined (51.0%) | Total (100.0%) |
| Distribution Channel | Brick and Mortar, Direct Selling, Chemists/Pharmacies, Health Food Shops, Hypermarkets, Supermarkets | Brick and Mortar (34.0% share in 2026) | Other Segment Combined (66.0%) | Total (100.0%) |
| Region | North America, Latin America, Western Europe, Eastern Europe, East Asia, South Asia and Pacific, Middle East and Africa | Western Europe & East Asia Lead Growth (Germany 10.6% CAGR) | Global Coverage Across 7 Core Countries (100.0%) |
Source: Future Market Insights analysis of the anemia supplements market, 2026.
Why Does the Ferrous Fumarate Segment Lead by Product?
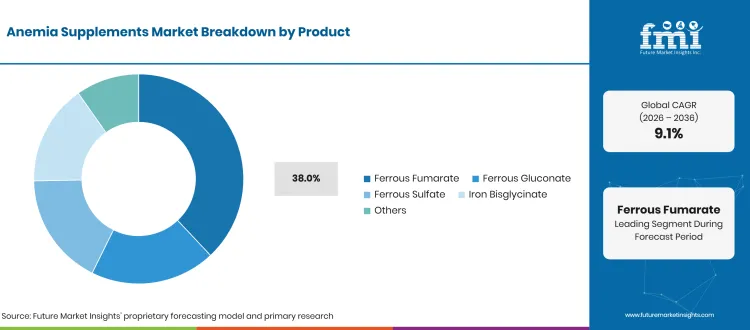
Ferrous Fumarate formulations secure a leading 38.0% share of Product revenue in 2026, reflecting strong clinician preference for high elemental iron density that allows manageable tablet sizes during routine therapeutic repletion. Clinicians favor this organic salt for routine outpatient prescriptions because it offers greater elemental density than ferrous gluconate. Compendial monographs from the United States Pharmacopeia (2026) establish recognized standards for food minerals and pharmaceutical iron compounds, confirming the stability of fumarate salts. High elemental efficiency and established prescription habits will sustain Ferrous Fumarate leadership across therapeutic categories through 2036.
What Keeps the Iron Deficiency Anemia (IDA) Treatment Segment Central to Application Demand?
Iron Deficiency Anemia Treatment accounts for 42.0% of Application sales in 2026, representing the commercial core of market demand as healthcare practitioners treat confirmed diagnostic blood deficiencies. Treatment protocols prioritize concentrated therapeutic courses over low-potency wellness multivitamins to rebuild depleted ferritin stores rapidly. Clinical treatment guidelines from the National Health Service (2026) specify daily therapeutic dosages for confirmed anemia, directing patient volume toward high-potency oral treatments. Continuous clinical screening and clear medical repletion guidelines will keep therapeutic IDA management ahead of casual preventative use through 2036.
Why Do Tablets Retain the Leading Form Position?
Tablets capture 49.0% of Form revenue in 2026, leading shipment volume because compressed solid doses offer exceptional shelf stability, straightforward blister packaging, and economical manufacturing costs. Pharmaceutical manufacturers produce coated tablets at high speeds to keep unit costs affordable for national health programs and retail pharmacy chains. Dosage specifications from Salus-Haus GmbH & Co. KG (2026) highlighting film-coated Floradix tablets illustrate how brands protect iron salts from oxidation while ensuring smooth swallowability. Manufacturing cost efficiency and extensive pharmacy shelf space will preserve solid Tablet leadership across global markets through 2036.
How Does the Brick and Mortar Segment Retain the Leading Distribution Channel Role?
Brick and Mortar retail channels generate 34.0% of category revenue in 2026, maintaining market dominance because consumers value immediate pharmacist guidance and direct collection upon receiving clinical test results. Patients diagnosed with iron deficiency prefer purchasing recommended brands in person to verify dosage instructions and ask about potential digestive side effects. Retail stocking patterns documented by Vitabiotics Ltd. (2026) demonstrate strong placement across community pharmacies and health stores. Direct clinical consultation and immediate product availability will keep physical retail locations central to category sales through 2036.
Regional & Country Outlook
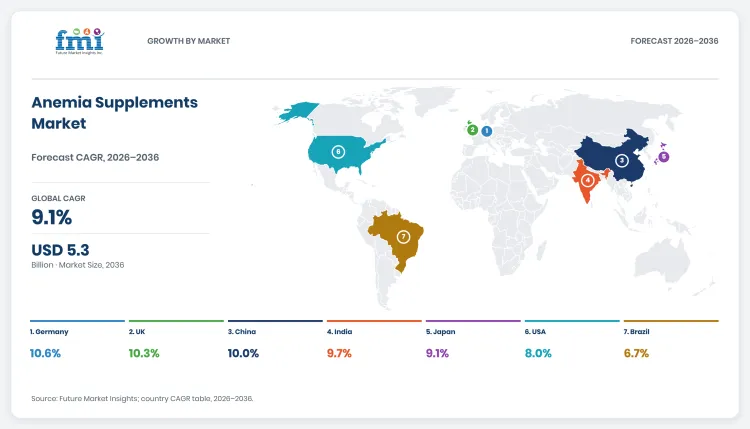
North America and Western Europe account for the majority of global anemia supplement revenue and with European recording the fastest compound annual growth through 2036. FMI projects Germany to lead national expansion at a 10.6% CAGR from 2026 to 2036, followed by the UK at 10.3% and China at 10.0%. India advances at 9.7%, Japan at 9.1%, the USA at 8.0%, and Brazil at 6.7%, reflecting a 3.9 percentage point growth spread shaped by national dietary reference updates, maternal health programs, and premium chelated or liquid product adoption.
| Country | 2026 Revenue | 2036 Revenue | 10-Year Addition | 2026 to 2036 CAGR | Global Share (2026 -> 2036) |
|---|---|---|---|---|---|
| Germany | USD 198.0 million | USD 542.6 million | +USD 344.6 million | 10.6% | 9.0% -> 10.2% |
| UK | USD 176.0 million | USD 469.3 million | +USD 293.3 million | 10.3% | 8.0% -> 8.9% |
| China | USD 396.0 million | USD 1,027.1 million | +USD 631.1 million | 10.0% | 18.0% -> 19.4% |
| India | USD 286.0 million | USD 722.1 million | +USD 436.1 million | 9.7% | 13.0% -> 13.6% |
| Japan | USD 154.0 million | USD 368.0 million | +USD 214.0 million | 9.1% | 7.0% -> 6.9% |
| USA | USD 660.0 million | USD 1,424.9 million | +USD 764.9 million | 8.0% | 30.0% -> 26.9% |
| Brazil | USD 110.0 million | USD 210.4 million | +USD 100.4 million | 6.7% | 5.0% -> 4.0% |
Source: Future Market Insights analysis of the anemia supplements market, 2026.
Germany
Demand for anemia supplements across Germany is projected to rise from USD 198.0 million in 2026 to USD 542.6 million by 2036, advancing at a 10.6% CAGR and adding USD 344.6 million in new sales. German sales momentum expands through pharmacy consultations and rising consumer preference for liquid herbal-iron tonics. Clinical recommendations from the German Nutrition Society (September 2025) emphasize laboratory-confirmed ferritin deficiency before initiating iron therapy, guiding patients toward pharmacist-dispensed remedies like Salus-Haus GmbH & Co. KG (2026) Floradix tonics. Growing consumer trust in gentle botanical formulas and structured pharmacy dispensing will drive German category value through 2036.
UK
Buyer adoption of anemia supplements throughout the UK is estimated to expand from USD 176.0 million in 2026 to USD 469.3 million by 2036, spurred by a 10.3% CAGR that contributes USD 293.3 million in expansion revenue. British market volume is anchored by NHS pharmacy dispensing paired with branded gentle-iron capsules for patients experiencing digestive issues. Clinical guidance published by the National Health Service (2026) details pharmacy dispensing protocols for oral ferrous compounds, while Vitabiotics Ltd. (2026) distributes Feroglobin slow-release capsules nationwide. Pharmacy-led switches toward gentle and slow-release formats will support sustained UK value expansion through 2036.
China
Anemia supplements industry across China is set to scale from USD 396.0 million in 2026 to USD 1,027.1 million by 2036, driven by a 10.0% CAGR and adding USD 631.1 million in commercial revenue. Market expansion in China is fueled by maternal health initiatives and rising urban consumer spending on imported chelated iron capsules. Epidemiological research published in China CDC Weekly (2026) reported a 13.2% anemia prevalence among urban women and 16.7% among reproductive-age females. Targeted life-stage marketing and cross-border e-commerce availability will stimulate strong consumer demand across major Chinese cities through 2036.
India
Sales of anemia supplements throughout India are projected to increase from USD 286.0 million in 2026 to USD 722.1 million by 2036, progressing at a 9.7% CAGR and generating USD 436.1 million in additional sales. Retail pharmacy turnover expands rapidly due to intensified screening under federal maternal health programs that prompt families to purchase branded iron syrups. Operational guidelines released by the Press Information Bureau, India (August 2026) for the Anemia Mukt Bharat program focus on testing and targeted treatment across vulnerable demographics. Expanding point-of-care diagnostic access will accelerate private retail demand for palatable pediatric syrups and prenatal tablets across India through 2036.
Japan
Consumption of anemia supplements within Japan is estimated to climb from USD 154.0 million in 2026 to USD 368.0 million by 2036, reflecting a 9.1% CAGR that contributes USD 214.0 million over the forecast decade. Japanese demand centers on clear life-stage nutrient standards that encourage women to select low-dose, easily absorbed capsules. Official dietary documentation from the Japan Ministry of Health, Labour and Welfare (February 2025) establishes distinct daily iron benchmarks based on pregnancy and menstrual status. Tailored life-stage formulas and pharmacist recommendations will sustain steady Japanese revenue growth through 2036.
USA
Revenue generated by anemia supplements suppliers across the USA is forecast to expand from USD 660.0 million in 2026 to USD 1,424.9 million by 2036, anchored by an 8.0% CAGR and creating USD 764.9 million in new category value. American category demand stems from broad retail availability of certified ferrous sulfate tablets paired with rapid consumer uptake of chelated bisglycinate formulas. Health statistics from the U.S. Centers for Disease Control and Prevention (2026) identify iron deficiency in 22.6% of females aged 12 to 49, while Pharmavite (May 2025) expanded national manufacturing capacity in Ohio. Third-party certified gentle iron lines and convenient gummy formats will drive American revenue growth through 2036.
Brazil
Buyer procurement of anemia supplements within Brazil is tracking from USD 110.0 million in 2026 to USD 210.4 million by 2036, exhibiting a 6.7% CAGR that contributes USD 100.4 million to national market value. Brazilian retail purchasing expands as pediatric and maternity patients seek well-tolerated liquid alternatives to standard public-clinic iron salts. Public health guidance from the Brazilian Ministry of Health (2026) and regional health bulletins from Secretaria de Estado da Saúde de Santa Catarina, Brazil (June 2026) emphasize early anemia intervention in childhood. Rising private healthcare adoption and targeted pediatric drops will support reliable Brazilian market growth through 2036.
Competitive Environment and Notable Companies
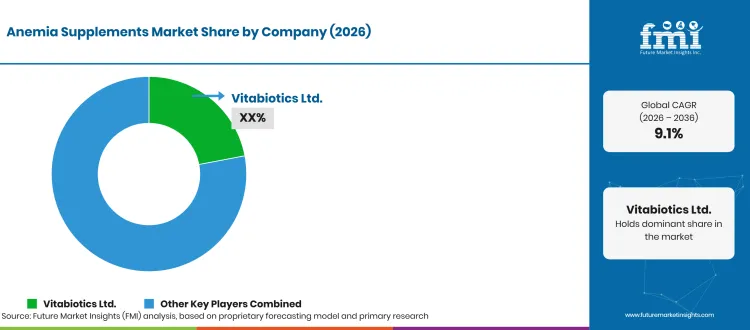
Notable companies operating in the global anemia supplements market include Vitabiotics Ltd., Pharmavite, NovaFerrum, Floradix, VESPYR Brands, Inc., Solgar, Pure Encapsulations, Garden of Life LLC and MegaFood. Market participants compete across three distinct commercial tiers covering mass-retail ferrous-salt and liquid tonic portfolios and family iron brands or and practitioner- iron specialists.
How Are Companies Positioned in the Anemia Supplements Market?
Mass-market and pharmacy leaders including Vitabiotics Ltd. (Feroglobin), Pharmavite (Nature Made), Salus Haus / Floradix (2026), and VESPYR Brands, Inc. (2026) anchor high-volume retail shelves with standardized ferrous fumarate and ferrous sulfate lines. NovaFerrum (2026), Garden of Life (2026), and MegaFood compete on pediatric liquid drops and whole-food paired formulations, whereas Solgar, Pure Encapsulations (2026), and Thorne (2026) target clinician and athletic channels with iron bisglycinate.
What Matters When a Buyer Selects an Anemia Supplements Supplier?
Pharmacy category managers and institutional buyers evaluate suppliers on verified elemental-iron potency per serving, third-party purity certifications (such as USP or NSF Certified for Sport), child-resistant packaging compliance, and digestive tolerability evidence. Clear differentiation between high-dose treatment salts such as Feosol / Vespyr Brands (2026) and lower-dose maintenance chelates such as Garden of Life (2026) prevents consumer dosing errors at the pharmacy counter.
Which Capabilities Distinguish Product Offers?
Formulation capabilities diverge across oral dosage forms and chelation chemistry. NovaFerrum formulates sugar-free pediatric liquid drops delivering 15 mg elemental iron per milliliter, MegaFood pairs fermented iron with beet root and vitamin C in Blood Builder tablets and liquids, and Feosol / Vespyr Brands (2026) offers both carbonyl iron and heme polypeptide options with traditional ferrous sulfate.
How Does Geographic Reach Affect Competition?
Regulatory classification between over-the-counter medicines and dietary supplements shapes international market access. Vitabiotics Ltd. leads UK pharmacy and direct subscription channels, while Salus Haus distributes Floradix liquid and tablet formulas across Germany and the UK. Pharmavite, VESPYR Brands, Inc., NovaFerrum and MegaFood strong United States retail and practitioner.
| Verified Company Evidence (2025 to 2026) | Commercial Effect | Buyer Action |
|---|---|---|
| May 2025: Pharmavite opened a USD 250 million, 225,000-square-foot manufacturing and R&D facility in New Albany, Ohio (Pharmavite, May 2025). | Expands North American supplement production capacity and quality-testing infrastructure. | Assess supply continuity and USP-verified domestic tablet availability for mass-retail planograms. |
| 2025: VESPYR Brands, Inc. rolled out refreshed packaging across its Feosol Original and Feosol Complete iron lines while preserving color-coded tier recognition (VESPYR Brands, Inc., 2025). | Reduces shopper confusion between traditional ferrous sulfate and dual-iron formulations at pharmacy shelves. | Use color-coded front-of-pack elemental iron callouts to organize pharmacy iron sets. |
| January & February 2025: NIH Dietary Supplement Label Database recorded updated product labels for Thorne Iron Bisglycinate (25 mg) and Garden of Life Vitamin Code Raw Iron (28 mg) (NIH ODS, January & February 2025). | Confirms standardized third-party certified (NSF Sport, Non-GMO, Vegan) chelated and whole-food iron options. | Stock verified chelated and vegan iron SKUs with standard ferrous salts to capture intolerant patients. |
Source: Verified corporate disclosures and Future Market Insights analysis, 2026.
| Company | Core Positioning | Verified Activity & Source Attribution |
|---|---|---|
| Vitabiotics Ltd. | UK slow-release Feroglobin capsules and liquid iron tonics | Markets Feroglobin Capsules and Liquids with direct-to-consumer recurring subscription tiers (Vitabiotics Ltd., 2026). |
| Pharmavite | USP-verified Nature Made Iron 65 mg (325 mg ferrous sulfate) tablets | Opened a USD 250 million production and R&D facility in New Albany, Ohio in May 2025 (Pharmavite, May 2025). |
| NovaFerrum | Pediatric liquid iron drops (15 mg/ml) and adult liquid/capsule lines | Supplies dye-free YUMMY Pediatric Drops and adult oral iron formulations across US retail and clinical channels (NovaFerrum, 2026). |
| Floradix (Salus Haus) | Ferrous gluconate herbal liquid tonics and iron-vitamin tablets | Distributes Floradix Liquid Iron and Vitamin Formula and tablets across Germany, the UK, and the USA (Salus Haus / Floradix, 2026). |
| VESPYR Brands, Inc. | Feosol Original ferrous sulfate and Feosol Complete iron tablets | Executed a brand packaging refresh across Feosol and Geritol lines in 2025 to improve shelf navigation (VESPYR Brands, Inc., 2025). |
| Solgar | Chelated iron bisglycinate gentle tablets for adult supplementation | Markets Chelated Iron Tablets formulated with iron bisglycinate for reduced gastrointestinal upset (Solgar, 2026). |
| Pure Encapsulations | Practitioner-grade OptiFerin-C iron bisglycinate plus vitamin C capsules | Supplies hypoallergenic OptiFerin-C capsules combining 28 mg iron bisglycinate with Ester-C mineral ascorbate (Pure Encapsulations, 2026). |
| Garden of Life LLC | Certified vegan and whole-food chelated iron capsules and liquids | Recorded Vitamin Code Raw Iron (28 mg) and Healthy Blood (28.8 mg brown rice chelate) in NIH DSLD in February 2025 (NIH ODS, February 2025). |
| MegaFood | Blood Builder fermented iron tablets and once-daily liquid iron | Supplies Blood Builder Iron Supplement tablets (26 mg) and liquid formats paired with beet root and vitamin C (MegaFood, 2026). |
| Thorne | NSF Certified for Sport 25 mg Iron Bisglycinate capsules | Documented 25 mg elemental iron bisglycinate capsule label in the NIH DSLD in January 2025 (NIH ODS, January 2025). |
Source: Verified corporate disclosures and Future Market Insights analysis, 2026.
Key takeaways
- Valued at USD 2.2 billion in 2026, on course for USD 5.3 billion by 2036.
- The decade adds USD 3.1 billion in new value at a 9.1% CAGR.
- The product segment is led by Ferrous Fumarate at 38.0% of 2026 revenue.
- 42.0% of application revenue goes to Iron Deficiency Anemia (IDA) Treatment in 2026.
- Germany grows fastest at 10.6% CAGR, ahead of the UK at 10.3%.
Anemia Supplements Market Report Scope and Research Methodology
FMI sizes the global anemia supplements market through primary interviews with nutraceutical manufacturers, clinical nutritionists, retail pharmacy chains, and public-health procurement officers, cross-checked against national anemia surveillance datasets, dietary reference intakes, and federal supplement label databases. Core valuations reconcile commercial sales of qualifying oral iron tablets and specialized liquids across all seven profiled countries and regional clusters. Segment shares across Product and Application as well as Form as well as Distribution Channel are validated against audited SKU portfolios and clinical treatment protocols, while excluding intravenous iron products, diagnostic services, fortified foods, and general multivitamins to prevent double counting.
| Coverage Field | Report Scope |
|---|---|
| Market Definition | Commercial revenue from oral iron-containing anemia supplements sold as tablets, capsules, and liquids across the defined applications and channels. |
| Product Segments | Ferrous Fumarate, Ferrous Gluconate, Ferrous Sulfate, Iron Bisglycinate, and Others. |
| Application Segments | Iron Deficiency Anemia (IDA) Treatment, Pediatric Care, Prenatal Use, and Sports Nutrition. |
| Form Segments | Tablets, Capsules, and Liquids. |
| Distribution Channels | Brick and Mortar, Direct Selling, Chemists/Pharmacies, Health Food Shops, Hypermarkets, and Supermarkets. |
| Exclusions | Intravenous (IV) iron infusions, diagnostic blood assays, iron-fortified foods, general multivitamins, and non-commercial public-health free distributions. |
| Quantitative Units | USD Billion for global market sizing; USD Million for country-level breakdowns. |
| Historical & Base Years | 2025 (Historical) and 2026 (Estimated Base Year). |
| Forecast Period | 2026 to 2036 (10-Year Projection Window). |
| Regions Covered | North America, Latin America, Western Europe, Eastern Europe, East Asia, South Asia and Pacific, and Middle East and Africa. |
| Countries Profiled | Germany, UK, China, India, Japan, USA, and Brazil. |
| Companies Covered | Vitabiotics Ltd., Pharmavite, NovaFerrum, Floradix, VESPYR Brands, Inc., Solgar, Pure Encapsulations, Garden of Life LLC, MegaFood, and Thorne. |
| Research Approach | Primary clinician and manufacturer interviews combined with secondary public-health, regulatory, and NIH DSLD label triangulation. |
Source: Future Market Insights analysis of the anemia supplements market, 2026.
Research Sources and Bibliography
- Brazilian Ministry of Health. (2026). Alimentacao Saudavel: Suplementacao de Ferro e Vitamina A na Primeira Infancia. https://www.gov.br/saude/pt-br/assuntos/saude-de-a-a-z/s/saude-da-crianca/primeira-infancia/alimentacao-saudavel
- China CDC Weekly. (2026). Shifting Patterns of Anemia Prevalence and Severity Among Urban Women in China. https://weekly.chinacdc.cn/en/article/pdf/preview/10.46234/ccdcw2026.046.pdf
- Feosol / Vespyr Brands. (2026). Feosol Frequently Asked Questions and Iron Formulations. https://feosol.com/pages/faqs
- Feosol / Vespyr Brands. (2026). Feosol Original Ferrous Sulfate Tablets. https://feosol.com/products/feosol-original
- Garden of Life. (2026). Iron Supplements: Tablets, Capsules, and Liquids. https://www.gardenoflife.com/products/minerals/iron
- Garden of Life. (2026). Vitamin Code Raw Iron Vegan Capsules. https://www.gardenoflife.com/vitamin-code-iron-vegan-capsules
- German Nutrition Society. (2025, September 10). FAQ Eisen: Iron Intake Reference Values and Supplementation Guidance. https://www.dge.de/gesunde-ernaehrung/faq/eisen/
- Japan Ministry of Health, Labour and Welfare. (2025, February 5). Dietary Reference Intakes for Japanese (2025 Edition): Official Summary. https://www.mhlw.go.jp/stf/newpage_49171.html
- MegaFood. (2026). Blood Builder Iron Supplement Product Specifications. https://megafood.com/products/blood-builder
- National Health Service. (2026). About Ferrous Sulfate: Dosing, Pharmacy Access, and Side Effects. https://www.nhs.uk/medicines/ferrous-sulfate/about-ferrous-sulfate/
- National Institutes of Health, Office of Dietary Supplements. (2025, January 23). Iron Bisglycinate (Thorne): Dietary Supplement Label Database Record 321969. https://dsld.od.nih.gov/label/321969
- National Institutes of Health, Office of Dietary Supplements. (2025, February 23). Healthy Blood Iron Brown Rice Chelate (Garden of Life): Dietary Supplement Label Database Record 321385. https://dsld.od.nih.gov/label/321385
- National Institutes of Health, Office of Dietary Supplements. (2025, February 23). Vitamin Code Raw Iron (Garden of Life): Dietary Supplement Label Database Record 321396. https://dsld.od.nih.gov/label/321396
- National Institutes of Health, Office of Dietary Supplements. (2026). Iron: Health Professional Fact Sheet. https://ods.od.nih.gov/factsheets/Iron-HealthProfessional/
- NovaFerrum. (2026). Iron Supplements for Adults: Capsules and Liquid Formulations. https://www.novaferrum.com/collections/novaferrum-for-adults
- NovaFerrum. (2026). NovaFerrum YUMMY Pediatric Drops Liquid Iron Supplement (15 mg/ml). https://www.novaferrum.com/products/novaferrum-liquid-iron-pediatric-drops
- Pharmavite. (2025, May 8). Pharmavite Opens USD 250 Million Production Facility in New Albany, Ohio. https://www.pharmavite.com/news/2025/05/pharmavite-maker-of-nature-made-vitamins-opens-250-million-production-facility-in-new-albany-ohio/
- Pharmavite / Nature Made. (2026). Iron 65 mg Tablets (325 mg Ferrous Sulfate) USP Verified. https://www.naturemade.com/products/iron-tablets
- Press Information Bureau, India. (2025, April 18). India's Fight Against Anemia: 6x6x6 Strategy Under Anemia Mukt Bharat. https://www.pib.gov.in/PressReleaseIframePage.aspx?PRID=2122623
- Press Information Bureau, India. (2026, August 11). Implementation of Anemia Mukt Bharat Abhiyaan Operational Guidelines. https://www.pib.gov.in/PressReleasePage.aspx?PRID=2297512
- Pure Encapsulations. (2026). OptiFerin-C Iron Bisglycinate Product Information Sheet. https://www.pureencapsulationspro.com/media/pdf_upload/Pure_PIS_OptiferinC.pdf
- Salus Haus / Floradix. (2026). Floradix Iron and Vitamin Tablets Product Information. https://www.salus-haus.com/brands/salus-haus/floradix-iron-and-vitamin-tablets-013859011/
- Salus Haus / Floradix. (2026). Floradix Liquid Iron and Vitamin Formula Product Information. https://www.salus-haus.com/en/brands/salus-haus/floradix-liquid-iron-and-vitamin-formula-01385707/
- Secretaria de Estado da Saúde de Santa Catarina, Brazil. (2026, June 22). Governo do Estado Reforca Conscientizacao Sobre Leucemia e Anemia e Alerta Para Sinais da Doenca. https://noticias.sc.gov.br/governo-do-estado-reforca-conscientizacao-sobre-leucemia-e-anemia-e-alerta-para-sinais-da-doenca/
- Solgar. (2026). Chelated Iron Tablets (Iron Bisglycinate) Product Specification. https://www.solgar.com/products/chelated-iron-tablets
- Thorne. (2026). Iron Bisglycinate 25 mg NSF Certified for Sport Capsules. https://www.thorne.com/products/dp/iron-bisglycinate/
- U.S. Centers for Disease Control and Prevention. (2026). FastStats: Anemia or Iron Deficiency Prevalence in the United States. https://www.cdc.gov/nchs/fastats/anemia.htm
- U.S. Food and Drug Administration. (2026). FDA 101: Dietary Supplements Consumer Guidance. https://www.fda.gov/consumers/consumer-updates/fda-101-dietary-supplements
- VESPYR Brands, Inc.. (2025). Feosol and Geritol Packaging Refresh Announcement. https://www.linkedin.com/posts/vespyr-brands_were-always-looking-to-enhance-and-innovate-activity-7312878940262473729-jrXY
- VESPYR Brands, Inc.. (2026). Feosol Brand Portfolio Overview. https://www.vespyrbrands.com/feosol
- Vitabiotics Ltd.. (2026). Feroglobin Capsules Slow-Release Iron Product Information. https://www.vitabiotics.com/products/feroglobin-capsules
- Vitabiotics Ltd.. (2026). Feroglobin Iron Supplements Range. https://www.vitabiotics.com/pages/iron-supplements-feroglobin
- Vitabiotics Ltd.. (2026). Vitabiotics Product Subscriptions: Subscribe and Save. https://www.vitabiotics.com/pages/subscribe
- World Health Organization. (2025, February 10). Anaemia: Global Prevalence, Causes, and Prevention Fact Sheet. https://www.who.int/news-room/fact-sheets/detail/anaemia/
Table of Content
- Key Takeaways
- Market Size and CAGR
- Top Growth Driver
- Fastest Growing Segment
- Leading Region
- Key Companies
- Emerging Opportunities
- Executive Summary
- Global Market Outlook
- Demand-side Trends
- Supply-side Trends
- Technology Roadmap Analysis
- Analysis and Recommendations
- Analyst Perspective (What is happening? Why now? What should investors know?)
- Key Questions Answered
- How large is the market?
- What is the CAGR?
- What are key trends?
- Which region dominates?
- Who are the leaders?
Read More...
- Market Overview
- Market Coverage / Taxonomy
- Market Definition / Scope / Limitations
- Research Methodology
- Chapter Orientation
- Analytical Lens and Working Hypotheses
- Market Structure, Signals, and Trend Drivers
- Benchmarking and Cross-market Comparability
- Market Sizing, Forecasting, and Opportunity Mapping
- Research Design and Evidence Framework
- Desk Research Programme (Secondary Evidence)
- Expert Input and Fieldwork (Primary Evidence)
- Tooling, Models, and Reference Databases
- Data Engineering and Model Build
- Quality Assurance and Audit Trail
- Market Background
- Market Dynamics (Drivers, Restraints, Opportunity, Trends)
- Scenario Forecast (Optimistic, Likely, Conservative)
- Impact Analysis
- AI Impact
- Sustainability Impact
- Regulatory Impact
- Technology Impact
- Consumer / Buyer Analysis
- Purchase Drivers
- Adoption Barriers
- Buyer Journey
- Opportunity Map Analysis
- Product Life Cycle Analysis
- Supply Chain Analysis
- Investment Feasibility Matrix
- Value Chain Analysis
- PESTLE and Porter's Analysis
- Regulatory Landscape
- Regional Parent Market Outlook
- Production and Consumption Statistics
- Import and Export Statistics
- Global Market Analysis and Forecast, 2021 to 2036
- Historical Market Size Value (USD Billion) Analysis, 2021 to 2025
- Current and Future Market Size Value (USD Billion) Projections, 2026 to 2036
- Y-o-Y Growth Trend Analysis
- Absolute $ Opportunity Analysis
- Global Market Pricing Analysis, 2021 to 2036
- Global Market Analysis and Forecast, By Product, 2021 to 2036
- Introduction / Key Findings
- Historical Market Size Value (USD Billion) Analysis By Product, 2021 to 2025
- Current and Future Market Size Value (USD Billion) Analysis and Forecast By Product, 2026 to 2036
- Ferrous Fumarate
- Ferrous Gluconate
- Ferrous Sulfate
- Iron Bisglycinate
- Others
- Y-o-Y Growth Trend Analysis By Product, 2021 to 2025
- Absolute $ Opportunity Analysis By Product, 2026 to 2036
- Global Market Analysis and Forecast, By Application, 2021 to 2036
- Introduction / Key Findings
- Historical Market Size Value (USD Billion) Analysis By Application, 2021 to 2025
- Current and Future Market Size Value (USD Billion) Analysis and Forecast By Application, 2026 to 2036
- Iron Deficiency Anemia (IDA) Treatment
- Pediatric Care
- Prenatal Use
- Sports Nutrition
- Y-o-Y Growth Trend Analysis By Application, 2021 to 2025
- Absolute $ Opportunity Analysis By Application, 2026 to 2036
- Global Market Analysis and Forecast, By Form, 2021 to 2036
- Introduction / Key Findings
- Historical Market Size Value (USD Billion) Analysis By Form, 2021 to 2025
- Current and Future Market Size Value (USD Billion) Analysis and Forecast By Form, 2026 to 2036
- Tablets
- Capsules
- Liquids
- Y-o-Y Growth Trend Analysis By Form, 2021 to 2025
- Absolute $ Opportunity Analysis By Form, 2026 to 2036
- Global Market Analysis and Forecast, By Distribution Channel, 2021 to 2036
- Introduction / Key Findings
- Historical Market Size Value (USD Billion) Analysis By Distribution Channel, 2021 to 2025
- Current and Future Market Size Value (USD Billion) Analysis and Forecast By Distribution Channel, 2026 to 2036
- Brick and Mortar
- Direct Selling
- Chemists/Pharmacies
- Health Food Shops
- Hypermarkets
- Supermarkets
- Y-o-Y Growth Trend Analysis By Distribution Channel, 2021 to 2025
- Absolute $ Opportunity Analysis By Distribution Channel, 2026 to 2036
- Global Market Analysis and Forecast, By Region, 2021 to 2036
- Introduction
- Historical Market Size Value (USD Billion) Analysis By Region, 2021 to 2025
- Current Market Size Value (USD Billion) Analysis and Forecast By Region, 2026 to 2036
- North America
- Western Europe
- East Asia
- South Asia and Pacific
- Market Attractiveness Analysis By Region
- North America Market Analysis and Forecast, By Country, 2021 to 2036
- Historical Market Size Value (USD Billion) Trend Analysis By Market Taxonomy, 2021 to 2025
- Market Size Value (USD Billion) Forecast By Market Taxonomy, 2026 to 2036
- By Country
- United States
- Canada
- By Product
- By Application
- By Form
- By Distribution Channel
- By Country
- Market Attractiveness Analysis
- By Country
- By Product
- By Application
- By Form
- By Distribution Channel
- Key Takeaways
- Western Europe Market Analysis and Forecast, By Country
- Historical Market Size Value (USD Billion) Trend Analysis By Market Taxonomy, 2021 to 2025
- Market Size Value (USD Billion) Forecast By Market Taxonomy, 2026 to 2036
- By Country
- United Kingdom
- Germany
- France
- By Product
- By Application
- By Form
- By Distribution Channel
- By Country
- Market Attractiveness Analysis
- By Country
- By Product
- By Application
- By Form
- By Distribution Channel
- Key Takeaways
- East Asia Market Analysis and Forecast, By Country
- Historical Market Size Value (USD Billion) Trend Analysis By Market Taxonomy, 2021 to 2025
- Market Size Value (USD Billion) Forecast By Market Taxonomy, 2026 to 2036
- By Country
- China
- Japan
- South Korea
- By Product
- By Application
- By Form
- By Distribution Channel
- By Country
- Market Attractiveness Analysis
- By Country
- By Product
- By Application
- By Form
- By Distribution Channel
- Key Takeaways
- South Asia and Pacific Market Analysis and Forecast, By Country
- Historical Market Size Value (USD Billion) Trend Analysis By Market Taxonomy, 2021 to 2025
- Market Size Value (USD Billion) Forecast By Market Taxonomy, 2026 to 2036
- By Country
- India
- Australia
- Rest of world aggregate
- By Product
- By Application
- By Form
- By Distribution Channel
- By Country
- Market Attractiveness Analysis
- By Country
- By Product
- By Application
- By Form
- By Distribution Channel
- Key Takeaways
- Key Countries Market Analysis
- United States
- Pricing Analysis
- Market Share Analysis, 2025
- By Product
- By Application
- By Form
- By Distribution Channel
- Canada
- Pricing Analysis
- Market Share Analysis, 2025
- By Product
- By Application
- By Form
- By Distribution Channel
- Germany
- Pricing Analysis
- Market Share Analysis, 2025
- By Product
- By Application
- By Form
- By Distribution Channel
- United Kingdom
- Pricing Analysis
- Market Share Analysis, 2025
- By Product
- By Application
- By Form
- By Distribution Channel
- France
- Pricing Analysis
- Market Share Analysis, 2025
- By Product
- By Application
- By Form
- By Distribution Channel
- India
- Pricing Analysis
- Market Share Analysis, 2025
- By Product
- By Application
- By Form
- By Distribution Channel
- China
- Pricing Analysis
- Market Share Analysis, 2025
- By Product
- By Application
- By Form
- By Distribution Channel
- Japan
- Pricing Analysis
- Market Share Analysis, 2025
- By Product
- By Application
- By Form
- By Distribution Channel
- South Korea
- Pricing Analysis
- Market Share Analysis, 2025
- By Product
- By Application
- By Form
- By Distribution Channel
- Australia
- Pricing Analysis
- Market Share Analysis, 2025
- By Product
- By Application
- By Form
- By Distribution Channel
- United States
- Market Structure Analysis
- Competition Dashboard
- Competition Benchmarking
- Market Share Analysis of Top Players
- By Regional
- By Product
- By Application
- By Form
- By Distribution Channel
- Emerging Startups
- Innovation Benchmarking
- Competition Analysis
- Competition Deep Dive
- Vitabiotics Ltd.
- Overview
- Product Portfolio
- Profitability by Market Segments
- Sales Footprint
- Strategy Overview
- Marketing Strategy
- Product Strategy
- Channel Strategy
- Pharmavite
- NovaFerrum
- Floradix (Salus Haus)
- VESPYR Brands, Inc.
- Solgar
- Pure Encapsulations
- Garden of Life LLC
- MegaFood
- Thorne
- Vitabiotics Ltd.
- Case Studies
- Success Stories
- Recent Developments
- Competition Deep Dive
- Assumptions & Acronyms Used
List of Tables
- Table 1: Global Market Value (USD Billion) Forecast by Region, 2021 to 2036
- Table 2: Global Market Value (USD Billion) Forecast by Product, 2021 to 2036
- Table 3: Global Market Value (USD Billion) Forecast by Application, 2021 to 2036
- Table 4: Global Market Value (USD Billion) Forecast by Form, 2021 to 2036
- Table 5: Global Market Value (USD Billion) Forecast by Distribution Channel, 2021 to 2036
- Table 6: North America Market Value (USD Billion) Forecast by Country, 2021 to 2036
- Table 7: North America Market Value (USD Billion) Forecast by Product, 2021 to 2036
- Table 8: North America Market Value (USD Billion) Forecast by Application, 2021 to 2036
- Table 9: North America Market Value (USD Billion) Forecast by Form, 2021 to 2036
- Table 10: North America Market Value (USD Billion) Forecast by Distribution Channel, 2021 to 2036
- Table 11: Western Europe Market Value (USD Billion) Forecast by Country, 2021 to 2036
- Table 12: Western Europe Market Value (USD Billion) Forecast by Product, 2021 to 2036
- Table 13: Western Europe Market Value (USD Billion) Forecast by Application, 2021 to 2036
- Table 14: Western Europe Market Value (USD Billion) Forecast by Form, 2021 to 2036
- Table 15: Western Europe Market Value (USD Billion) Forecast by Distribution Channel, 2021 to 2036
- Table 16: East Asia Market Value (USD Billion) Forecast by Country, 2021 to 2036
- Table 17: East Asia Market Value (USD Billion) Forecast by Product, 2021 to 2036
- Table 18: East Asia Market Value (USD Billion) Forecast by Application, 2021 to 2036
- Table 19: East Asia Market Value (USD Billion) Forecast by Form, 2021 to 2036
- Table 20: East Asia Market Value (USD Billion) Forecast by Distribution Channel, 2021 to 2036
- Table 21: South Asia and Pacific Market Value (USD Billion) Forecast by Country, 2021 to 2036
- Table 22: South Asia and Pacific Market Value (USD Billion) Forecast by Product, 2021 to 2036
- Table 23: South Asia and Pacific Market Value (USD Billion) Forecast by Application, 2021 to 2036
- Table 24: South Asia and Pacific Market Value (USD Billion) Forecast by Form, 2021 to 2036
- Table 25: South Asia and Pacific Market Value (USD Billion) Forecast by Distribution Channel, 2021 to 2036
List of Figures
- Figure 1: Global Market Pricing Analysis
- Figure 2: Global Market Value (USD Billion) Forecast 2021-2036
- Figure 3: Global Market Value Share and BPS Analysis by Product, 2026 and 2036
- Figure 4: Global Market Y-o-Y Growth Comparison by Product, 2026-2036
- Figure 5: Global Market Attractiveness Analysis by Product
- Figure 6: Global Market Value Share and BPS Analysis by Application, 2026 and 2036
- Figure 7: Global Market Y-o-Y Growth Comparison by Application, 2026-2036
- Figure 8: Global Market Attractiveness Analysis by Application
- Figure 9: Global Market Value Share and BPS Analysis by Form, 2026 and 2036
- Figure 10: Global Market Y-o-Y Growth Comparison by Form, 2026-2036
- Figure 11: Global Market Attractiveness Analysis by Form
- Figure 12: Global Market Value Share and BPS Analysis by Distribution Channel, 2026 and 2036
- Figure 13: Global Market Y-o-Y Growth Comparison by Distribution Channel, 2026-2036
- Figure 14: Global Market Attractiveness Analysis by Distribution Channel
- Figure 15: Global Market Value (USD Billion) Share and BPS Analysis by Region, 2026 and 2036
- Figure 16: Global Market Y-o-Y Growth Comparison by Region, 2026-2036
- Figure 17: Global Market Attractiveness Analysis by Region
- Figure 18: North America Market Incremental Dollar Opportunity, 2026-2036
- Figure 19: Western Europe Market Incremental Dollar Opportunity, 2026-2036
- Figure 20: East Asia Market Incremental Dollar Opportunity, 2026-2036
- Figure 21: South Asia and Pacific Market Incremental Dollar Opportunity, 2026-2036
- Figure 22: North America Market Value Share and BPS Analysis by Country, 2026 and 2036
- Figure 23: North America Market Value Share and BPS Analysis by Product, 2026 and 2036
- Figure 24: North America Market Y-o-Y Growth Comparison by Product, 2026-2036
- Figure 25: North America Market Attractiveness Analysis by Product
- Figure 26: North America Market Value Share and BPS Analysis by Application, 2026 and 2036
- Figure 27: North America Market Y-o-Y Growth Comparison by Application, 2026-2036
- Figure 28: North America Market Attractiveness Analysis by Application
- Figure 29: North America Market Value Share and BPS Analysis by Form, 2026 and 2036
- Figure 30: North America Market Y-o-Y Growth Comparison by Form, 2026-2036
- Figure 31: North America Market Attractiveness Analysis by Form
- Figure 32: North America Market Value Share and BPS Analysis by Distribution Channel, 2026 and 2036
- Figure 33: North America Market Y-o-Y Growth Comparison by Distribution Channel, 2026-2036
- Figure 34: North America Market Attractiveness Analysis by Distribution Channel
- Figure 35: Western Europe Market Value Share and BPS Analysis by Country, 2026 and 2036
- Figure 36: Western Europe Market Value Share and BPS Analysis by Product, 2026 and 2036
- Figure 37: Western Europe Market Y-o-Y Growth Comparison by Product, 2026-2036
- Figure 38: Western Europe Market Attractiveness Analysis by Product
- Figure 39: Western Europe Market Value Share and BPS Analysis by Application, 2026 and 2036
- Figure 40: Western Europe Market Y-o-Y Growth Comparison by Application, 2026-2036
- Figure 41: Western Europe Market Attractiveness Analysis by Application
- Figure 42: Western Europe Market Value Share and BPS Analysis by Form, 2026 and 2036
- Figure 43: Western Europe Market Y-o-Y Growth Comparison by Form, 2026-2036
- Figure 44: Western Europe Market Attractiveness Analysis by Form
- Figure 45: Western Europe Market Value Share and BPS Analysis by Distribution Channel, 2026 and 2036
- Figure 46: Western Europe Market Y-o-Y Growth Comparison by Distribution Channel, 2026-2036
- Figure 47: Western Europe Market Attractiveness Analysis by Distribution Channel
- Figure 48: East Asia Market Value Share and BPS Analysis by Country, 2026 and 2036
- Figure 49: East Asia Market Value Share and BPS Analysis by Product, 2026 and 2036
- Figure 50: East Asia Market Y-o-Y Growth Comparison by Product, 2026-2036
- Figure 51: East Asia Market Attractiveness Analysis by Product
- Figure 52: East Asia Market Value Share and BPS Analysis by Application, 2026 and 2036
- Figure 53: East Asia Market Y-o-Y Growth Comparison by Application, 2026-2036
- Figure 54: East Asia Market Attractiveness Analysis by Application
- Figure 55: East Asia Market Value Share and BPS Analysis by Form, 2026 and 2036
- Figure 56: East Asia Market Y-o-Y Growth Comparison by Form, 2026-2036
- Figure 57: East Asia Market Attractiveness Analysis by Form
- Figure 58: East Asia Market Value Share and BPS Analysis by Distribution Channel, 2026 and 2036
- Figure 59: East Asia Market Y-o-Y Growth Comparison by Distribution Channel, 2026-2036
- Figure 60: East Asia Market Attractiveness Analysis by Distribution Channel
- Figure 61: South Asia and Pacific Market Value Share and BPS Analysis by Country, 2026 and 2036
- Figure 62: South Asia and Pacific Market Value Share and BPS Analysis by Product, 2026 and 2036
- Figure 63: South Asia and Pacific Market Y-o-Y Growth Comparison by Product, 2026-2036
- Figure 64: South Asia and Pacific Market Attractiveness Analysis by Product
- Figure 65: South Asia and Pacific Market Value Share and BPS Analysis by Application, 2026 and 2036
- Figure 66: South Asia and Pacific Market Y-o-Y Growth Comparison by Application, 2026-2036
- Figure 67: South Asia and Pacific Market Attractiveness Analysis by Application
- Figure 68: South Asia and Pacific Market Value Share and BPS Analysis by Form, 2026 and 2036
- Figure 69: South Asia and Pacific Market Y-o-Y Growth Comparison by Form, 2026-2036
- Figure 70: South Asia and Pacific Market Attractiveness Analysis by Form
- Figure 71: South Asia and Pacific Market Value Share and BPS Analysis by Distribution Channel, 2026 and 2036
- Figure 72: South Asia and Pacific Market Y-o-Y Growth Comparison by Distribution Channel, 2026-2036
- Figure 73: South Asia and Pacific Market Attractiveness Analysis by Distribution Channel
- Figure 74: Global Market - Tier Structure Analysis
- Figure 75: Global Market - Company Share Analysis
Frequently Asked Questions
How big is the anemia supplements market in 2026?
Future Market Insights estimates the global anemia supplements market valuation at USD 2.2 billion in 2026, increasing from USD 2.0 billion in 2025 across pharmacy and retail channels.
What CAGR and market size are projected for the anemia supplements market by 2036?
Global anemia supplement sales are forecast to reach USD 5.3 billion by 2036, advancing at a 9.1% CAGR from 2026 to 2036 and generating USD 3.1 billion in incremental revenue.
Which Product segment leads the anemia supplements market in 2026?
Ferrous Fumarate leads the Product axis with a 38.0% revenue share in 2026, driven by widespread clinical prescription for pregnancy and rapid elemental iron absorption.
Which Application segment captures the largest share of anemia supplement revenue?
Iron Deficiency Anemia (IDA) Treatment holds 42.0% of Application revenue in 2026, anchored by diagnostic blood screenings that trigger standardized multi-month repletion therapies.
Why do Tablets lead the Form segment in the anemia supplements market?
Tablets account for 49.0% of Form revenue in 2026 because standardized elemental-iron strengths and ambient blister stability fit mainstream prescribing and retail dispensing.
Which Distribution Channel holds the largest share in the anemia supplements market?
Brick and Mortar outlets capture 34.0% of Distribution Channel revenue in 2026 as consumers and caregivers verify elemental iron dosage and drug interactions in person.
Which countries are projected to grow fastest in the anemia supplements market?
Germany leads national growth at a 10.6% CAGR from 2026 to 2036, followed by the UK at 10.3% and China at 10.0% as diagnostic screening and gentle iron formulations expand.
Which companies are profiled as key players in the anemia supplements market?
Profiled companies include Vitabiotics Ltd., Pharmavite, NovaFerrum, Floradix, VESPYR Brands, Inc., Solgar, Pure Encapsulations, Garden of Life LLC and MegaFood.
Preview the report firsthand - request a free sample
Get SampleGet the brochure for pricing and purchase details.
Get PDF
