Anti-Allergenic Agents Market Size and Share Forecast Outlook 2025 to 2035

A valuation of USD 1,703.7 million in 2025 has been projected for the Anti-Allergenic Agents Market, which is anticipated to rise to USD 3,903.6 million by 2035. This growth reflects an addition of more than USD 2,199.9 million, representing a 2.3X increase in market size over the decade. A compound annual growth rate of 8.6% has been indicated, confirming the sector’s upward trajectory as skin sensitivity and allergen-free formulations continue to be prioritized by formulators.
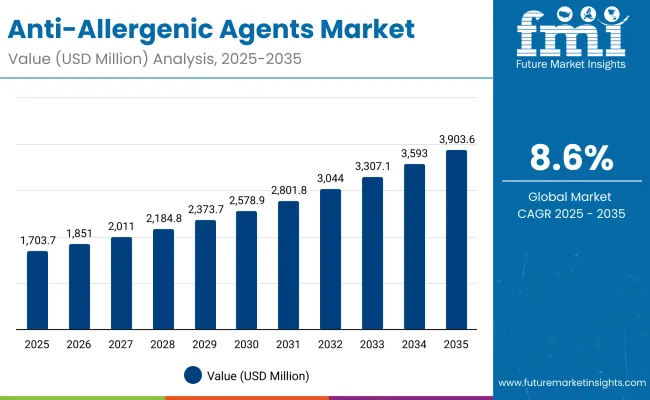
Quick Stats for Anti-Allergenic Agents Market

  • Market Value (2025): USD 1,703.7 Million
  • Market Forecast Value (2035): USD 3,903.6 Million
  • Market Forecast CAGR (2025 to 2035): 8.6%
  • Leading Segment in 2025: Botanical Sources (62.0%)
  • Key Growth Regions in the Market: North America, East Asia, South Asia & Pacific, Europe
  • Top Key Players in the Market: Symrise, Givaudan, BASF, Croda, Ashland, Seppic, Clariant, Evonik, DSM-Firmenich, Greentech

Anti Allergenic Agents Market

Anti-Allergenic Agents Market Key Takeaways

Metric Value
Anti-Allergenic Agents Market Estimated Value in (2025E) USD 1,703.7 Million
Anti-Allergenic Agents Market Forecast Value in (2035F) USD 3,903.6 Million
Forecast CAGR (2025 to 2035) 8.60%

During the first half of the forecast period, from 2025 to 2030, the market is estimated to expand from USD 1,703.7 million to USD 2,578.9 million, contributing USD 875.2 million, which accounts for nearly 40% of total decade growth. This initial momentum is expected to be shaped by adoption of barrier-support actives, anticipated at 38.0% share in 2025, and the strong pull for botanical ingredients, capturing 62.0% share in 2025. These segments are projected to dominate ingredient sourcing and formulation pipelines as sustainability and efficacy remain key B2B purchase drivers.

The second half of the period, from 2030 to 2035, is expected to deliver a sharper increase of USD 1,324.7 million, nearly 60% of total decade growth, as the market advances from USD 2,578.9 million to USD 3,903.6 million. This acceleration is anticipated to be powered by expanded adoption of biotechnology-derived actives and greater use of encapsulation systems. Free-form ingredients, leading with 51.0% share in 2025, are predicted to sustain their dominance, while encapsulated formats gain traction in premium formulations.

From 2025 to 2035, the market is expected to more than double in size, rising from USD 1,703.7 million to USD 3,903.6 million. Growth is projected to be driven by demand for allergen-free formulations, rising sensitivity concerns, and the shift toward sustainable sourcing. Botanical actives are anticipated to maintain dominance with 62.0% share in 2025, supported by strong consumer preference for plant-based raw materials. Biotechnology-derived agents are expected to accelerate in adoption as formulation houses seek higher purity, reproducibility, and regulatory compliance.

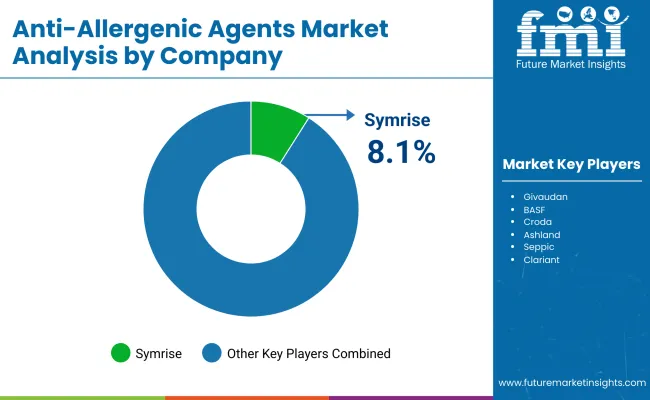
Regionally, the USA is projected to retain leadership in value terms, while Asia is expected to contribute disproportionately to growth, led by China, India, and Japan. Europe is anticipated to maintain a strong share, underpinned by regulatory-driven product innovation. The competitive landscape is expected to remain fragmented, with Symrise leading at 8.1% share in 2025 and other global and regional suppliers competing on innovation, botanical traceability, and delivery system technologies. Long-term advantage is projected to be captured by suppliers capable of integrating biotech, encapsulation, and clinical validation into their portfolios.

Why the Anti-Allergenic Agents Market is growing?

Growth in the Anti-Allergenic Agents Market is being driven by rising consumer awareness of allergen-induced skin sensitivities and the increasing demand for scientifically validated solutions in skincare and dermo cosmetics. The market is being supported by advancements in biotechnology-derived actives, which are offering higher purity and reproducibility for formulation houses. Botanical ingredients are being preferred as clean-label expectations continue to influence procurement decisions, while encapsulation technologies are enabling enhanced stability and targeted delivery of sensitive actives. Expansion of hypoallergenic product lines across skincare, baby care, and scalp care is reinforcing steady adoption in both developed and emerging regions. Regulatory pressures and retailer ingredient restrictions are compelling brands to adopt safer, clinically backed inputs, further elevating the role of anti-allergenic agents in new formulations. Over the forecast period, accelerated penetration in Asia-Pacific and rising dermo cosmetic consumption globally are expected to strengthen market growth momentum.

Segmental Analysis

The Anti-Allergenic Agents Market has been segmented across multiple dimensions to capture the evolving procurement priorities of formulation houses. Key segments include mode of action, source, and delivery system, each shaping growth trajectories in distinct ways. Mode of action highlights the critical role of barrier-support actives and their contribution to skin defense against allergen triggers. Source-based classification underscores the rising importance of biotechnology-derived agents, driven by consistency and sustainability, alongside the continued dominance of botanical inputs. Delivery system segmentation emphasizes the balance between free form actives, valued for versatility, and encapsulated forms, which are gaining traction for targeted efficacy. Together, these segments reveal how innovation, clinical validation, and consumer-led demand for allergen-free solutions are expected to guide ingredient adoption through 2035.
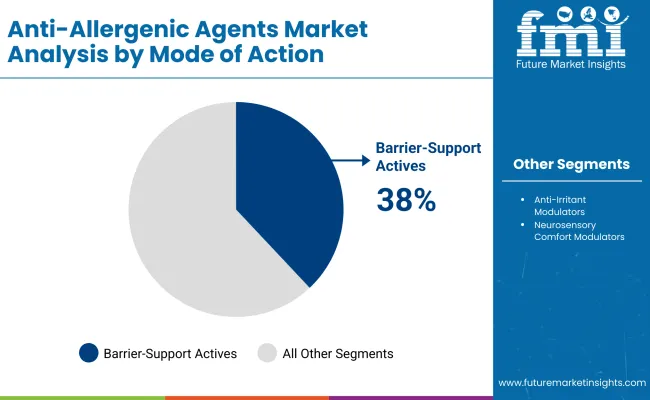
Insights into the Mode of Action Segment with Barrier-Support Actives Leading in Market Share

Anti Allergenic Agents Market By Mode Of Action

Mode of Action Market Value Share, 2025
Barrier-support actives 38%
Others 62.0%

Barrier-support actives are estimated to contribute 38.0% of the Anti-Allergenic Agents Market in 2025, valued at USD 588.9 million. Their dominance is being supported by the growing reliance on barrier-repair solutions as the first line of defense against allergen triggers. Formulation houses are increasingly incorporating these agents to reinforce skin resilience and reduce sensitivity. Adoption is expected to rise as clinical validation continues to highlight their efficacy in reducing trans-epidermal water loss and improving tolerance in sensitive skin types. Competitive advantage is likely to be driven by suppliers capable of demonstrating reproducible results and compatibility with broader dermo cosmetic formulations. Over the forecast period, barrier-support actives are projected to remain essential to sensitive-skin product pipelines, sustaining strong demand growth globally.
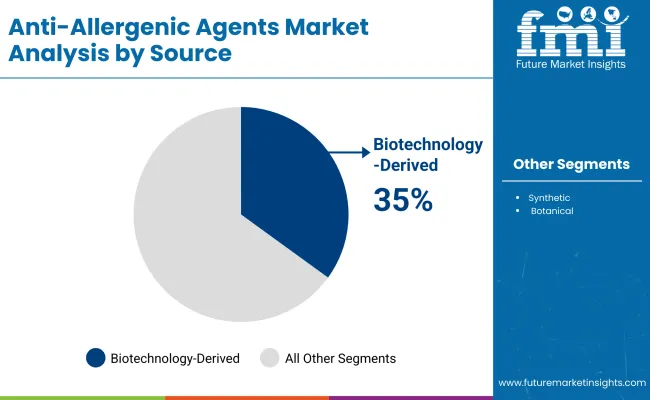
Insights into the Source Segment with Biotechnology-Derived Ingredients Expanding Share

Anti Allergenic Agents Market By Source

Source Market Value Share, 2025
Biotechnology-derived 35%
Others 65.0%

Biotechnology-derived ingredients are projected to account for 35.0% share of the Anti-Allergenic Agents Market in 2025, valued at USD 566.7 million. Their adoption is being supported by higher purity, consistency, and reproducibility compared with conventional sources. Brands are increasingly prioritizing biotech-derived inputs to address regulatory scrutiny, minimize allergenic residues, and achieve standardized performance across product batches. Demand is expected to accelerate as biotech innovations enable novel prebiotic and postbiotic complexes that align with microbiome-friendly claims. Expansion of fermentation technologies is also likely to strengthen supply scalability and reduce cost volatility. Over the forecast period, biotechnology-derived actives are anticipated to capture a greater share as clean-label positioning, sustainability credentials, and clinical validation converge to shape procurement priorities among formulators.
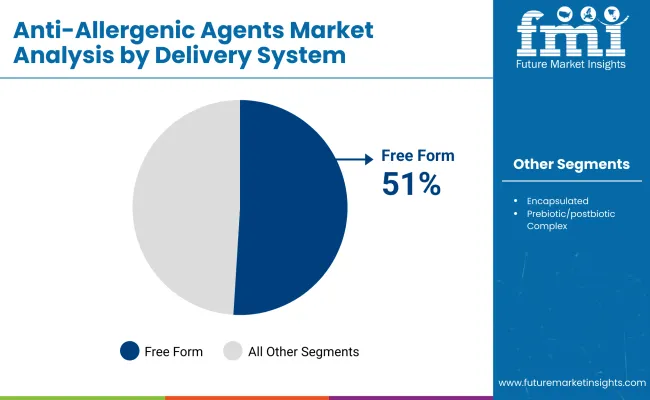
Insights into the Delivery System Segment with Free Form Remaining Dominant

Anti Allergenic Agents Market By Delivery System

Delivery System Market Value Share, 2025
Free form 51%
Others 49.0%

Free form actives are expected to hold 51.0% 2025,the largest share of the Anti-Allergenic Agents Market, corresponding to USD 533.3 million. Their dominance is being supported by their adaptability in a wide range of formulations and compatibility with different end-use categories such as skincare, baby care, and scalp care. Ease of integration without complex processing steps has positioned free form actives as the preferred choice for formulators seeking flexibility and speed to market. While encapsulated and advanced delivery formats are gaining ground, free form actives are anticipated to retain relevance due to their cost efficiency and broad-spectrum applicability. The segment’s leadership is projected to continue as formulators balance innovation with scalable, reliable ingredient solutions.

What are the Drivers, Restraints, and Key Trends of the Anti-Allergenic Agents Market?

Complex formulation requirements and heightened regulatory oversight are challenging anti-allergenic ingredient adoption, even as formulation houses intensify efforts to integrate advanced botanical and biotech actives that enable hypoallergenic claims, clinical substantiation, and scalable supply across sensitive-skin and dermo cosmetic product pipelines.

Clinical Validation as a Procurement Catalyst

A significant driver is being observed in the growing emphasis on clinical validation as a prerequisite for ingredient adoption. Procurement decisions are increasingly being shaped by the ability of suppliers to provide patch-test data, multi-ethnic tolerance studies, and measurable reductions in stinging or erythema. These data-driven proof points are not only enabling marketing claims but are also being demanded by global retailers and regulators who require substantiated safety profiles. As brands reposition themselves around dermatological efficacy, ingredients backed by reproducible clinical datasets are expected to secure preferential specification. This trend is anticipated to strengthen supplier-formulator collaboration, ensuring that raw materials with verified outcomes are prioritized in the next generation of hypoallergenic product launches.

Supply Chain Vulnerability in Botanical Sourcing

A key restraint is being observed in the supply volatility of botanical actives that dominate current market share. Climatic variability, agricultural yield uncertainty, and the complexity of maintaining consistent allergen-residual profiles are creating procurement challenges for large-scale formulators. As traceability and sustainability become central to brand positioning, any fluctuation in quality or availability is expected to undermine formulator confidence. Regulatory tightening on contaminants and residues is also amplifying the need for standardized extracts, which adds cost and operational complexity for suppliers. Unless robust dual-sourcing strategies and controlled cultivation practices are implemented, reliance on botanicals could limit scalability, creating risks for global product rollouts that require uniform ingredient performance.
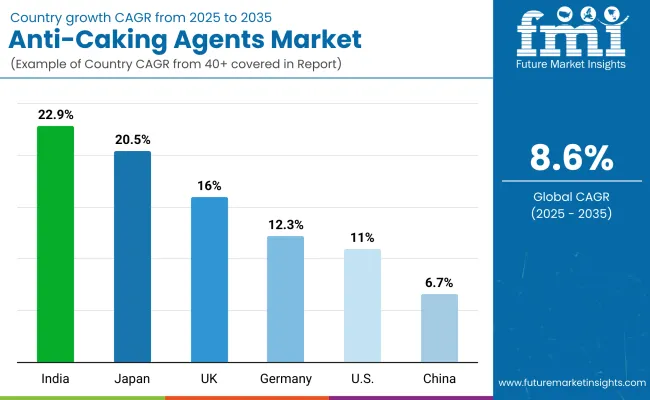
Analysis of Anti-Allergenic Agents Market By Key Countries

Country Wise Anti Allergenic Agents Market

Country CAGR
China 6.7%
USA 11.0%
India 22.9%
UK 16.0%
Germany 12.3%
Japan 20.5%

The Anti-Allergenic Agents Market demonstrates significant variations in growth dynamics across countries, shaped by regulatory environments, consumer sensitivity trends, and the scale of dermocosmetic adoption. India is projected to lead with a CAGR of 22.9% from 2025 to 2035, driven by expanding middle-class consumption, rising dermatological awareness, and rapid growth of organized retail formats. Japan follows with a robust CAGR of 20.5%, reflecting strong consumer emphasis on sensitive-skin solutions and a preference for clinically validated ingredients. The USA market is expected to expand at 11.0% CAGR, supported by advanced dermocosmetic adoption, retailer-driven ingredient standards, and the sustained momentum of premium skincare launches. Europe presents steady growth at 10.4%, with Germany (12.3%) and the UK (16.0%) reinforcing regional leadership through stringent compliance frameworks and innovation in hypoallergenic formulations. China, at 6.7% CAGR, is anticipated to witness moderate but steady growth, shaped by increasing consumer awareness and gradual expansion of biotech-driven sourcing.

This divergence highlights how Asia, led by India and Japan, is projected to anchor the fastest expansion, while the USA and Europe sustain strong value-driven growth. The interplay of regulation, consumer preference, and supplier innovation is expected to determine how each market shapes future procurement strategies.
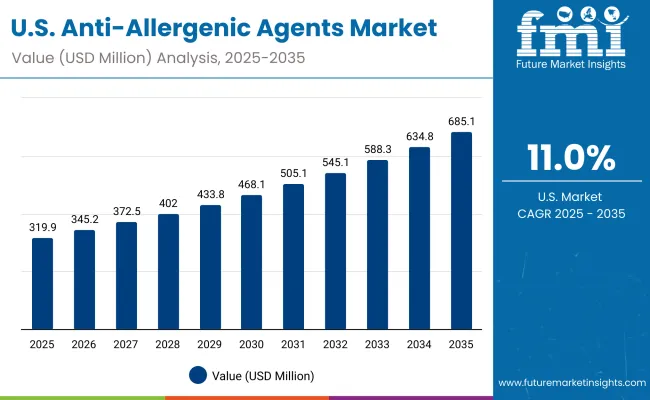
Sales Outlook for Anti-Allergenic Agents in the United States

Usa Anti Allergenic Agents Market

Year USA Anti-Allergenic Agents Market (USD Million)
2025 319.90
2026 345.21
2027 372.53
2028 402.01
2029 433.82
2030 468.15
2031 505.19
2032 545.17
2033 588.31
2034 634.86
2035 685.10

The Anti-Allergenic Agents Market in the United States is projected to expand at a CAGR of 11.0% between 2025 and 2035, underpinned by the growing prominence of sensitive-skin and hypoallergenic formulations. Strengthened retailer standards and consumer demand for allergen-free claims are compelling formulation houses to prioritize barrier-support actives and clinically validated ingredients. Biotech-derived actives are expected to gain share due to higher reproducibility and compliance alignment, while botanical actives maintain strong adoption for clean-label positioning.

  • Barrier-support actives are being prioritized in sensitive-skin formulations, supported by dermatologist-led brand endorsements.
  • Biotechnology-derived inputs are anticipated to grow faster as traceability and safety documentation become procurement essentials.
  • Collaboration between suppliers and dermocosmetic brands is projected to expand pipelines for encapsulated and advanced delivery formats.

Growth and Expansion Outlook for Anti-Allergenic Agents Market in the United Kingdom

The Anti-Allergenic Agents Market in the United Kingdom is projected to expand at a CAGR of 16.0% through 2035, supported by strong consumer emphasis on skin health and an evolving regulatory environment that prioritizes allergen-free formulations. Growth is being reinforced by premium skincare adoption and the rapid penetration of dermocosmetic ranges across retail and e-commerce channels.

  • Barrier-support actives are being adopted extensively as clinical validation strengthens consumer trust in sensitive-skin product claims
  • Botanical ingredients are expected to sustain demand, aligned with clean-label preferences and sustainability commitments in the UK market.
  • Regulatory pressures on ingredient safety are anticipated to accelerate innovation in biotech-derived inputs.
  • Strategic collaboration with dermatology-led brands is expected to position suppliers advantageously in premium product launches.

Growth and Expansion Outlook for Anti-Allergenic Agents Market in India

The Anti-Allergenic Agents Market in India is anticipated to register the fastest growth globally, advancing at a CAGR of 22.9% between 2025 and 2035. Rising middle-class consumption, coupled with dermatological awareness and rapid expansion of organized retail, is projected to support adoption of anti-allergenic formulations across mass and premium categories.

  • Baby care and scalp care segments are expected to expand rapidly as consumer demand for allergen-free personal care intensifies.
  • Biotechnology-derived actives are anticipated to gain traction due to improved consistency and global compliance alignment.
  • E-commerce and direct-to-consumer channels are strengthening access, accelerating adoption of hypoallergenic products.
  • Supplier partnerships with domestic brands are likely to unlock significant opportunities in localized and affordable allergen-free solutions.

Sales Outlook for Anti-Allergenic Agents in China

The Anti-Allergenic Agents Market in China is expected to expand at a moderate CAGR of 6.7% from 2025 to 2035, shaped by rising consumer awareness and the gradual scaling of biotech-sourced actives. Growth is being tempered by pricing pressures and reliance on botanical supply chains, though innovation in sensitive-skin formulations is steadily increasing.
  • Biotechnology-derived actives are projected to contribute significantly, supported by advances in fermentation-based ingredient manufacturing.
  • Consumer education around hypoallergenic skincare is expected to fuel demand for barrier-support and microbiome-related actives.
  • Retailer pressure for safety certifications is reinforcing demand for clinically validated, globally compliant raw materials.
  • Domestic suppliers are anticipated to expand competitive positioning through partnerships with multinational dermocosmetic brands.

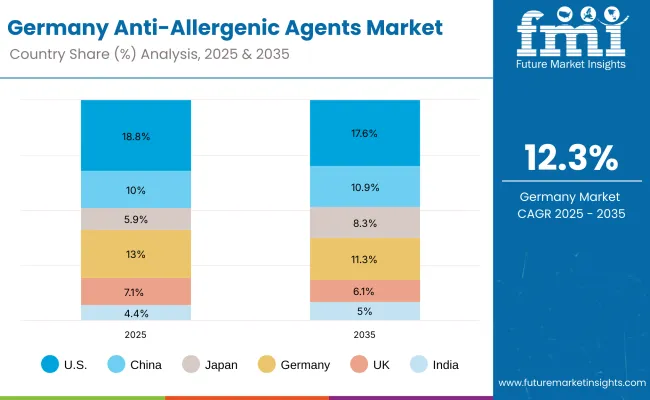
In-depth Analysis of Anti-Allergenic Agents in Germany

Europe Anti Allergenic Agents Market

Country 2025
USA 18.8%
China 10.0%
Japan 5.9%
Germany 13.0%
UK 7.1%
India 4.4%
Country 2035
USA 17.6%
China 10.9%
Japan 8.3%
Germany 11.3%
UK 6.1%
India 5.0%

The Anti-Allergenic Agents Market in Germany is forecast to grow at a CAGR of 12.3% through 2035, driven by stringent regulatory oversight, rising consumer preference for hypoallergenic products, and the prominence of dermocosmetic adoption across pharmacies and specialist retail. Germany is projected to remain a cornerstone of European market expansion.
  • Barrier-support actives are being widely adopted to align with dermatology-backed claims and strict safety standards.
  • Botanical ingredients are anticipated to dominate, but biotech-derived inputs are expected to gain share as reproducibility requirements intensify.
  • Clinical validation and transparent sourcing are projected to serve as decisive procurement factors for suppliers.
  • Collaborations with pharmaceutical-backed dermocosmetic brands are expected to anchor long-term ingredient demand in Germany.

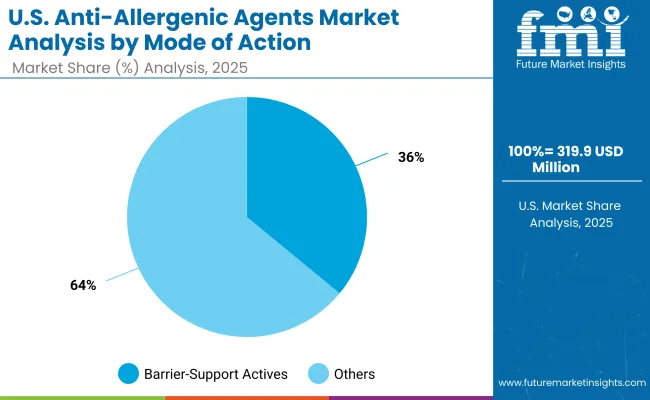
Growth Outlook for Anti-Allergenic Agents Market in USA

Usa Anti Allergenic Agents Market By Mode Of Action

USA by Mode of Action Market Value Share, 2025
Barrier-support actives 36%
Others 64.0%

The Anti-Allergenic Agents Market in the United States is projected at USD 319.9 million in 2025. Barrier-support actives contribute 36% of this value, while other modes of action hold 64%, highlighting a broader reliance on diversified formulations beyond barrier reinforcement alone. This structural composition reflects the growing role of neurosensory comfort modulators and anti-irritant agents in delivering fast-relief benefits that resonate with consumer expectations. The preference for multiple functional pathways indicates that formulators are prioritizing not just barrier health but also sensory comfort and irritation modulation, offering a more holistic approach to sensitive-skin care.

A transition toward biotech-driven actives within the “Others” segment is anticipated, as reproducibility and compliance emerge as decisive factors for USA procurement teams. Clinical validation will further reinforce the trust in these diversified actives, enabling brands to substantiate strong hypoallergenic claims.
  • The USA market is valued at USD 319.9 million in 2025.
  • Barrier-support actives hold 36% share, reflecting enduring reliance on skin defense formulations.
  • Other actives dominate with 64% share, driven by demand for irritation relief and neurosensory comfort.
  • Increasing biotech integration is expected to strengthen reproducibility and accelerate adoption in high-compliance segments.

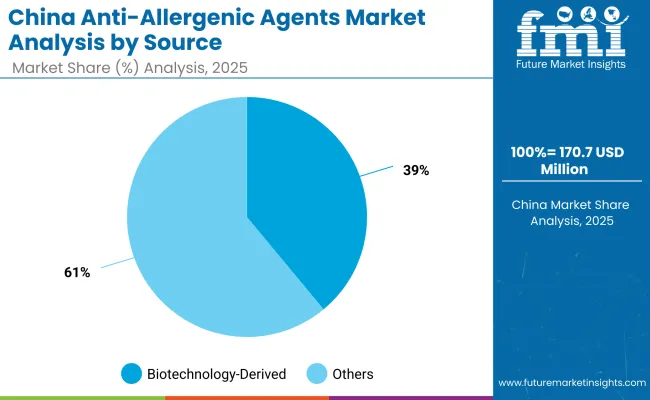
Opportunity Analysis of China Anti-Allergenic Agents Market

China Anti Allergenic Agents Market

China by Source Market Value Share, 2025
Biotechnology-derived 39%
Others 61.0%

The Anti-Allergenic Agents Market in China is projected at USD 170.7 million in 2025. Biotechnology-derived actives account for 39% of this value, equal to USD 66.6 million, while other sources contribute 61%, valued at USD 104.1 million. The prominence of biotech-derived inputs reflects the rising importance of controlled production methods that ensure reproducibility, purity, and compliance with both domestic and international standards. This segment is expected to expand further as precision fermentation and microbial technologies are scaled to meet demand for hypoallergenic, residue-free formulations.

The continued strength of other sources underscores the dominance of botanical and synthetic inputs in Chinese formulations, especially as natural-positioned claims retain strong consumer appeal. However, reliance on agricultural outputs exposes the market to quality inconsistencies, prompting formulators to explore biotech alternatives as a risk mitigation strategy. Over the forecast period, a gradual rebalancing is anticipated, with biotech-derived actives securing greater weight in procurement portfolios.
  • The China market is valued at USD 170.7 million in 2025.
  • Biotechnology-derived actives contribute 39% share, reflecting rising preference for reproducible and residue-free inputs.
  • Other sources dominate with 61% share, supported by enduring botanical and synthetic reliance.
  • Supply stability and compliance alignment are projected to accelerate biotech adoption in China’s sensitive-skin segment.

Competitive Landscape of Anti-Allergenic Agents Market

Anti Allergenic Agents Marketby Comapny

Company Global Value Share 2025
Symrise 8.1%
Others 91.9%

The Anti-Allergenic Agents Market is moderately fragmented, with global leaders, diversified chemical groups, and niche specialists competing to supply formulation ingredients for dermocosmetic, baby care, and scalp care applications. Global ingredient leaders such as Symrise, Givaudan, BASF, Croda, Ashland, Seppic, Clariant, Evonik, DSM-Firmenich, and Greentech are recognized as the key players in this market. Among these, Symrise has emerged as the dominant supplier, holding 8.1% of the global value share in 2025, while all other competitors collectively account for 91.9%.

Symrise’s leadership is being reinforced by its strong botanical and biotechnology-driven ingredient portfolios, along with its emphasis on hypoallergenic and sensitive-skin actives supported by clinical validation. Competitors such as Givaudan, BASF, and DSM-Firmenich are leveraging broad ingredient pipelines and research collaborations to expand market reach, while mid-sized players including Seppic and Greentech are focusing on plant-derived actives with sustainability credentials.

Differentiation is increasingly shifting toward innovation in encapsulation systems, biotechnology sourcing, and evidence-based claim support, rather than scale alone. Strategic partnerships with dermocosmetic and personal care brands are being prioritized, as suppliers seek to expand relevance in premium formulations. Over the forecast period, suppliers with proven safety data, transparent sourcing, and microbiome-compatible innovations are expected to consolidate stronger positions in this competitive landscape.

Key Developments in Anti-Allergenic Agents Market

  • On March 21, 2025, Symrise unveiled its Mindera® platform, presenting four multifunctional, 100% plant-based actives designed for sensitive-skin formulations. The launch was positioned as a milestone in botanical innovation, reinforcing industry momentum toward sustainable, allergen-free ingredients with antimicrobial, antioxidant, chelating, and soothing benefits validated for dermocosmetic applications.
  • On April 17, 2025, Symrise introduced SymRelief® green, a biotech-derived ingredient combining bisabolol and ginger root. The development was highlighted as a breakthrough in irritation control, providing visible redness reduction and defense against inflammaging, thereby strengthening the shift toward biotechnologically sourced, clinically validated solutions in the anti-allergenic agents market.

Scope of the Report

Item Value
Market Size (2025E) USD 1,703.7 Million
Market Size (2035F) USD 3,903.6 Million
Forecast CAGR (2025-2035) 8.60%
Segmentation - Mode of Action Barrier-support actives; Anti-irritant modulators; Neurosensory comfort modulators
Segmentation - Source Synthetic; Botanical; Biotechnology-derived
Segmentation - Delivery System Free form; Encapsulated; Prebiotic/postbiotic complex
Segmentation - Physical Form Solution/concentrate; Powder; Dispersion
Segmentation - Application Sensitive face care; Baby care; Body care; Scalp care
Segmentation - End Use Skincare; Hair & scalp care; Dermocosmetic
Regions Covered North America; Europe; East Asia; South Asia & Pacific; Latin America; Middle East & Africa
Countries Covered United States; China; India; Japan; United Kingdom; Germany
Key Companies Profiled Symrise; Givaudan; BASF; Croda; Ashland; Seppic; Clariant; Evonik; DSM-Firmenich; Greentech
Additional Attributes 2025 shares: Botanical 62.0% (USD 1,056.3 Million); Biotechnology-derived 35.0% (USD 566.7 Million); Free form 51.0% (USD 533.3 Million); Barrier-support actives 38.0% (USD 588.9 Million). Coverage includes supplier innovation in encapsulation, microbiome-friendly actives, clinical validation for hypoallergenic claims, and region-specific compliance drivers shaping procurement.

Key Segments

By Mode of Action:

  • Barrier-support actives
  • Anti-irritant modulators
  • Neurosensory comfort modulators
  • Microbiome-support actives

By Source:

  • Synthetic
  • Botanical
  • Biotechnology-derived

By Delivery System:

  • Free form
  • Encapsulated
  • Prebiotic/postbiotic complex

By Physical Form:

  • Solution/concentrate
  • Powder
  • Dispersion

By Application:

  • Sensitive face care
  • Ba care
  • Body care
  • Scalp care

By End Use:

  • Skincare
  • Hair & scalp care
  • Dermocosmetic

By Region:

  • North America
  • Latin America
  • Europe
  • East Asia
  • South Asia & Pacific
  • Middle East and Africa

Table of Content

  1. Executive Summary
    • Global Market Outlook
    • Demand-side Trends
    • Supply-side Trends
    • Technology Roadmap Analysis
    • Analysis and Recommendations
  2. Market Overview
    • Market Coverage / Taxonomy
    • Market Definition / Scope / Limitations
  3. Market Background
    • Market Dynamics
      • Drivers
      • Restraints
      • Opportunity
      • Trends
    • Scenario Forecast
      • Demand in Optimistic Scenario
      • Demand in Likely Scenario
      • Demand in Conservative Scenario
    • Opportunity Map Analysis
    • Product Life Cycle Analysis
    • Supply Chain Analysis
      • Supply Side Participants and their Roles
        • Producers
        • Mid-Level Participants (Traders/ Agents/ Brokers)
        • Wholesalers and Distributors
      • Value Added and Value Created at Node in the Supply Chain
      • List of Raw Material Suppliers
      • List of Existing and Potential Buyer’s
    • Investment Feasibility Matrix
    • Value Chain Analysis
      • Profit Margin Analysis
      • Wholesalers and Distributors
      • Retailers
    • PESTLE and Porter’s Analysis
    • Regulatory Landscape
      • By Key Regions
      • By Key Countries
    • Regional Parent Market Outlook
    • Production and Consumption Statistics
    • Import and Export Statistics
  4. Global Market Analysis 2020 to 2024 and Forecast, 2025 to 2035
    • Historical Market Size Value (USD Million) & Volume (Units) Analysis, 2020 to 2024
    • Current and Future Market Size Value (USD Million) & Volume (Units) Projections, 2025 to 2035
      • Y-o-Y Growth Trend Analysis
      • Absolute $ Opportunity Analysis
  5. Global Market Analysis 2020 to 2024 and Forecast 2025 to 2035, By Mode of Action
    • Introduction / Key Findings
    • Historical Market Size Value (USD Million) & Volume (Units) Analysis By Mode of Action, 2020 to 2024
    • Current and Future Market Size Value (USD Million) & Volume (Units) Analysis and Forecast By Mode of Action, 2025 to 2035
      • Barrier-support actives
      • Anti-irritant modulators
      • Neurosensory comfort modulators
      • Microbiome-support actives
    • Y-o-Y Growth Trend Analysis By Mode of Action, 2020 to 2024
    • Absolute $ Opportunity Analysis By Mode of Action, 2025 to 2035
  6. Global Market Analysis 2020 to 2024 and Forecast 2025 to 2035, By Source
    • Introduction / Key Findings
    • Historical Market Size Value (USD Million) & Volume (Units) Analysis By Source, 2020 to 2024
    • Current and Future Market Size Value (USD Million) & Volume (Units) Analysis and Forecast By Source, 2025 to 2035
      • Synthetic
      • Botanical
      • Biotechnology-derived
    • Y-o-Y Growth Trend Analysis By Source, 2020 to 2024
    • Absolute $ Opportunity Analysis By Source, 2025 to 2035
  7. Global Market Analysis 2020 to 2024 and Forecast 2025 to 2035, By Delivery System
    • Introduction / Key Findings
    • Historical Market Size Value (USD Million) & Volume (Units) Analysis By Delivery System, 2020 to 2024
    • Current and Future Market Size Value (USD Million) & Volume (Units) Analysis and Forecast By Delivery System, 2025 to 2035
      • Free form
      • Encapsulated
      • Prebiotic/postbiotic complex
    • Y-o-Y Growth Trend Analysis By Delivery System, 2020 to 2024
    • Absolute $ Opportunity Analysis By Delivery System, 2025 to 2035
  8. Global Market Analysis 2020 to 2024 and Forecast 2025 to 2035, By Physical Form
    • Introduction / Key Findings
    • Historical Market Size Value (USD Million) & Volume (Units) Analysis By Physical Form, 2020 to 2024
    • Current and Future Market Size Value (USD Million) & Volume (Units) Analysis and Forecast By Physical Form, 2025 to 2035
      • Solution/concentrate
      • Powder
      • Dispersion
    • Y-o-Y Growth Trend Analysis By Physical Form, 2020 to 2024
    • Absolute $ Opportunity Analysis By Physical Form, 2025 to 2035
  9. Global Market Analysis 2020 to 2024 and Forecast 2025 to 2035, By Application
    • Introduction / Key Findings
    • Historical Market Size Value (USD Million) & Volume (Units) Analysis By Application, 2020 to 2024
    • Current and Future Market Size Value (USD Million) & Volume (Units) Analysis and Forecast By Application, 2025 to 2035
      • Sensitive face care
      • Ba care
      • Body care
      • Scalp care
    • Y-o-Y Growth Trend Analysis By Application, 2020 to 2024
    • Absolute $ Opportunity Analysis By Application, 2025 to 2035
  10. Global Market Analysis 2020 to 2024 and Forecast 2025 to 2035, By End Use
    • Introduction / Key Findings
    • Historical Market Size Value (USD Million) & Volume (Units) Analysis By End Use, 2020 to 2024
    • Current and Future Market Size Value (USD Million) & Volume (Units) Analysis and Forecast By End Use, 2025 to 2035
      • Skincare
      • Hair & scalp care
      • Dermocosmetic
    • Y-o-Y Growth Trend Analysis By End Use, 2020 to 2024
    • Absolute $ Opportunity Analysis By End Use, 2025 to 2035
  11. Global Market Analysis 2020 to 2024 and Forecast 2025 to 2035, By Region
    • Introduction
    • Historical Market Size Value (USD Million) & Volume (Units) Analysis By Region, 2020 to 2024
    • Current Market Size Value (USD Million) & Volume (Units) Analysis and Forecast By Region, 2025 to 2035
      • North America
      • Latin America
      • Europe
      • East Asia
      • South Asia & Pacific
      • Middle East and Africa
    • Market Attractiveness Analysis By Region
  12. North America Market Analysis 2020 to 2024 and Forecast 2025 to 2035, By Country
    • Historical Market Size Value (USD Million) & Volume (Units) Trend Analysis By Market Taxonomy, 2020 to 2024
    • Market Size Value (USD Million) & Volume (Units) Forecast By Market Taxonomy, 2025 to 2035
      • By Country
        • USA
        • Canada
      • By Mode of Action
      • By Source
      • By Delivery System
      • By Physical Form
      • By Application
      • By End Use
    • Market Attractiveness Analysis
      • By Country
      • By Mode of Action
      • By Source
      • By Delivery System
      • By Physical Form
      • By Application
      • By End Use
    • Key Takeaways
  13. Latin America Market Analysis 2020 to 2024 and Forecast 2025 to 2035, By Country
    • Historical Market Size Value (USD Million) & Volume (Units) Trend Analysis By Market Taxonomy, 2020 to 2024
    • Market Size Value (USD Million) & Volume (Units) Forecast By Market Taxonomy, 2025 to 2035
      • By Country
        • Brazil
        • Mexico
        • Colombia
        • Rest of Latin America
      • By Mode of Action
      • By Source
      • By Delivery System
      • By Physical Form
      • By Application
      • By End Use
    • Market Attractiveness Analysis
      • By Country
      • By Mode of Action
      • By Source
      • By Delivery System
      • By Physical Form
      • By Application
      • By End Use
    • Key Takeaways
  14. Europe Market Analysis 2020 to 2024 and Forecast 2025 to 2035, By Country
    • Historical Market Size Value (USD Million) & Volume (Units) Trend Analysis By Market Taxonomy, 2020 to 2024
    • Market Size Value (USD Million) & Volume (Units) Forecast By Market Taxonomy, 2025 to 2035
      • By Country
        • Germany
        • UK
        • France
        • Italy
        • Spain
        • Belgium
        • Netherlands
        • Nordic
        • Switzerland
        • Russia
        • Poland
        • Rest of Europe
      • By Mode of Action
      • By Source
      • By Delivery System
      • By Physical Form
      • By Application
      • By End Use
    • Market Attractiveness Analysis
      • By Country
      • By Mode of Action
      • By Source
      • By Delivery System
      • By Physical Form
      • By Application
      • By End Use
    • Key Takeaways
  15. East Asia Market Analysis 2020 to 2024 and Forecast 2025 to 2035, By Country
    • Historical Market Size Value (USD Million) & Volume (Units) Trend Analysis By Market Taxonomy, 2020 to 2024
    • Market Size Value (USD Million) & Volume (Units) Forecast By Market Taxonomy, 2025 to 2035
      • By Country
        • China
        • Japan
        • South Korea
      • By Mode of Action
      • By Source
      • By Delivery System
      • By Physical Form
      • By Application
      • By End Use
    • Market Attractiveness Analysis
      • By Country
      • By Mode of Action
      • By Source
      • By Delivery System
      • By Physical Form
      • By Application
      • By End Use
    • Key Takeaways
  16. South Asia & Pacific Market Analysis 2020 to 2024 and Forecast 2025 to 2035, By Country
    • Historical Market Size Value (USD Million) & Volume (Units) Trend Analysis By Market Taxonomy, 2020 to 2024
    • Market Size Value (USD Million) & Volume (Units) Forecast By Market Taxonomy, 2025 to 2035
      • By Country
        • India
        • Thailand
        • Malaysia
        • Indonesia
        • Singapore
        • Vietnam
        • Australia
        • New Zealand
        • Rest of South Asia
      • By Mode of Action
      • By Source
      • By Delivery System
      • By Physical Form
      • By Application
      • By End Use
    • Market Attractiveness Analysis
      • By Country
      • By Mode of Action
      • By Source
      • By Delivery System
      • By Physical Form
      • By Application
      • By End Use
    • Key Takeaways
  17. Middle East and Africa Market Analysis 2020 to 2024 and Forecast 2025 to 2035, By Country
    • Historical Market Size Value (USD Million) & Volume (Units) Trend Analysis By Market Taxonomy, 2020 to 2024
    • Market Size Value (USD Million) & Volume (Units) Forecast By Market Taxonomy, 2025 to 2035
      • By Country
        • Turkey
        • UAE
        • Saudi Arabia
        • Israel
        • Other GCC Countries
        • North Africa
        • South Africa
      • By Mode of Action
      • By Source
      • By Delivery System
      • By Physical Form
      • By Application
      • By End Use
    • Market Attractiveness Analysis
      • By Country
      • By Mode of Action
      • By Source
      • By Delivery System
      • By Physical Form
      • By Application
      • By End Use
    • Key Takeaways
  18. Key Countries Market Analysis
    • USA
      • Pricing Analysis
      • Market Share Analysis, 2024
        • By Mode of Action
        • By Source
        • By Delivery System
        • By Physical Form
        • By Application
        • By End Use
    • Canada
      • Pricing Analysis
      • Market Share Analysis, 2024
        • By Mode of Action
        • By Source
        • By Delivery System
        • By Physical Form
        • By Application
        • By End Use
    • Brazil
      • Pricing Analysis
      • Market Share Analysis, 2024
        • By Mode of Action
        • By Source
        • By Delivery System
        • By Physical Form
        • By Application
        • By End Use
    • Mexico
      • Pricing Analysis
      • Market Share Analysis, 2024
        • By Mode of Action
        • By Source
        • By Delivery System
        • By Physical Form
        • By Application
        • By End Use
    • Colombia
      • Pricing Analysis
      • Market Share Analysis, 2024
        • By Mode of Action
        • By Source
        • By Delivery System
        • By Physical Form
        • By Application
        • By End Use
    • Germany
      • Pricing Analysis
      • Market Share Analysis, 2024
        • By Mode of Action
        • By Source
        • By Delivery System
        • By Physical Form
        • By Application
        • By End Use
    • UK
      • Pricing Analysis
      • Market Share Analysis, 2024
        • By Mode of Action
        • By Source
        • By Delivery System
        • By Physical Form
        • By Application
        • By End Use
    • France
      • Pricing Analysis
      • Market Share Analysis, 2024
        • By Mode of Action
        • By Source
        • By Delivery System
        • By Physical Form
        • By Application
        • By End Use
    • Italy
      • Pricing Analysis
      • Market Share Analysis, 2024
        • By Mode of Action
        • By Source
        • By Delivery System
        • By Physical Form
        • By Application
        • By End Use
    • Spain
      • Pricing Analysis
      • Market Share Analysis, 2024
        • By Mode of Action
        • By Source
        • By Delivery System
        • By Physical Form
        • By Application
        • By End Use
    • Belgium
      • Pricing Analysis
      • Market Share Analysis, 2024
        • By Mode of Action
        • By Source
        • By Delivery System
        • By Physical Form
        • By Application
        • By End Use
    • Netherlands
      • Pricing Analysis
      • Market Share Analysis, 2024
        • By Mode of Action
        • By Source
        • By Delivery System
        • By Physical Form
        • By Application
        • By End Use
    • Nordic
      • Pricing Analysis
      • Market Share Analysis, 2024
        • By Mode of Action
        • By Source
        • By Delivery System
        • By Physical Form
        • By Application
        • By End Use
    • Switzerland
      • Pricing Analysis
      • Market Share Analysis, 2024
        • By Mode of Action
        • By Source
        • By Delivery System
        • By Physical Form
        • By Application
        • By End Use
    • Russia
      • Pricing Analysis
      • Market Share Analysis, 2024
        • By Mode of Action
        • By Source
        • By Delivery System
        • By Physical Form
        • By Application
        • By End Use
    • Poland
      • Pricing Analysis
      • Market Share Analysis, 2024
        • By Mode of Action
        • By Source
        • By Delivery System
        • By Physical Form
        • By Application
        • By End Use
    • China
      • Pricing Analysis
      • Market Share Analysis, 2024
        • By Mode of Action
        • By Source
        • By Delivery System
        • By Physical Form
        • By Application
        • By End Use
    • Japan
      • Pricing Analysis
      • Market Share Analysis, 2024
        • By Mode of Action
        • By Source
        • By Delivery System
        • By Physical Form
        • By Application
        • By End Use
    • South Korea
      • Pricing Analysis
      • Market Share Analysis, 2024
        • By Mode of Action
        • By Source
        • By Delivery System
        • By Physical Form
        • By Application
        • By End Use
    • India
      • Pricing Analysis
      • Market Share Analysis, 2024
        • By Mode of Action
        • By Source
        • By Delivery System
        • By Physical Form
        • By Application
        • By End Use
    • Thailand
      • Pricing Analysis
      • Market Share Analysis, 2024
        • By Mode of Action
        • By Source
        • By Delivery System
        • By Physical Form
        • By Application
        • By End Use
    • Indonesia
      • Pricing Analysis
      • Market Share Analysis, 2024
        • By Mode of Action
        • By Source
        • By Delivery System
        • By Physical Form
        • By Application
        • By End Use
    • Australia
      • Pricing Analysis
      • Market Share Analysis, 2024
        • By Mode of Action
        • By Source
        • By Delivery System
        • By Physical Form
        • By Application
        • By End Use
    • New Zealand
      • Pricing Analysis
      • Market Share Analysis, 2024
        • By Mode of Action
        • By Source
        • By Delivery System
        • By Physical Form
        • By Application
        • By End Use
    • Turkey
      • Pricing Analysis
      • Market Share Analysis, 2024
        • By Mode of Action
        • By Source
        • By Delivery System
        • By Physical Form
        • By Application
        • By End Use
    • UAE
      • Pricing Analysis
      • Market Share Analysis, 2024
        • By Mode of Action
        • By Source
        • By Delivery System
        • By Physical Form
        • By Application
        • By End Use
    • Saudi Arabia
      • Pricing Analysis
      • Market Share Analysis, 2024
        • By Mode of Action
        • By Source
        • By Delivery System
        • By Physical Form
        • By Application
        • By End Use
    • Israel
      • Pricing Analysis
      • Market Share Analysis, 2024
        • By Mode of Action
        • By Source
        • By Delivery System
        • By Physical Form
        • By Application
        • By End Use
    • North Africa
      • Pricing Analysis
      • Market Share Analysis, 2024
        • By Mode of Action
        • By Source
        • By Delivery System
        • By Physical Form
        • By Application
        • By End Use
    • South Africa
      • Pricing Analysis
      • Market Share Analysis, 2024
        • By Mode of Action
        • By Source
        • By Delivery System
        • By Physical Form
        • By Application
        • By End Use
  19. Market Structure Analysis
    • Competition Dashboard
    • Competition Benchmarking
    • Market Share Analysis of Top Players
      • By Regional
      • By Mode of Action
      • By Source
      • By Delivery System
      • By Physical Form
      • By Application
      • By End Use
  20. Competition Analysis
    • Competition Deep Dive
      • Symrise
        • Overview
        • Product Portfolio
        • Profitability by Market Segments (Product/Age /Sales Channel/Region)
        • Sales Footprint
        • Strategy Overview
          • Marketing Strategy
          • Product Strategy
          • Channel Strategy
      • Givaudan
        • Overview
        • Product Portfolio
        • Profitability by Market Segments (Product/Age /Sales Channel/Region)
        • Sales Footprint
        • Strategy Overview
          • Marketing Strategy
          • Product Strategy
          • Channel Strategy
      • BASF
        • Overview
        • Product Portfolio
        • Profitability by Market Segments (Product/Age /Sales Channel/Region)
        • Sales Footprint
        • Strategy Overview
          • Marketing Strategy
          • Product Strategy
          • Channel Strategy
      • Croda
        • Overview
        • Product Portfolio
        • Profitability by Market Segments (Product/Age /Sales Channel/Region)
        • Sales Footprint
        • Strategy Overview
          • Marketing Strategy
          • Product Strategy
          • Channel Strategy
      • Ashland
        • Overview
        • Product Portfolio
        • Profitability by Market Segments (Product/Age /Sales Channel/Region)
        • Sales Footprint
        • Strategy Overview
          • Marketing Strategy
          • Product Strategy
          • Channel Strategy
      • Seppic
        • Overview
        • Product Portfolio
        • Profitability by Market Segments (Product/Age /Sales Channel/Region)
        • Sales Footprint
        • Strategy Overview
          • Marketing Strategy
          • Product Strategy
          • Channel Strategy
      • Clariant
        • Overview
        • Product Portfolio
        • Profitability by Market Segments (Product/Age /Sales Channel/Region)
        • Sales Footprint
        • Strategy Overview
          • Marketing Strategy
          • Product Strategy
          • Channel Strategy
      • Evonik
        • Overview
        • Product Portfolio
        • Profitability by Market Segments (Product/Age /Sales Channel/Region)
        • Sales Footprint
        • Strategy Overview
          • Marketing Strategy
          • Product Strategy
          • Channel Strategy
      • DSM-Firmenich
        • Overview
        • Product Portfolio
        • Profitability by Market Segments (Product/Age /Sales Channel/Region)
        • Sales Footprint
        • Strategy Overview
          • Marketing Strategy
          • Product Strategy
          • Channel Strategy
      • Greentech
        • Overview
        • Product Portfolio
        • Profitability by Market Segments (Product/Age /Sales Channel/Region)
        • Sales Footprint
        • Strategy Overview
          • Marketing Strategy
          • Product Strategy
          • Channel Strategy
      • Others
        • Overview
        • Product Portfolio
        • Profitability by Market Segments (Product/Age /Sales Channel/Region)
        • Sales Footprint
        • Strategy Overview
          • Marketing Strategy
          • Product Strategy
          • Channel Strategy
  21. Assumptions & Acronyms Used
  22. Research Methodology

List of Tables

  • Table 1: Global Market Value (USD Million) Forecast by Region, 2020-2035
  • Table 2: Global Market Volume (Units) Forecast by Region, 2020-2035
  • Table 3: Global Market Value (USD Million) Forecast by Mode of Action, 2020-2035
  • Table 4: Global Market Volume (Units) Forecast by Mode of Action, 2020-2035
  • Table 5: Global Market Value (USD Million) Forecast by Source, 2020-2035
  • Table 6: Global Market Volume (Units) Forecast by Source, 2020-2035
  • Table 7: Global Market Value (USD Million) Forecast by Delivery System, 2020-2035
  • Table 8: Global Market Volume (Units) Forecast by Delivery System, 2020-2035
  • Table 9: Global Market Value (USD Million) Forecast by Physical Form, 2020-2035
  • Table 10: Global Market Volume (Units) Forecast by Physical Form, 2020-2035
  • Table 11: Global Market Value (USD Million) Forecast by Application, 2020-2035
  • Table 12: Global Market Volume (Units) Forecast by Application, 2020-2035
  • Table 13: Global Market Value (USD Million) Forecast by End Use, 2020-2035
  • Table 14: Global Market Volume (Units) Forecast by End Use, 2020-2035
  • Table 15: North America Market Value (USD Million) Forecast by Country, 2020-2035
  • Table 16: North America Market Volume (Units) Forecast by Country, 2020-2035
  • Table 17: North America Market Value (USD Million) Forecast by Mode of Action, 2020-2035
  • Table 18: North America Market Volume (Units) Forecast by Mode of Action, 2020-2035
  • Table 19: North America Market Value (USD Million) Forecast by Source, 2020-2035
  • Table 20: North America Market Volume (Units) Forecast by Source, 2020-2035
  • Table 21: North America Market Value (USD Million) Forecast by Delivery System, 2020-2035
  • Table 22: North America Market Volume (Units) Forecast by Delivery System, 2020-2035
  • Table 23: North America Market Value (USD Million) Forecast by Physical Form, 2020-2035
  • Table 24: North America Market Volume (Units) Forecast by Physical Form, 2020-2035
  • Table 25: North America Market Value (USD Million) Forecast by Application, 2020-2035
  • Table 26: North America Market Volume (Units) Forecast by Application, 2020-2035
  • Table 27: North America Market Value (USD Million) Forecast by End Use, 2020-2035
  • Table 28: North America Market Volume (Units) Forecast by End Use, 2020-2035
  • Table 29: Latin America Market Value (USD Million) Forecast by Country, 2020-2035
  • Table 30: Latin America Market Volume (Units) Forecast by Country, 2020-2035
  • Table 31: Latin America Market Value (USD Million) Forecast by Mode of Action, 2020-2035
  • Table 32: Latin America Market Volume (Units) Forecast by Mode of Action, 2020-2035
  • Table 33: Latin America Market Value (USD Million) Forecast by Source, 2020-2035
  • Table 34: Latin America Market Volume (Units) Forecast by Source, 2020-2035
  • Table 35: Latin America Market Value (USD Million) Forecast by Delivery System, 2020-2035
  • Table 36: Latin America Market Volume (Units) Forecast by Delivery System, 2020-2035
  • Table 37: Latin America Market Value (USD Million) Forecast by Physical Form, 2020-2035
  • Table 38: Latin America Market Volume (Units) Forecast by Physical Form, 2020-2035
  • Table 39: Latin America Market Value (USD Million) Forecast by Application, 2020-2035
  • Table 40: Latin America Market Volume (Units) Forecast by Application, 2020-2035
  • Table 41: Latin America Market Value (USD Million) Forecast by End Use, 2020-2035
  • Table 42: Latin America Market Volume (Units) Forecast by End Use, 2020-2035
  • Table 43: Europe Market Value (USD Million) Forecast by Country, 2020-2035
  • Table 44: Europe Market Volume (Units) Forecast by Country, 2020-2035
  • Table 45: Europe Market Value (USD Million) Forecast by Mode of Action, 2020-2035
  • Table 46: Europe Market Volume (Units) Forecast by Mode of Action, 2020-2035
  • Table 47: Europe Market Value (USD Million) Forecast by Source, 2020-2035
  • Table 48: Europe Market Volume (Units) Forecast by Source, 2020-2035
  • Table 49: Europe Market Value (USD Million) Forecast by Delivery System, 2020-2035
  • Table 50: Europe Market Volume (Units) Forecast by Delivery System, 2020-2035
  • Table 51: Europe Market Value (USD Million) Forecast by Physical Form, 2020-2035
  • Table 52: Europe Market Volume (Units) Forecast by Physical Form, 2020-2035
  • Table 53: Europe Market Value (USD Million) Forecast by Application, 2020-2035
  • Table 54: Europe Market Volume (Units) Forecast by Application, 2020-2035
  • Table 55: Europe Market Value (USD Million) Forecast by End Use, 2020-2035
  • Table 56: Europe Market Volume (Units) Forecast by End Use, 2020-2035
  • Table 57: East Asia Market Value (USD Million) Forecast by Country, 2020-2035
  • Table 58: East Asia Market Volume (Units) Forecast by Country, 2020-2035
  • Table 59: East Asia Market Value (USD Million) Forecast by Mode of Action, 2020-2035
  • Table 60: East Asia Market Volume (Units) Forecast by Mode of Action, 2020-2035
  • Table 61: East Asia Market Value (USD Million) Forecast by Source, 2020-2035
  • Table 62: East Asia Market Volume (Units) Forecast by Source, 2020-2035
  • Table 63: East Asia Market Value (USD Million) Forecast by Delivery System, 2020-2035
  • Table 64: East Asia Market Volume (Units) Forecast by Delivery System, 2020-2035
  • Table 65: East Asia Market Value (USD Million) Forecast by Physical Form, 2020-2035
  • Table 66: East Asia Market Volume (Units) Forecast by Physical Form, 2020-2035
  • Table 67: East Asia Market Value (USD Million) Forecast by Application, 2020-2035
  • Table 68: East Asia Market Volume (Units) Forecast by Application, 2020-2035
  • Table 69: East Asia Market Value (USD Million) Forecast by End Use, 2020-2035
  • Table 70: East Asia Market Volume (Units) Forecast by End Use, 2020-2035
  • Table 71: South Asia & Pacific Market Value (USD Million) Forecast by Country, 2020-2035
  • Table 72: South Asia & Pacific Market Volume (Units) Forecast by Country, 2020-2035
  • Table 73: South Asia & Pacific Market Value (USD Million) Forecast by Mode of Action, 2020-2035
  • Table 74: South Asia & Pacific Market Volume (Units) Forecast by Mode of Action, 2020-2035
  • Table 75: South Asia & Pacific Market Value (USD Million) Forecast by Source, 2020-2035
  • Table 76: South Asia & Pacific Market Volume (Units) Forecast by Source, 2020-2035
  • Table 77: South Asia & Pacific Market Value (USD Million) Forecast by Delivery System, 2020-2035
  • Table 78: South Asia & Pacific Market Volume (Units) Forecast by Delivery System, 2020-2035
  • Table 79: South Asia & Pacific Market Value (USD Million) Forecast by Physical Form, 2020-2035
  • Table 80: South Asia & Pacific Market Volume (Units) Forecast by Physical Form, 2020-2035
  • Table 81: South Asia & Pacific Market Value (USD Million) Forecast by Application, 2020-2035
  • Table 82: South Asia & Pacific Market Volume (Units) Forecast by Application, 2020-2035
  • Table 83: South Asia & Pacific Market Value (USD Million) Forecast by End Use, 2020-2035
  • Table 84: South Asia & Pacific Market Volume (Units) Forecast by End Use, 2020-2035
  • Table 85: Middle East and Africa Market Value (USD Million) Forecast by Country, 2020-2035
  • Table 86: Middle East and Africa Market Volume (Units) Forecast by Country, 2020-2035
  • Table 87: Middle East and Africa Market Value (USD Million) Forecast by Mode of Action, 2020-2035
  • Table 88: Middle East and Africa Market Volume (Units) Forecast by Mode of Action, 2020-2035
  • Table 89: Middle East and Africa Market Value (USD Million) Forecast by Source, 2020-2035
  • Table 90: Middle East and Africa Market Volume (Units) Forecast by Source, 2020-2035
  • Table 91: Middle East and Africa Market Value (USD Million) Forecast by Delivery System, 2020-2035
  • Table 92: Middle East and Africa Market Volume (Units) Forecast by Delivery System, 2020-2035
  • Table 93: Middle East and Africa Market Value (USD Million) Forecast by Physical Form, 2020-2035
  • Table 94: Middle East and Africa Market Volume (Units) Forecast by Physical Form, 2020-2035
  • Table 95: Middle East and Africa Market Value (USD Million) Forecast by Application, 2020-2035
  • Table 96: Middle East and Africa Market Volume (Units) Forecast by Application, 2020-2035
  • Table 97: Middle East and Africa Market Value (USD Million) Forecast by End Use, 2020-2035
  • Table 98: Middle East and Africa Market Volume (Units) Forecast by End Use, 2020-2035

List of Figures

  • Figure 1: Global Market Value (USD Million) by Mode of Action, 2025-2035
  • Figure 2: Global Market Value (USD Million) by Source, 2025-2035
  • Figure 3: Global Market Value (USD Million) by Delivery System, 2025-2035
  • Figure 4: Global Market Value (USD Million) by Physical Form, 2025-2035
  • Figure 5: Global Market Value (USD Million) by Application, 2025-2035
  • Figure 6: Global Market Value (USD Million) by End Use, 2025-2035
  • Figure 7: Global Market Value (USD Million) by Region, 2025-2035
  • Figure 8: Global Market Value (USD Million) Analysis by Region, 2020-2035
  • Figure 9: Global Market Volume (Units) Analysis by Region, 2020-2035
  • Figure 10: Global Market Value Share (%) and BPS Analysis by Region, 2025-2035
  • Figure 11: Global Market Y-o-Y Growth (%) Projections by Region, 2025-2035
  • Figure 12: Global Market Value (USD Million) Analysis by Mode of Action, 2020-2035
  • Figure 13: Global Market Volume (Units) Analysis by Mode of Action, 2020-2035
  • Figure 14: Global Market Value Share (%) and BPS Analysis by Mode of Action, 2025-2035
  • Figure 15: Global Market Y-o-Y Growth (%) Projections by Mode of Action, 2025-2035
  • Figure 16: Global Market Value (USD Million) Analysis by Source, 2020-2035
  • Figure 17: Global Market Volume (Units) Analysis by Source, 2020-2035
  • Figure 18: Global Market Value Share (%) and BPS Analysis by Source, 2025-2035
  • Figure 19: Global Market Y-o-Y Growth (%) Projections by Source, 2025-2035
  • Figure 20: Global Market Value (USD Million) Analysis by Delivery System, 2020-2035
  • Figure 21: Global Market Volume (Units) Analysis by Delivery System, 2020-2035
  • Figure 22: Global Market Value Share (%) and BPS Analysis by Delivery System, 2025-2035
  • Figure 23: Global Market Y-o-Y Growth (%) Projections by Delivery System, 2025-2035
  • Figure 24: Global Market Value (USD Million) Analysis by Physical Form, 2020-2035
  • Figure 25: Global Market Volume (Units) Analysis by Physical Form, 2020-2035
  • Figure 26: Global Market Value Share (%) and BPS Analysis by Physical Form, 2025-2035
  • Figure 27: Global Market Y-o-Y Growth (%) Projections by Physical Form, 2025-2035
  • Figure 28: Global Market Value (USD Million) Analysis by Application, 2020-2035
  • Figure 29: Global Market Volume (Units) Analysis by Application, 2020-2035
  • Figure 30: Global Market Value Share (%) and BPS Analysis by Application, 2025-2035
  • Figure 31: Global Market Y-o-Y Growth (%) Projections by Application, 2025-2035
  • Figure 32: Global Market Value (USD Million) Analysis by End Use, 2020-2035
  • Figure 33: Global Market Volume (Units) Analysis by End Use, 2020-2035
  • Figure 34: Global Market Value Share (%) and BPS Analysis by End Use, 2025-2035
  • Figure 35: Global Market Y-o-Y Growth (%) Projections by End Use, 2025-2035
  • Figure 36: Global Market Attractiveness by Mode of Action, 2025-2035
  • Figure 37: Global Market Attractiveness by Source, 2025-2035
  • Figure 38: Global Market Attractiveness by Delivery System, 2025-2035
  • Figure 39: Global Market Attractiveness by Physical Form, 2025-2035
  • Figure 40: Global Market Attractiveness by Application, 2025-2035
  • Figure 41: Global Market Attractiveness by End Use, 2025-2035
  • Figure 42: Global Market Attractiveness by Region, 2025-2035
  • Figure 43: North America Market Value (USD Million) by Mode of Action, 2025-2035
  • Figure 44: North America Market Value (USD Million) by Source, 2025-2035
  • Figure 45: North America Market Value (USD Million) by Delivery System, 2025-2035
  • Figure 46: North America Market Value (USD Million) by Physical Form, 2025-2035
  • Figure 47: North America Market Value (USD Million) by Application, 2025-2035
  • Figure 48: North America Market Value (USD Million) by End Use, 2025-2035
  • Figure 49: North America Market Value (USD Million) by Country, 2025-2035
  • Figure 50: North America Market Value (USD Million) Analysis by Country, 2020-2035
  • Figure 51: North America Market Volume (Units) Analysis by Country, 2020-2035
  • Figure 52: North America Market Value Share (%) and BPS Analysis by Country, 2025-2035
  • Figure 53: North America Market Y-o-Y Growth (%) Projections by Country, 2025-2035
  • Figure 54: North America Market Value (USD Million) Analysis by Mode of Action, 2020-2035
  • Figure 55: North America Market Volume (Units) Analysis by Mode of Action, 2020-2035
  • Figure 56: North America Market Value Share (%) and BPS Analysis by Mode of Action, 2025-2035
  • Figure 57: North America Market Y-o-Y Growth (%) Projections by Mode of Action, 2025-2035
  • Figure 58: North America Market Value (USD Million) Analysis by Source, 2020-2035
  • Figure 59: North America Market Volume (Units) Analysis by Source, 2020-2035
  • Figure 60: North America Market Value Share (%) and BPS Analysis by Source, 2025-2035
  • Figure 61: North America Market Y-o-Y Growth (%) Projections by Source, 2025-2035
  • Figure 62: North America Market Value (USD Million) Analysis by Delivery System, 2020-2035
  • Figure 63: North America Market Volume (Units) Analysis by Delivery System, 2020-2035
  • Figure 64: North America Market Value Share (%) and BPS Analysis by Delivery System, 2025-2035
  • Figure 65: North America Market Y-o-Y Growth (%) Projections by Delivery System, 2025-2035
  • Figure 66: North America Market Value (USD Million) Analysis by Physical Form, 2020-2035
  • Figure 67: North America Market Volume (Units) Analysis by Physical Form, 2020-2035
  • Figure 68: North America Market Value Share (%) and BPS Analysis by Physical Form, 2025-2035
  • Figure 69: North America Market Y-o-Y Growth (%) Projections by Physical Form, 2025-2035
  • Figure 70: North America Market Value (USD Million) Analysis by Application, 2020-2035
  • Figure 71: North America Market Volume (Units) Analysis by Application, 2020-2035
  • Figure 72: North America Market Value Share (%) and BPS Analysis by Application, 2025-2035
  • Figure 73: North America Market Y-o-Y Growth (%) Projections by Application, 2025-2035
  • Figure 74: North America Market Value (USD Million) Analysis by End Use, 2020-2035
  • Figure 75: North America Market Volume (Units) Analysis by End Use, 2020-2035
  • Figure 76: North America Market Value Share (%) and BPS Analysis by End Use, 2025-2035
  • Figure 77: North America Market Y-o-Y Growth (%) Projections by End Use, 2025-2035
  • Figure 78: North America Market Attractiveness by Mode of Action, 2025-2035
  • Figure 79: North America Market Attractiveness by Source, 2025-2035
  • Figure 80: North America Market Attractiveness by Delivery System, 2025-2035
  • Figure 81: North America Market Attractiveness by Physical Form, 2025-2035
  • Figure 82: North America Market Attractiveness by Application, 2025-2035
  • Figure 83: North America Market Attractiveness by End Use, 2025-2035
  • Figure 84: North America Market Attractiveness by Country, 2025-2035
  • Figure 85: Latin America Market Value (USD Million) by Mode of Action, 2025-2035
  • Figure 86: Latin America Market Value (USD Million) by Source, 2025-2035
  • Figure 87: Latin America Market Value (USD Million) by Delivery System, 2025-2035
  • Figure 88: Latin America Market Value (USD Million) by Physical Form, 2025-2035
  • Figure 89: Latin America Market Value (USD Million) by Application, 2025-2035
  • Figure 90: Latin America Market Value (USD Million) by End Use, 2025-2035
  • Figure 91: Latin America Market Value (USD Million) by Country, 2025-2035
  • Figure 92: Latin America Market Value (USD Million) Analysis by Country, 2020-2035
  • Figure 93: Latin America Market Volume (Units) Analysis by Country, 2020-2035
  • Figure 94: Latin America Market Value Share (%) and BPS Analysis by Country, 2025-2035
  • Figure 95: Latin America Market Y-o-Y Growth (%) Projections by Country, 2025-2035
  • Figure 96: Latin America Market Value (USD Million) Analysis by Mode of Action, 2020-2035
  • Figure 97: Latin America Market Volume (Units) Analysis by Mode of Action, 2020-2035
  • Figure 98: Latin America Market Value Share (%) and BPS Analysis by Mode of Action, 2025-2035
  • Figure 99: Latin America Market Y-o-Y Growth (%) Projections by Mode of Action, 2025-2035
  • Figure 100: Latin America Market Value (USD Million) Analysis by Source, 2020-2035
  • Figure 101: Latin America Market Volume (Units) Analysis by Source, 2020-2035
  • Figure 102: Latin America Market Value Share (%) and BPS Analysis by Source, 2025-2035
  • Figure 103: Latin America Market Y-o-Y Growth (%) Projections by Source, 2025-2035
  • Figure 104: Latin America Market Value (USD Million) Analysis by Delivery System, 2020-2035
  • Figure 105: Latin America Market Volume (Units) Analysis by Delivery System, 2020-2035
  • Figure 106: Latin America Market Value Share (%) and BPS Analysis by Delivery System, 2025-2035
  • Figure 107: Latin America Market Y-o-Y Growth (%) Projections by Delivery System, 2025-2035
  • Figure 108: Latin America Market Value (USD Million) Analysis by Physical Form, 2020-2035
  • Figure 109: Latin America Market Volume (Units) Analysis by Physical Form, 2020-2035
  • Figure 110: Latin America Market Value Share (%) and BPS Analysis by Physical Form, 2025-2035
  • Figure 111: Latin America Market Y-o-Y Growth (%) Projections by Physical Form, 2025-2035
  • Figure 112: Latin America Market Value (USD Million) Analysis by Application, 2020-2035
  • Figure 113: Latin America Market Volume (Units) Analysis by Application, 2020-2035
  • Figure 114: Latin America Market Value Share (%) and BPS Analysis by Application, 2025-2035
  • Figure 115: Latin America Market Y-o-Y Growth (%) Projections by Application, 2025-2035
  • Figure 116: Latin America Market Value (USD Million) Analysis by End Use, 2020-2035
  • Figure 117: Latin America Market Volume (Units) Analysis by End Use, 2020-2035
  • Figure 118: Latin America Market Value Share (%) and BPS Analysis by End Use, 2025-2035
  • Figure 119: Latin America Market Y-o-Y Growth (%) Projections by End Use, 2025-2035
  • Figure 120: Latin America Market Attractiveness by Mode of Action, 2025-2035
  • Figure 121: Latin America Market Attractiveness by Source, 2025-2035
  • Figure 122: Latin America Market Attractiveness by Delivery System, 2025-2035
  • Figure 123: Latin America Market Attractiveness by Physical Form, 2025-2035
  • Figure 124: Latin America Market Attractiveness by Application, 2025-2035
  • Figure 125: Latin America Market Attractiveness by End Use, 2025-2035
  • Figure 126: Latin America Market Attractiveness by Country, 2025-2035
  • Figure 127: Europe Market Value (USD Million) by Mode of Action, 2025-2035
  • Figure 128: Europe Market Value (USD Million) by Source, 2025-2035
  • Figure 129: Europe Market Value (USD Million) by Delivery System, 2025-2035
  • Figure 130: Europe Market Value (USD Million) by Physical Form, 2025-2035
  • Figure 131: Europe Market Value (USD Million) by Application, 2025-2035
  • Figure 132: Europe Market Value (USD Million) by End Use, 2025-2035
  • Figure 133: Europe Market Value (USD Million) by Country, 2025-2035
  • Figure 134: Europe Market Value (USD Million) Analysis by Country, 2020-2035
  • Figure 135: Europe Market Volume (Units) Analysis by Country, 2020-2035
  • Figure 136: Europe Market Value Share (%) and BPS Analysis by Country, 2025-2035
  • Figure 137: Europe Market Y-o-Y Growth (%) Projections by Country, 2025-2035
  • Figure 138: Europe Market Value (USD Million) Analysis by Mode of Action, 2020-2035
  • Figure 139: Europe Market Volume (Units) Analysis by Mode of Action, 2020-2035
  • Figure 140: Europe Market Value Share (%) and BPS Analysis by Mode of Action, 2025-2035
  • Figure 141: Europe Market Y-o-Y Growth (%) Projections by Mode of Action, 2025-2035
  • Figure 142: Europe Market Value (USD Million) Analysis by Source, 2020-2035
  • Figure 143: Europe Market Volume (Units) Analysis by Source, 2020-2035
  • Figure 144: Europe Market Value Share (%) and BPS Analysis by Source, 2025-2035
  • Figure 145: Europe Market Y-o-Y Growth (%) Projections by Source, 2025-2035
  • Figure 146: Europe Market Value (USD Million) Analysis by Delivery System, 2020-2035
  • Figure 147: Europe Market Volume (Units) Analysis by Delivery System, 2020-2035
  • Figure 148: Europe Market Value Share (%) and BPS Analysis by Delivery System, 2025-2035
  • Figure 149: Europe Market Y-o-Y Growth (%) Projections by Delivery System, 2025-2035
  • Figure 150: Europe Market Value (USD Million) Analysis by Physical Form, 2020-2035
  • Figure 151: Europe Market Volume (Units) Analysis by Physical Form, 2020-2035
  • Figure 152: Europe Market Value Share (%) and BPS Analysis by Physical Form, 2025-2035
  • Figure 153: Europe Market Y-o-Y Growth (%) Projections by Physical Form, 2025-2035
  • Figure 154: Europe Market Value (USD Million) Analysis by Application, 2020-2035
  • Figure 155: Europe Market Volume (Units) Analysis by Application, 2020-2035
  • Figure 156: Europe Market Value Share (%) and BPS Analysis by Application, 2025-2035
  • Figure 157: Europe Market Y-o-Y Growth (%) Projections by Application, 2025-2035
  • Figure 158: Europe Market Value (USD Million) Analysis by End Use, 2020-2035
  • Figure 159: Europe Market Volume (Units) Analysis by End Use, 2020-2035
  • Figure 160: Europe Market Value Share (%) and BPS Analysis by End Use, 2025-2035
  • Figure 161: Europe Market Y-o-Y Growth (%) Projections by End Use, 2025-2035
  • Figure 162: Europe Market Attractiveness by Mode of Action, 2025-2035
  • Figure 163: Europe Market Attractiveness by Source, 2025-2035
  • Figure 164: Europe Market Attractiveness by Delivery System, 2025-2035
  • Figure 165: Europe Market Attractiveness by Physical Form, 2025-2035
  • Figure 166: Europe Market Attractiveness by Application, 2025-2035
  • Figure 167: Europe Market Attractiveness by End Use, 2025-2035
  • Figure 168: Europe Market Attractiveness by Country, 2025-2035
  • Figure 169: East Asia Market Value (USD Million) by Mode of Action, 2025-2035
  • Figure 170: East Asia Market Value (USD Million) by Source, 2025-2035
  • Figure 171: East Asia Market Value (USD Million) by Delivery System, 2025-2035
  • Figure 172: East Asia Market Value (USD Million) by Physical Form, 2025-2035
  • Figure 173: East Asia Market Value (USD Million) by Application, 2025-2035
  • Figure 174: East Asia Market Value (USD Million) by End Use, 2025-2035
  • Figure 175: East Asia Market Value (USD Million) by Country, 2025-2035
  • Figure 176: East Asia Market Value (USD Million) Analysis by Country, 2020-2035
  • Figure 177: East Asia Market Volume (Units) Analysis by Country, 2020-2035
  • Figure 178: East Asia Market Value Share (%) and BPS Analysis by Country, 2025-2035
  • Figure 179: East Asia Market Y-o-Y Growth (%) Projections by Country, 2025-2035
  • Figure 180: East Asia Market Value (USD Million) Analysis by Mode of Action, 2020-2035
  • Figure 181: East Asia Market Volume (Units) Analysis by Mode of Action, 2020-2035
  • Figure 182: East Asia Market Value Share (%) and BPS Analysis by Mode of Action, 2025-2035
  • Figure 183: East Asia Market Y-o-Y Growth (%) Projections by Mode of Action, 2025-2035
  • Figure 184: East Asia Market Value (USD Million) Analysis by Source, 2020-2035
  • Figure 185: East Asia Market Volume (Units) Analysis by Source, 2020-2035
  • Figure 186: East Asia Market Value Share (%) and BPS Analysis by Source, 2025-2035
  • Figure 187: East Asia Market Y-o-Y Growth (%) Projections by Source, 2025-2035
  • Figure 188: East Asia Market Value (USD Million) Analysis by Delivery System, 2020-2035
  • Figure 189: East Asia Market Volume (Units) Analysis by Delivery System, 2020-2035
  • Figure 190: East Asia Market Value Share (%) and BPS Analysis by Delivery System, 2025-2035
  • Figure 191: East Asia Market Y-o-Y Growth (%) Projections by Delivery System, 2025-2035
  • Figure 192: East Asia Market Value (USD Million) Analysis by Physical Form, 2020-2035
  • Figure 193: East Asia Market Volume (Units) Analysis by Physical Form, 2020-2035
  • Figure 194: East Asia Market Value Share (%) and BPS Analysis by Physical Form, 2025-2035
  • Figure 195: East Asia Market Y-o-Y Growth (%) Projections by Physical Form, 2025-2035
  • Figure 196: East Asia Market Value (USD Million) Analysis by Application, 2020-2035
  • Figure 197: East Asia Market Volume (Units) Analysis by Application, 2020-2035
  • Figure 198: East Asia Market Value Share (%) and BPS Analysis by Application, 2025-2035
  • Figure 199: East Asia Market Y-o-Y Growth (%) Projections by Application, 2025-2035
  • Figure 200: East Asia Market Value (USD Million) Analysis by End Use, 2020-2035
  • Figure 201: East Asia Market Volume (Units) Analysis by End Use, 2020-2035
  • Figure 202: East Asia Market Value Share (%) and BPS Analysis by End Use, 2025-2035
  • Figure 203: East Asia Market Y-o-Y Growth (%) Projections by End Use, 2025-2035
  • Figure 204: East Asia Market Attractiveness by Mode of Action, 2025-2035
  • Figure 205: East Asia Market Attractiveness by Source, 2025-2035
  • Figure 206: East Asia Market Attractiveness by Delivery System, 2025-2035
  • Figure 207: East Asia Market Attractiveness by Physical Form, 2025-2035
  • Figure 208: East Asia Market Attractiveness by Application, 2025-2035
  • Figure 209: East Asia Market Attractiveness by End Use, 2025-2035
  • Figure 210: East Asia Market Attractiveness by Country, 2025-2035
  • Figure 211: South Asia & Pacific Market Value (USD Million) by Mode of Action, 2025-2035
  • Figure 212: South Asia & Pacific Market Value (USD Million) by Source, 2025-2035
  • Figure 213: South Asia & Pacific Market Value (USD Million) by Delivery System, 2025-2035
  • Figure 214: South Asia & Pacific Market Value (USD Million) by Physical Form, 2025-2035
  • Figure 215: South Asia & Pacific Market Value (USD Million) by Application, 2025-2035
  • Figure 216: South Asia & Pacific Market Value (USD Million) by End Use, 2025-2035
  • Figure 217: South Asia & Pacific Market Value (USD Million) by Country, 2025-2035
  • Figure 218: South Asia & Pacific Market Value (USD Million) Analysis by Country, 2020-2035
  • Figure 219: South Asia & Pacific Market Volume (Units) Analysis by Country, 2020-2035
  • Figure 220: South Asia & Pacific Market Value Share (%) and BPS Analysis by Country, 2025-2035
  • Figure 221: South Asia & Pacific Market Y-o-Y Growth (%) Projections by Country, 2025-2035
  • Figure 222: South Asia & Pacific Market Value (USD Million) Analysis by Mode of Action, 2020-2035
  • Figure 223: South Asia & Pacific Market Volume (Units) Analysis by Mode of Action, 2020-2035
  • Figure 224: South Asia & Pacific Market Value Share (%) and BPS Analysis by Mode of Action, 2025-2035
  • Figure 225: South Asia & Pacific Market Y-o-Y Growth (%) Projections by Mode of Action, 2025-2035
  • Figure 226: South Asia & Pacific Market Value (USD Million) Analysis by Source, 2020-2035
  • Figure 227: South Asia & Pacific Market Volume (Units) Analysis by Source, 2020-2035
  • Figure 228: South Asia & Pacific Market Value Share (%) and BPS Analysis by Source, 2025-2035
  • Figure 229: South Asia & Pacific Market Y-o-Y Growth (%) Projections by Source, 2025-2035
  • Figure 230: South Asia & Pacific Market Value (USD Million) Analysis by Delivery System, 2020-2035
  • Figure 231: South Asia & Pacific Market Volume (Units) Analysis by Delivery System, 2020-2035
  • Figure 232: South Asia & Pacific Market Value Share (%) and BPS Analysis by Delivery System, 2025-2035
  • Figure 233: South Asia & Pacific Market Y-o-Y Growth (%) Projections by Delivery System, 2025-2035
  • Figure 234: South Asia & Pacific Market Value (USD Million) Analysis by Physical Form, 2020-2035
  • Figure 235: South Asia & Pacific Market Volume (Units) Analysis by Physical Form, 2020-2035
  • Figure 236: South Asia & Pacific Market Value Share (%) and BPS Analysis by Physical Form, 2025-2035
  • Figure 237: South Asia & Pacific Market Y-o-Y Growth (%) Projections by Physical Form, 2025-2035
  • Figure 238: South Asia & Pacific Market Value (USD Million) Analysis by Application, 2020-2035
  • Figure 239: South Asia & Pacific Market Volume (Units) Analysis by Application, 2020-2035
  • Figure 240: South Asia & Pacific Market Value Share (%) and BPS Analysis by Application, 2025-2035
  • Figure 241: South Asia & Pacific Market Y-o-Y Growth (%) Projections by Application, 2025-2035
  • Figure 242: South Asia & Pacific Market Value (USD Million) Analysis by End Use, 2020-2035
  • Figure 243: South Asia & Pacific Market Volume (Units) Analysis by End Use, 2020-2035
  • Figure 244: South Asia & Pacific Market Value Share (%) and BPS Analysis by End Use, 2025-2035
  • Figure 245: South Asia & Pacific Market Y-o-Y Growth (%) Projections by End Use, 2025-2035
  • Figure 246: South Asia & Pacific Market Attractiveness by Mode of Action, 2025-2035
  • Figure 247: South Asia & Pacific Market Attractiveness by Source, 2025-2035
  • Figure 248: South Asia & Pacific Market Attractiveness by Delivery System, 2025-2035
  • Figure 249: South Asia & Pacific Market Attractiveness by Physical Form, 2025-2035
  • Figure 250: South Asia & Pacific Market Attractiveness by Application, 2025-2035
  • Figure 251: South Asia & Pacific Market Attractiveness by End Use, 2025-2035
  • Figure 252: South Asia & Pacific Market Attractiveness by Country, 2025-2035
  • Figure 253: Middle East and Africa Market Value (USD Million) by Mode of Action, 2025-2035
  • Figure 254: Middle East and Africa Market Value (USD Million) by Source, 2025-2035
  • Figure 255: Middle East and Africa Market Value (USD Million) by Delivery System, 2025-2035
  • Figure 256: Middle East and Africa Market Value (USD Million) by Physical Form, 2025-2035
  • Figure 257: Middle East and Africa Market Value (USD Million) by Application, 2025-2035
  • Figure 258: Middle East and Africa Market Value (USD Million) by End Use, 2025-2035
  • Figure 259: Middle East and Africa Market Value (USD Million) by Country, 2025-2035
  • Figure 260: Middle East and Africa Market Value (USD Million) Analysis by Country, 2020-2035
  • Figure 261: Middle East and Africa Market Volume (Units) Analysis by Country, 2020-2035
  • Figure 262: Middle East and Africa Market Value Share (%) and BPS Analysis by Country, 2025-2035
  • Figure 263: Middle East and Africa Market Y-o-Y Growth (%) Projections by Country, 2025-2035
  • Figure 264: Middle East and Africa Market Value (USD Million) Analysis by Mode of Action, 2020-2035
  • Figure 265: Middle East and Africa Market Volume (Units) Analysis by Mode of Action, 2020-2035
  • Figure 266: Middle East and Africa Market Value Share (%) and BPS Analysis by Mode of Action, 2025-2035
  • Figure 267: Middle East and Africa Market Y-o-Y Growth (%) Projections by Mode of Action, 2025-2035
  • Figure 268: Middle East and Africa Market Value (USD Million) Analysis by Source, 2020-2035
  • Figure 269: Middle East and Africa Market Volume (Units) Analysis by Source, 2020-2035
  • Figure 270: Middle East and Africa Market Value Share (%) and BPS Analysis by Source, 2025-2035
  • Figure 271: Middle East and Africa Market Y-o-Y Growth (%) Projections by Source, 2025-2035
  • Figure 272: Middle East and Africa Market Value (USD Million) Analysis by Delivery System, 2020-2035
  • Figure 273: Middle East and Africa Market Volume (Units) Analysis by Delivery System, 2020-2035
  • Figure 274: Middle East and Africa Market Value Share (%) and BPS Analysis by Delivery System, 2025-2035
  • Figure 275: Middle East and Africa Market Y-o-Y Growth (%) Projections by Delivery System, 2025-2035
  • Figure 276: Middle East and Africa Market Value (USD Million) Analysis by Physical Form, 2020-2035
  • Figure 277: Middle East and Africa Market Volume (Units) Analysis by Physical Form, 2020-2035
  • Figure 278: Middle East and Africa Market Value Share (%) and BPS Analysis by Physical Form, 2025-2035
  • Figure 279: Middle East and Africa Market Y-o-Y Growth (%) Projections by Physical Form, 2025-2035
  • Figure 280: Middle East and Africa Market Value (USD Million) Analysis by Application, 2020-2035
  • Figure 281: Middle East and Africa Market Volume (Units) Analysis by Application, 2020-2035
  • Figure 282: Middle East and Africa Market Value Share (%) and BPS Analysis by Application, 2025-2035
  • Figure 283: Middle East and Africa Market Y-o-Y Growth (%) Projections by Application, 2025-2035
  • Figure 284: Middle East and Africa Market Value (USD Million) Analysis by End Use, 2020-2035
  • Figure 285: Middle East and Africa Market Volume (Units) Analysis by End Use, 2020-2035
  • Figure 286: Middle East and Africa Market Value Share (%) and BPS Analysis by End Use, 2025-2035
  • Figure 287: Middle East and Africa Market Y-o-Y Growth (%) Projections by End Use, 2025-2035
  • Figure 288: Middle East and Africa Market Attractiveness by Mode of Action, 2025-2035
  • Figure 289: Middle East and Africa Market Attractiveness by Source, 2025-2035
  • Figure 290: Middle East and Africa Market Attractiveness by Delivery System, 2025-2035
  • Figure 291: Middle East and Africa Market Attractiveness by Physical Form, 2025-2035
  • Figure 292: Middle East and Africa Market Attractiveness by Application, 2025-2035
  • Figure 293: Middle East and Africa Market Attractiveness by End Use, 2025-2035
  • Figure 294: Middle East and Africa Market Attractiveness by Country, 2025-2035

Frequently Asked Questions

How big is the Anti-Allergenic Agents Market in 2025?

The global Anti-Allergenic Agents Market is estimated to be valued at USD 1,703.7 million in 2025.

What will be the size of the Anti-Allergenic Agents Market in 2035?

The market size for the Anti-Allergenic Agents Market is projected to reach USD 3,903.6 million by 2035.

How much will be the Anti-Allergenic Agents Market growth between 2025 and 2035?

The Anti-Allergenic Agents Market is expected to grow at a CAGR of 8.6% between 2025 and 2035.

What are the key product types in the Anti-Allergenic Agents Market?

The key product types in the Anti-Allergenic Agents Market are barrier-support actives, anti-irritant modulators, neurosensory comfort modulators, and microbiome-support actives.

Which segment is expected to contribute significant share in the Anti-Allergenic Agents Market in 2025?

In terms of source, botanical ingredients are projected to command 62.0% share in the Anti-Allergenic Agents Market in 2025.

Explore Similar Insights

Future Market Insights

Anti-Allergenic Agents Market

Chat With

MaRIA

Hi There, I am MaRIA, Your Market Research Intelligence Assistant. How may I help you?