Anti-Foaming Agents / Defoamers Market Size and Share Forecast Outlook 2025 to 2035

The Anti-Foaming Agents / Defoamers Market is expected to record a valuation of USD 1,151.6 million in 2025 and USD 2,253.4 million in 2035, with an increase of USD 1,101.8 million, which equals a growth of 95.6% over the decade. The overall expansion represents a CAGR of 6.9% and nearly a 2X increase in market size.
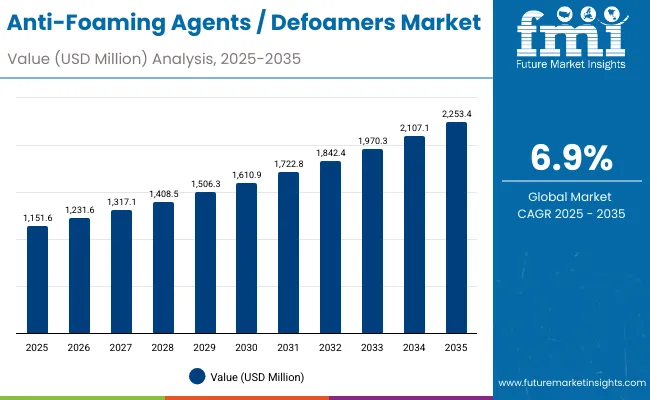
Quick Stats for Anti-Foaming Agents / Defoamers Market

  • Anti-Foaming Agents / Defoamers Market Value (2025): USD 1,151.6 million
  • Anti-Foaming Agents / Defoamers Market Forecast Value (2035): USD 2,253.4 million
  • Anti-Foaming Agents / Defoamers Market Forecast CAGR: 6.9%
  • Leading Segment in 2025: Silicone-based (57%)
  • Key Growth Regions: USA, China, India, Japan, Europe
  • Top Key Players: Dow, Wacker, Momentive, Evonik, BASF, Elkem, Shin-Etsu, Ashland, BYK, Elementis

Anti Foaming Agents Defoamers Market

Anti-Foaming Agents / Defoamers Market Key Takeaways

Metric Value
Anti-Foaming Agents / Defoamers Market Estimated Value in (2025E) USD 1,151.6 million
Anti-Foaming Agents / Defoamers Market Forecast Value in (2035F) USD 2,253.4 million
Forecast CAGR (2025 to 2035) 6.9%

During the first five-year period from 2025 to 2030, the market increases from USD 1,151.6 million to USD 1,610.9 million, adding USD 459.3 million, which accounts for 41.7% of the total decade growth. This phase records steady adoption in skincare, haircare, and oral care processing, driven by the need for efficient foam suppression in both cold and hot processing conditions. Silicone-based defoamers dominate this period as they cater to over 57% of industrial and cosmetic applications requiring reliable and high-performance foam control.

The second half from 2030 to 2035 contributes USD 642.5 million, equal to 58.3% of total growth, as the market jumps from USD 1,610.9 million to USD 2,253.4 million. This acceleration is powered by widespread deployment of high-shear stable and broad-pH formulations that can sustain under diverse processing environments. Innovations in vegetable-oil-based and mineral-based defoamers gain traction due to clean-label positioning, sustainability focus, and consumer preference for naturally derived ingredients. Emulsion-based formats continue to be dominant, but dispersions and powdered forms capture additional share as manufacturers look for versatile and cost-efficient solutions.

From 2020 to 2024, the Anti-Foaming Agents / Defoamers Market grew from USD 945.2 million to USD 1,100.0 million, driven by silicone and hydrocarbon-based formulations dominating industrial processing. During this period, the competitive landscape was led by multinational chemical companies controlling nearly 65% of revenue, with leaders such as Dow, Wacker, and BASF focusing on tailored silicone-based systems for high-volume manufacturing. Competitive differentiation relied on thermal stability, efficacy under shear stress, and cost competitiveness, while mineral and vegetable-oil-based solutions were often limited to niche applications with minimal traction.

Demand for defoamers expands to USD 1,151.6 million in 2025, and the revenue mix begins to shift as natural-origin and high-performance stable formulations grow to over 45% share by the end of the forecast period. Traditional silicone leaders face rising competition from players offering biodegradable, low-VOC, and sustainable alternatives. Major companies are pivoting to hybrid portfolios, combining silicone efficacy with plant-based versatility, to retain relevance in highly regulated personal care markets. Emerging entrants specializing in multifunctional defoamers compatible with microbiome-balancing and pH-sensitive formulations are gaining share. The competitive advantage is moving away from price competitiveness alone to sustainability, regulatory compliance, and adaptability across diverse formulations.

Why the Anti-Foaming Agents / Defoamers Market is Growing?

Advances in formulation chemistry have improved stability and efficiency, allowing for broader adoption across personal care and industrial applications. Silicone-based defoamers remain popular due to their superior performance in high-shear and broad pH conditions, which are common in skincare, haircare, and bath & shower processing. The rise of emulsion technology has contributed to enhanced dispersion, easier incorporation into formulations, and reduced dosage requirements, making them the preferred format for both cost-sensitive and performance-driven markets.

Expansion of oral care and leave-on cosmetic formulations has further fueled market growth. Increasing focus on sustainability and clean-label solutions has opened opportunities for vegetable-oil-based defoamers, which align with consumer expectations for natural ingredients. Segment growth is expected to be led by silicone-based solutions in base type, emulsion in physical form, and high-shear stable defoamers in process compatibility due to their adaptability and effectiveness. Emerging markets such as India and Japan are set to outpace global averages due to premiumization and strong consumer adoption of advanced dermocosmetic and biotech-driven formulations.

Segmental Analysis

The market is segmented by base type, physical form, process compatibility, application role, end use, and geography. By base type, categories include silicone-based, hydrocarbon-based, mineral-based, and vegetable-oil-based solutions, highlighting the dominance of silicone but growing interest in natural oils. Physical form classification covers 100% active, emulsion, dispersion, and powdered forms to cater to diverse formulation needs. Based on process compatibility, segmentation includes cold-process, hot-process, high-shear stable, and broad-pH solutions, reflecting demand for versatility in manufacturing.

In terms of application role, categories encompass manufacturing process aid, rinse-off finished formulas, and leave-on finished formulas, capturing the value across both upstream and downstream product development. End uses include skincare processing, haircare processing, bath & shower processing, and oral care processing, representing the breadth of personal care applications. Regionally, the scope spans North America, Latin America, Europe, East Asia, South Asia & Pacific, and the Middle East & Africa.
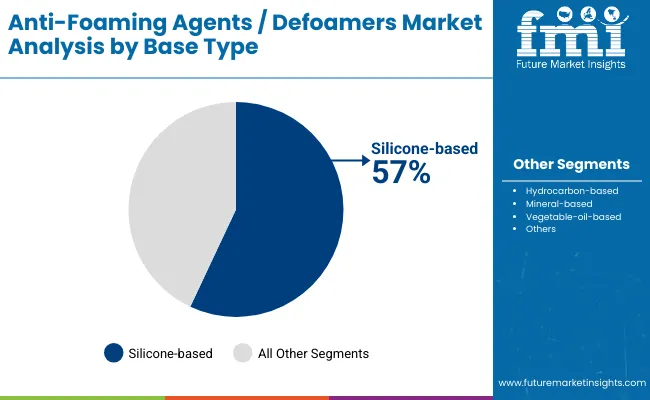
Insights into the Base Type Segment with Silicone-based Leading in Market Share

Anti Foaming Agents Defoamers Market By Base

Base Type Value Share% 2025
Silicone-based 57%
Others 43.0%

The silicone-based segment is projected to contribute 57% of the Anti-Foaming Agents / Defoamers Market revenue in 2025, maintaining its lead as the dominant base type category. This is driven by ongoing demand for highly effective foam control agents that provide stability under high shear and diverse pH conditions. Silicone-based formulations have been prioritized by manufacturers seeking reliable, consistent performance in both personal care and industrial applications.

The segment’s growth is also supported by the development of advanced silicone emulsions and dispersions that improve compatibility with water-based systems. As sustainability and regulatory compliance become increasingly critical, silicone-based defoamers are being reformulated to balance performance with eco-friendly requirements. The silicone-based segment is expected to retain its position as the backbone of defoamer solutions, particularly in skincare, haircare, and bath & shower processing.
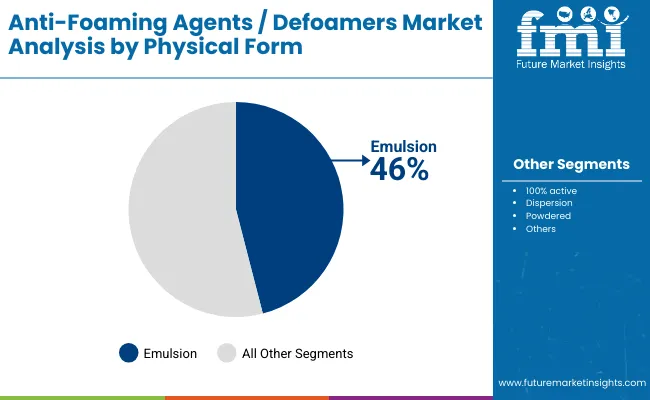
Insights into the Physical Form Segment with Emulsions Dominating the Demand

Anti Foaming Agents Defoamers Market By Physical

Physical Form Value Share% 2025
Emulsion 46%
Others 54.0%

The emulsion segment is forecasted to hold 46% of the Anti-Foaming Agents / Defoamers Market share in 2025, led by its application in water-based formulations where easy dispersion and uniform performance are critical. Emulsion defoamers are favored for their ability to deliver consistent results at lower dosages, making them highly cost-efficient across large-scale manufacturing processes.

Their ease of incorporation into finished formulations and versatility across rinse-off and leave-on products have facilitated widespread adoption in the personal care industry. The segment’s growth is bolstered by technological advancements that improve stability, extend shelf life, and reduce separation issues in challenging environments. As manufacturers increasingly require multifunctional and ready-to-use solutions, emulsion formats are expected to continue their dominance in the market.
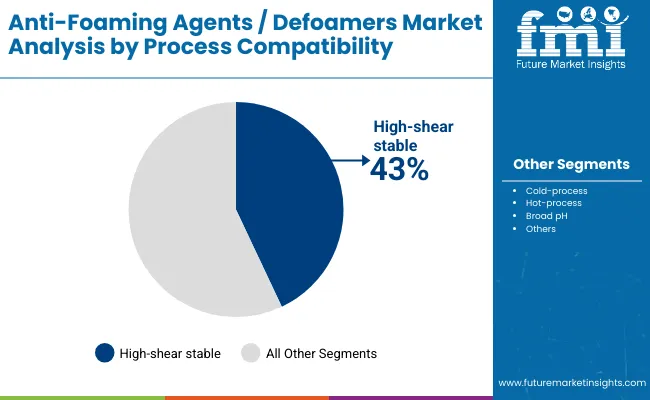
Insights into the Process Compatibility Segment with High-Shear Stable Formulations Leading

Anti Foaming Agents Defoamers Market By Compatibility

Process Compatibility Value Share% 2025
High-shear stable 43%
Others 57.0%

The high-shear stable segment is projected to account for 43% of the Anti-Foaming Agents / Defoamers Market revenue in 2025, establishing it as the leading process compatibility type. These defoamers are preferred for their ability to withstand demanding processing conditions, where intense mixing and mechanical forces often degrade conventional formulations.

Their suitability for high-speed manufacturing of skincare, haircare, and oral care products has made them a popular choice across both mass and premium brands. Developments in silicone chemistry and additive blends have enhanced stability, ensuring longer-lasting foam suppression without compromising product aesthetics. Given their balance of robustness and versatility, high-shear stable defoamers are expected to maintain their leading role in the global market.

What are the Drivers, Restraints, and Key Trends of the Anti-Foaming Agents / Defoamers Market?

Drivers

Rising Demand for Stable Processing in High-Shear Personal Care Manufacturing

A major driver is the increasing complexity of formulations in skincare, haircare, and oral care products, which rely on high-shear manufacturing processes such as homogenization and high-speed mixing. These processes generate persistent foam that reduces efficiency and compromises product uniformity. The demand for high-shear stable defoamers already accounting for 43% of the market in 2025 is expanding rapidly because they ensure smoother processing, shorter production cycles, and lower rework costs. In markets like the USA and Europe, where premium dermocosmetics and microbiome-friendly formulations are booming, the ability to maintain foam control without destabilizing active ingredients has positioned high-shear stable silicone defoamers as indispensable.

Shift Toward Sustainable and Natural-Origin Ingredients in Formulation Aid

Consumer and regulatory pressures are driving personal care manufacturers to adopt vegetable-oil-based and mineral-based defoamers as alternatives to traditional silicone and hydrocarbon systems. Emerging markets like India and Japan, where natural beauty and clean-label products dominate, are witnessing a surge in adoption of vegetable-oil-based defoamers. These align with the sustainability goals of global brands and help differentiate products in competitive retail environments. Companies such as BASF and Evonik are investing in hybrid solutions that combine the efficiency of silicones with bio-based carriers, offering formulators both sustainability compliance and high performance.

Restraints

Regulatory and Labeling Challenges for Silicone-Based Formulations

While silicone-based defoamers hold 57% market share in 2025, their long-term dominance is being challenged by increasingly strict regulatory and labeling requirements. In Europe, restrictions on certain silicones in rinse-off applications due to environmental persistence are forcing manufacturers to reformulate or phase out certain grades. This creates additional costs for producers and can limit market access in regions where eco-certification (e.g., COSMOS, ECOCERT) is critical for brand positioning. As a result, manufacturers that rely heavily on silicones face hurdles in aligning with sustainability-driven markets.

Cost Sensitivity in Emerging Markets Affecting Premium Formulations

In regions like South Asia & Pacific and parts of Latin America, cost-sensitive consumer markets often prioritize affordability over advanced formulation performance. Premium defoamers, particularly high-shear stable silicones, are sometimes too costly for local manufacturers, leading them to adopt cheaper, less effective alternatives. This slows penetration of advanced defoaming solutions in mass-market product lines, especially in bath & shower and oral care categories where price competition is intense. This cost barrier restrains growth, even though demand for basic foam suppression remains high.

Key Trends

Integration of Defoamers with Multi-Functional Cosmetic Additives

A significant trend is the shift toward multifunctional defoamers that combine foam suppression with added benefits such as emulsification, texture enhancement, or skin-feel improvement. Brands are seeking to minimize ingredient lists for clean-label positioning, so suppliers are innovating with defoamers that serve dual roles in formulations. For example, emulsion-based defoamers are being tailored not only to suppress foam but also to contribute to viscosity control in haircare and skincare creams. This trend is particularly evident in Japan, where biotech-driven multifunctional ingredients are accelerating adoption in premium cosmetic segments.

Growth of Emulsion-Based Formats for Ease of Incorporation

Emulsions, holding 46% share in 2025, are rapidly becoming the industry standard due to their ease of handling, dispersion, and compatibility with water-based formulations. Their growth is tied to increasing demand for rinse-off and leave-on personal care products, where uniform distribution of defoamers is critical for performance. Innovations in low-VOC and preservative-free emulsions are also aligning with clean-beauty standards, especially in Europe and North America. This trend is reinforced by global suppliers like Wacker and Momentive, who are investing in next-generation emulsions that improve stability and reduce dosage needs.
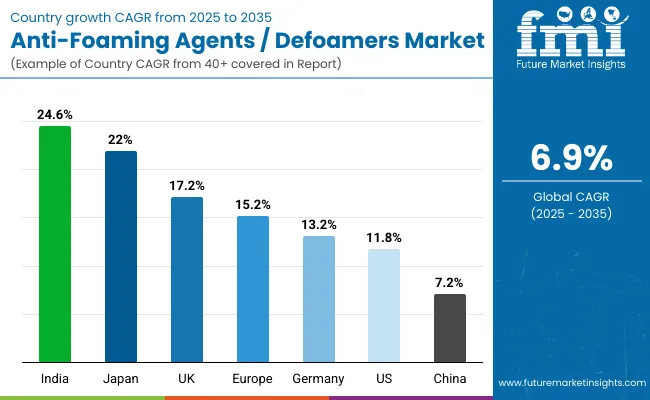
Analysis of Anti-Foaming Agents / Defoamers Market By Key Countries

Anti Foaming Agents Defoamers Market By Country

Countries Estimated CAGR (2025 to 2035)
China 7.2%
USA 11.8%
India 24.6%
UK 17.2%
Germany 13.2%
Japan 22.0%
Europe 15.2%

The Anti-Foaming Agents / Defoamers Market shows strong regional contrasts in growth trajectories between 2025 and 2035. India is expected to record the fastest CAGR at 24.6%, driven by a combination of rapid industrial expansion in personal care manufacturing and consumer preference for affordable yet effective skincare and haircare products. Local manufacturers are increasingly integrating vegetable-oil-based defoamers to align with clean-label and herbal beauty trends, while multinational suppliers target India as a volume-led growth hub.

Japan follows closely with a CAGR of 22.0%, reflecting premiumization in dermocosmetics and a rising demand for multifunctional, biotech-derived defoamers compatible with advanced formulations. The USA at 11.8% CAGR highlights its position as a stable yet innovation-driven market, where silicone-based and high-shear stable defoamers remain dominant, but sustainability pressures are pushing companies toward hybrid systems that balance performance with eco-friendly attributes.

In Europe, overall growth stands at 15.2% CAGR, though individual countries such as the UK (17.2%) and Germany (13.2%) display distinct patterns. The UK is accelerating adoption of eco-certified emulsions and powdered defoamers, supported by strong consumer demand for clean-label bath and shower products. Germany’s growth is influenced by the country’s stringent regulatory environment, encouraging manufacturers to pivot from traditional silicone-based formulations toward mineral and vegetable-oil-based alternatives.

China, with a moderate 7.2% CAGR, is expanding steadily as a large-scale producer of personal care products, emphasizing cost-efficient emulsion and dispersion formats to serve domestic and export markets. Together, these country-level growth rates underscore how both affordability-driven adoption in emerging economies and innovation-led premiumization in developed markets are shaping the global trajectory of the defoamers industry.
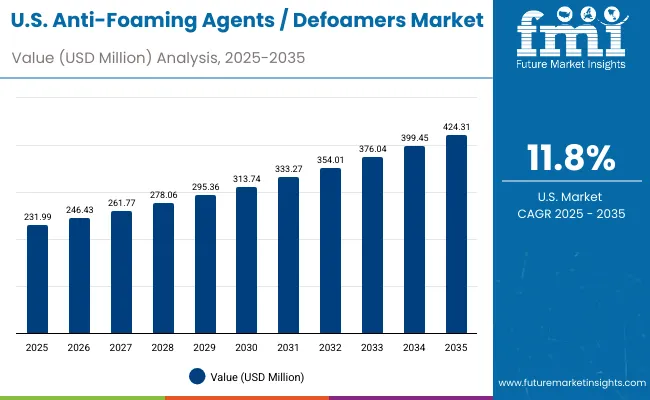
Sales Outlook for Anti-Foaming Agents / Defoamers in the United States

Anti Foaming Agents Defoamers Market Usa

Year USA Anti-Foaming Agents / Defoamers Market (USD Million)
2025 231.99
2026 246.43
2027 261.77
2028 278.06
2029 295.36
2030 313.74
2031 333.27
2032 354.01
2033 376.04
2034 399.45
2035 424.31

The Anti-Foaming Agents / Defoamers Market in the United States is projected to grow at a CAGR of 11.8%, led by strong adoption across skincare, haircare, and bath & shower processing industries. Premium cosmetic manufacturers are increasingly using high-shear stable silicone-based defoamers, which accounted for over 57% of the market in 2025, to maintain consistent performance in fast production lines. Emulsion formats are also gaining momentum, particularly in rinse-off and leave-on applications where uniform distribution is critical. Sustainability pressures are driving innovation toward hybrid silicone-vegetable blends that meet eco-labeling standards while retaining performance.

  • High-shear stable silicone-based defoamers dominate USA cosmetic manufacturing.
  • Emulsions are preferred for rinse-off and leave-on formulations in skincare and haircare.
  • Hybrid systems balancing sustainability and efficacy are gaining commercial traction.

Growth and Expansion Outlook for Anti-Foaming Agents / Defoamers in the United Kingdom

The Anti-Foaming Agents / Defoamers Market in the United Kingdom is expected to grow at a CAGR of 17.2%, supported by demand in premium haircare and bath & shower categories. UK formulators are prioritizing eco-certified emulsions and mineral-oil alternatives to replace conventional silicones in rinse-off applications. Niche growth is also observed in oral care, where microfoam suppression is critical for product stability and user experience. Regulatory compliance with EU and UK standards has encouraged suppliers to reformulate toward clean-label and biodegradable options, creating opportunities for vegetable-oil-based defoamers.

  • Eco-certified emulsions are driving rinse-off product formulations
  • Oral care brands are integrating defoamers to enhance stability in microfoam control.
  • Vegetable-oil-based alternatives are aligning with sustainability-focused consumer trends.

Growth and Expansion Outlook for Anti-Foaming Agents / Defoamers in India

India is witnessing rapid growth in the Anti-Foaming Agents / Defoamers Market, which is forecast to expand at a CAGR of 24.6% through 2035, the fastest globally. A sharp increase in demand from mass-market skincare and haircare brands is driven by affordability and rising awareness among consumers in tier-2 and tier-3 cities. Local manufacturers are adopting vegetable-oil-based and mineral-based defoamers to align with herbal and ayurvedic beauty trends, while multinational players are positioning silicone emulsions for premium categories. Oral care processing is also gaining importance, with Indian brands focusing on low-cost defoamer solutions to scale production volumes.
  • Mass-market adoption is fueling demand in skincare and haircare processing.
  • Vegetable-oil-based defoamers resonate with herbal and ayurvedic brand positioning.
  • Oral care brands are scaling cost-effective defoamer solutions for large-volume production.

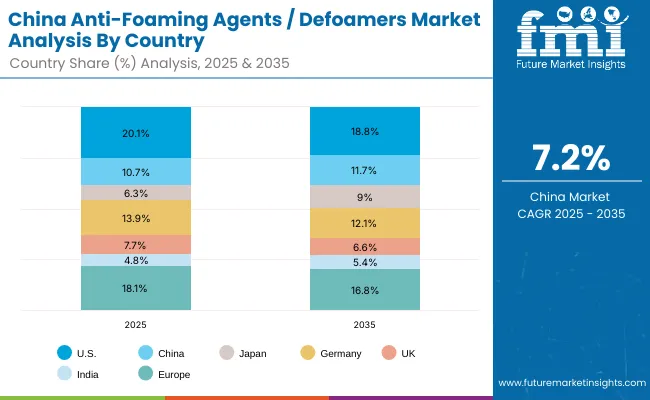
Sales Outlook for Anti-Foaming Agents / Defoamers in China

Anti Foaming Agents Defoamers Market China

Countries 2025 Share (%)
USA 20.1%
China 10.7%
Japan 6.3%
Germany 13.9%
UK 7.7%
India 4.8%
Europe 18.1%
Countries 2035 Share (%)
USA 18.8%
China 11.7%
Japan 9.0%
Germany 12.1%
UK 6.6%
India 5.4%
Europe 16.8%

The Anti-Foaming Agents / Defoamers Market in China is expected to grow at a CAGR of 7.2%, reflecting steady but competitive expansion. Growth is primarily driven by large-scale skincare and bath & shower manufacturing hubs that emphasize cost-efficient emulsion and dispersion defoamers. Domestic producers are scaling affordable, high-volume emulsions to meet export requirements, particularly for Southeast Asian markets. Multinational players are investing in silicone-based high-shear stable systems for premium brands, but adoption remains limited to urban consumer segments. The government’s focus on green chemistry is encouraging suppliers to experiment with hybrid and mineral-based solutions.
  • Large-scale adoption of emulsions and dispersions supports cost-efficient manufacturing.
  • Domestic producers are exporting affordable defoamers to Asia-Pacific markets.
  • Green chemistry policies are pushing innovation in mineral and hybrid formulations.

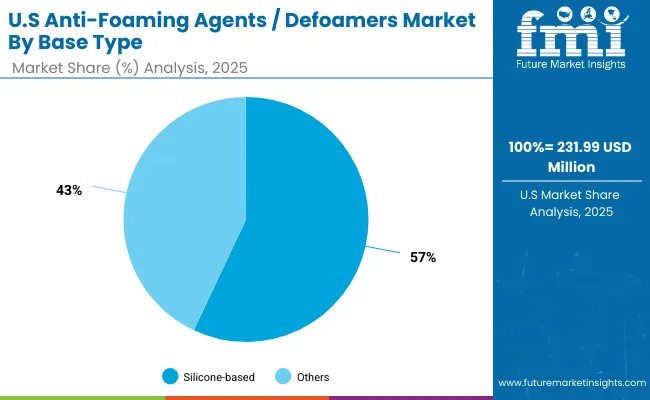
Growth Outlook for Anti-Foaming Agents / Defoamers Market in the United States

Anti Foaming Agents Defoamers Market Usa 2

USA by base type Value Share% 2025
Silicone-based 57%
Others 43.0%

The Anti-Foaming Agents / Defoamers Market in the United States is projected at USD 231.99 million in 2025, expanding at a CAGR of 11.8% through 2035. Silicone-based defoamers contribute 57%, while other types (hydrocarbon, mineral, vegetable-oil-based) collectively account for 43%, highlighting the continued dominance of silicone solutions in the USA processing landscape. This leadership stems from their superior efficiency in high-shear and broad pH manufacturing environments, making them indispensable in skincare, haircare, and bath & shower processing.

Growing reliance on high-speed manufacturing lines and stringent product consistency requirements is a key catalyst, as foam control is critical to batch quality and throughput. USA manufacturers are also prioritizing emulsions within silicone systems, which disperse easily in aqueous formulations and improve cost efficiency. At the same time, pressure from sustainability-conscious consumers is nudging suppliers to explore hybrid silicone-vegetable blends, aligning with regulatory and eco-label standards. These dynamics ensure silicone’s strong position while opening pathways for natural alternatives to expand steadily.
  • Market in the USA holds share of 20.1% in 2025 in the global market.
  • Silicone-based defoamers lead at 57% vs 43%.
  • Growth supported by demand for high-shear stable and eco-compliant emulsions.

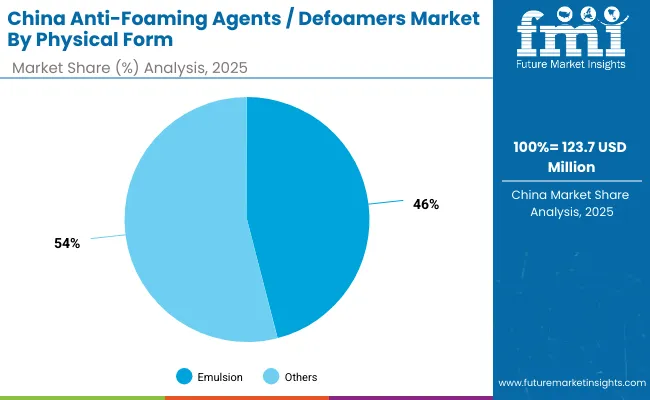
Opportunity Analysis of China Anti-Foaming Agents / Defoamers Market

Anti Foaming Agents Defoamers Market China 2

China by Physical Form Value Share% 2025
Emulsion 46%
Others 54.0%

The Anti-Foaming Agents / Defoamers Market in China is valued at USD 123.7 million in 2025, growing at a CAGR of 7.2% through 2035. Emulsion formats lead at 46%, followed by other physical forms (100% active, dispersions, powdered) at 54%. The dominance of emulsions reflects the large-scale adoption of water-based skincare and bath & shower formulations across Chinese manufacturing hubs, where cost efficiency and ease of incorporation are essential.

This advantage positions emulsions as a preferred choice for both domestic and export-oriented producers. Affordable emulsions supplied by local firms cater to mass-market brands, while multinationals invest in premium, high-shear stable emulsions for dermocosmetic applications in tier-1 cities. Broader process compatibility and scalability make emulsions indispensable to China’s rapidly growing personal care sector. As regulatory emphasis on green chemistry expands, hybrid emulsions combining silicone and vegetable-oil bases are expected to rise, balancing cost and compliance.
  • Market size for China in 2025 is USD 123.7 million.
  • Global market share is approximately 10.7% in 2025.
  • Emulsion formats lead at 46%, driven by large-scale water-based formulation demand.

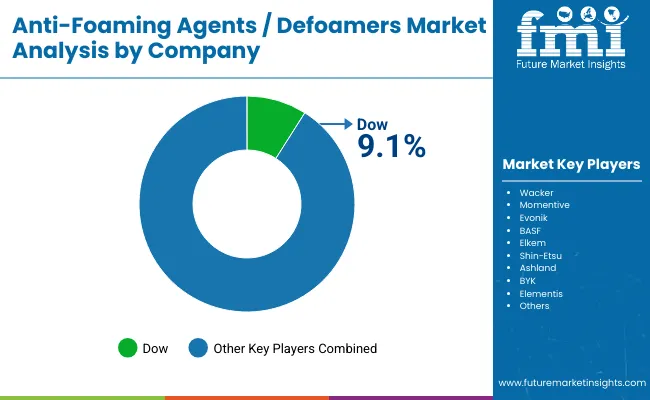
Competitive Landscape of Anti-Foaming Agents / Defoamers Market

Anti Foaming Agents Defoamers Market By Company

The Anti-Foaming Agents / Defoamers Market is moderately consolidated, with chemical giants, mid-tier specialty players, and regional suppliers competing across personal care, industrial processing, and oral care formulations. Global leaders such as Dow, Wacker, BASF, Evonik, and Momentive hold significant share, driven by extensive silicone-based portfolios, advanced high-shear stable systems, and strong penetration in premium skincare and haircare markets. Their strategies increasingly emphasize eco-compliant emulsions, hybrid formulations, and integrated solutions that align with sustainability commitments.

Established mid-sized players like Elkem, Shin-Etsu, Ashland, BYK, and Elementis serve demand for versatile dispersions, emulsions, and powdered formats that balance cost and performance. These companies are accelerating adoption in oral care and bath & shower segments, where ease of use and regulatory compliance are critical.

Niche-focused providers are responding with natural-origin and mineral-based alternatives, catering to herbal and ayurvedic personal care in markets like India, as well as clean-label certified products in the UK and Europe. Competitive differentiation is shifting away from cost-driven formulations toward sustainability, regulatory adaptability, and innovation in multifunctional defoamers that deliver both foam suppression and texture enhancement.

Key Developments in Anti-Foaming Agents / Defoamers Market

  • On April 25, 2024, Evonik Coating Additives introduced TEGO® Foamex 16 and TEGO® Foamex 11, two new siloxane-based defoamers for waterborne architectural coatings, with near-zero VOC/SVOC content; TEGO Foamex 16 contains ~25% bio-based material and both offer environmentally friendlier alternatives to mineral oil-based defoamers.
  • In late 2024, as part of its next generation product releases, Evonik also launched TEGO Foamex 812, an ultra-efficient, low-VOC defoamer designed for high-solids and waterborne coatings.

Scope of the Report

Item Value
Quantitative Units USD Million
Base Type Silicone-based, Hydrocarbon-based, Mineral-based, Vegetable-oil-based
Physical Form 100% active, Emulsion, Dispersion, Powdered
Process Compatibility Cold-process, Hot-process, High-shear stable, Broad pH
Application Role Manufacturing process aid, Rinse-off finished formulas, Leave-on finished formulas
End Use Skincare processing, Haircare processing, Bath & shower processing, Oral care processing
Regions Covered North America, Europe, East Asia, South Asia & Pacific, Latin America, Middle East & Africa
Country Covered United States, Canada, Germany, France, United Kingdom, China, Japan, India, Brazil, South Africa
Key Companies Profiled Dow, Wacker, Momentive, Evonik, BASF, Elkem, Shin-Etsu, Ashland, BYK, Elementis
Additional Attributes Dollar sales by base type and physical form, adoption trends in skincare and haircare formulations, rising demand for high-shear stable and broad-pH defoamers, sector-specific growth in bath & shower and oral care, hybrid silicone-vegetable innovations, regional growth influenced by clean-label and sustainability initiatives, and advancements in emulsion and dispersion formats.

Key Segments

By Base Type:

  • Silicone-based
  • Hydrocarbon-based
  • Mineral-based
  • Vegetable-oil-based

By Process Compatibility:

  • Cold-process
  • Hot-process
  • High-shear stable
  • Broad pH

By End Use:

  • Skincare processing
  • Haircare processing
  • Bath & shower processing
  • Oral care processing

By Physical Form:

  • 100% active
  • Powdered
  • Emulsion
  • Dispersion

By Application Role:

  • Manufacturing process aid
  • Rinse-off finished formulas
  • Leave-on finished formulas

By Region:

  • North America
  • Latin America
  • Europe
  • East Asia
  • South Asia & Pacific
  • Middle East and Africa

Table of Content

  1. Executive Summary
    • Global Market Outlook
    • Demand-side Trends
    • Supply-side Trends
    • Technology Roadmap Analysis
    • Analysis and Recommendations
  2. Market Overview
    • Market Coverage / Taxonomy
    • Market Definition / Scope / Limitations
  3. Market Background
    • Market Dynamics
      • Drivers
      • Restraints
      • Opportunity
      • Trends
    • Scenario Forecast
      • Demand in Optimistic Scenario
      • Demand in Likely Scenario
      • Demand in Conservative Scenario
    • Opportunity Map Analysis
    • Product Life Cycle Analysis
    • Supply Chain Analysis
      • Supply Side Participants and their Roles
        • Producers
        • Mid-Level Participants (Traders/ Agents/ Brokers)
        • Wholesalers and Distributors
      • Value Added and Value Created at Node in the Supply Chain
      • List of Raw Material Suppliers
      • List of Existing and Potential Buyer’s
    • Investment Feasibility Matrix
    • Value Chain Analysis
      • Profit Margin Analysis
      • Wholesalers and Distributors
      • Retailers
    • PESTLE and Porter’s Analysis
    • Regulatory Landscape
      • By Key Regions
      • By Key Countries
    • Regional Parent Market Outlook
    • Production and Consumption Statistics
    • Import and Export Statistics
  4. Global Market Analysis 2020 to 2024 and Forecast, 2025 to 2035
    • Historical Market Size Value (USD Million) & Volume (Units) Analysis, 2020 to 2024
    • Current and Future Market Size Value (USD Million) & Volume (Units) Projections, 2025 to 2035
      • Y-o-Y Growth Trend Analysis
      • Absolute $ Opportunity Analysis
  5. Global Market Analysis 2020 to 2024 and Forecast 2025 to 2035, By Base Type
    • Introduction / Key Findings
    • Historical Market Size Value (USD Million) & Volume (Units) Analysis By Base Type, 2020 to 2024
    • Current and Future Market Size Value (USD Million) & Volume (Units) Analysis and Forecast By Base Type, 2025 to 2035
      • Silicone-based
      • Hydrocarbon-based
      • Mineral-based
      • Vegetable-oil-based
    • Y-o-Y Growth Trend Analysis By Base Type, 2020 to 2024
    • Absolute $ Opportunity Analysis By Base Type, 2025 to 2035
  6. Global Market Analysis 2020 to 2024 and Forecast 2025 to 2035, By Process Compatibility
    • Introduction / Key Findings
    • Historical Market Size Value (USD Million) & Volume (Units) Analysis By Process Compatibility, 2020 to 2024
    • Current and Future Market Size Value (USD Million) & Volume (Units) Analysis and Forecast By Process Compatibility, 2025 to 2035
      • Cold-process
      • Hot-process
      • High-shear stable
      • Broad pH
    • Y-o-Y Growth Trend Analysis By Process Compatibility, 2020 to 2024
    • Absolute $ Opportunity Analysis By Process Compatibility, 2025 to 2035
  7. Global Market Analysis 2020 to 2024 and Forecast 2025 to 2035, By End Use
    • Introduction / Key Findings
    • Historical Market Size Value (USD Million) & Volume (Units) Analysis By End Use, 2020 to 2024
    • Current and Future Market Size Value (USD Million) & Volume (Units) Analysis and Forecast By End Use, 2025 to 2035
      • Skincare processing
      • Haircare processing
      • Bath & shower processing
      • Oral care processing
    • Y-o-Y Growth Trend Analysis By End Use, 2020 to 2024
    • Absolute $ Opportunity Analysis By End Use, 2025 to 2035
  8. Global Market Analysis 2020 to 2024 and Forecast 2025 to 2035, By Physical Form
    • Introduction / Key Findings
    • Historical Market Size Value (USD Million) & Volume (Units) Analysis By Physical Form, 2020 to 2024
    • Current and Future Market Size Value (USD Million) & Volume (Units) Analysis and Forecast By Physical Form, 2025 to 2035
      • 100% active
      • Powdered
      • Emulsion
      • Dispersion
    • Y-o-Y Growth Trend Analysis By Physical Form, 2020 to 2024
    • Absolute $ Opportunity Analysis By Physical Form, 2025 to 2035
  9. Global Market Analysis 2020 to 2024 and Forecast 2025 to 2035, By Application Role
    • Introduction / Key Findings
    • Historical Market Size Value (USD Million) & Volume (Units) Analysis By Application Role, 2020 to 2024
    • Current and Future Market Size Value (USD Million) & Volume (Units) Analysis and Forecast By Application Role, 2025 to 2035
      • Manufacturing process aid
      • Rinse-off finished formulas
      • Leave-on finished formulas
    • Y-o-Y Growth Trend Analysis By Application Role, 2020 to 2024
    • Absolute $ Opportunity Analysis By Application Role, 2025 to 2035
  10. Global Market Analysis 2020 to 2024 and Forecast 2025 to 2035, By Region
    • Introduction
    • Historical Market Size Value (USD Million) & Volume (Units) Analysis By Region, 2020 to 2024
    • Current Market Size Value (USD Million) & Volume (Units) Analysis and Forecast By Region, 2025 to 2035
      • North America
      • Latin America
      • Europe
      • East Asia
      • South Asia & Pacific
      • Middle East and Africa
    • Market Attractiveness Analysis By Region
  11. North America Market Analysis 2020 to 2024 and Forecast 2025 to 2035, By Country
    • Historical Market Size Value (USD Million) & Volume (Units) Trend Analysis By Market Taxonomy, 2020 to 2024
    • Market Size Value (USD Million) & Volume (Units) Forecast By Market Taxonomy, 2025 to 2035
      • By Country
        • USA
        • Canada
      • By Base Type
      • By Process Compatibility
      • By End Use
      • By Physical Form
      • By Application Role
    • Market Attractiveness Analysis
      • By Country
      • By Base Type
      • By Process Compatibility
      • By End Use
      • By Physical Form
      • By Application Role
    • Key Takeaways
  12. Latin America Market Analysis 2020 to 2024 and Forecast 2025 to 2035, By Country
    • Historical Market Size Value (USD Million) & Volume (Units) Trend Analysis By Market Taxonomy, 2020 to 2024
    • Market Size Value (USD Million) & Volume (Units) Forecast By Market Taxonomy, 2025 to 2035
      • By Country
        • Brazil
        • Mexico
        • Colombia
        • Rest of Latin America
      • By Base Type
      • By Process Compatibility
      • By End Use
      • By Physical Form
      • By Application Role
    • Market Attractiveness Analysis
      • By Country
      • By Base Type
      • By Process Compatibility
      • By End Use
      • By Physical Form
      • By Application Role
    • Key Takeaways
  13. Europe Market Analysis 2020 to 2024 and Forecast 2025 to 2035, By Country
    • Historical Market Size Value (USD Million) & Volume (Units) Trend Analysis By Market Taxonomy, 2020 to 2024
    • Market Size Value (USD Million) & Volume (Units) Forecast By Market Taxonomy, 2025 to 2035
      • By Country
        • Germany
        • UK
        • France
        • Italy
        • Spain
        • Belgium
        • Netherlands
        • Nordic
        • Switzerland
        • Russia
        • Poland
        • Rest of Europe
      • By Base Type
      • By Process Compatibility
      • By End Use
      • By Physical Form
      • By Application Role
    • Market Attractiveness Analysis
      • By Country
      • By Base Type
      • By Process Compatibility
      • By End Use
      • By Physical Form
      • By Application Role
    • Key Takeaways
  14. East Asia Market Analysis 2020 to 2024 and Forecast 2025 to 2035, By Country
    • Historical Market Size Value (USD Million) & Volume (Units) Trend Analysis By Market Taxonomy, 2020 to 2024
    • Market Size Value (USD Million) & Volume (Units) Forecast By Market Taxonomy, 2025 to 2035
      • By Country
        • China
        • Japan
        • South Korea
      • By Base Type
      • By Process Compatibility
      • By End Use
      • By Physical Form
      • By Application Role
    • Market Attractiveness Analysis
      • By Country
      • By Base Type
      • By Process Compatibility
      • By End Use
      • By Physical Form
      • By Application Role
    • Key Takeaways
  15. South Asia & Pacific Market Analysis 2020 to 2024 and Forecast 2025 to 2035, By Country
    • Historical Market Size Value (USD Million) & Volume (Units) Trend Analysis By Market Taxonomy, 2020 to 2024
    • Market Size Value (USD Million) & Volume (Units) Forecast By Market Taxonomy, 2025 to 2035
      • By Country
        • India
        • Thailand
        • Malaysia
        • Indonesia
        • Singapore
        • Vietnam
        • Australia
        • New Zealand
        • Rest of South Asia
      • By Base Type
      • By Process Compatibility
      • By End Use
      • By Physical Form
      • By Application Role
    • Market Attractiveness Analysis
      • By Country
      • By Base Type
      • By Process Compatibility
      • By End Use
      • By Physical Form
      • By Application Role
    • Key Takeaways
  16. Middle East and Africa Market Analysis 2020 to 2024 and Forecast 2025 to 2035, By Country
    • Historical Market Size Value (USD Million) & Volume (Units) Trend Analysis By Market Taxonomy, 2020 to 2024
    • Market Size Value (USD Million) & Volume (Units) Forecast By Market Taxonomy, 2025 to 2035
      • By Country
        • Turkey
        • UAE
        • Saudi Arabia
        • Israel
        • Other GCC Countries
        • North Africa
        • South Africa
      • By Base Type
      • By Process Compatibility
      • By End Use
      • By Physical Form
      • By Application Role
    • Market Attractiveness Analysis
      • By Country
      • By Base Type
      • By Process Compatibility
      • By End Use
      • By Physical Form
      • By Application Role
    • Key Takeaways
  17. Key Countries Market Analysis
    • USA
      • Pricing Analysis
      • Market Share Analysis, 2024
        • By Base Type
        • By Process Compatibility
        • By End Use
        • By Physical Form
        • By Application Role
    • Canada
      • Pricing Analysis
      • Market Share Analysis, 2024
        • By Base Type
        • By Process Compatibility
        • By End Use
        • By Physical Form
        • By Application Role
    • Brazil
      • Pricing Analysis
      • Market Share Analysis, 2024
        • By Base Type
        • By Process Compatibility
        • By End Use
        • By Physical Form
        • By Application Role
    • Mexico
      • Pricing Analysis
      • Market Share Analysis, 2024
        • By Base Type
        • By Process Compatibility
        • By End Use
        • By Physical Form
        • By Application Role
    • Colombia
      • Pricing Analysis
      • Market Share Analysis, 2024
        • By Base Type
        • By Process Compatibility
        • By End Use
        • By Physical Form
        • By Application Role
    • Germany
      • Pricing Analysis
      • Market Share Analysis, 2024
        • By Base Type
        • By Process Compatibility
        • By End Use
        • By Physical Form
        • By Application Role
    • UK
      • Pricing Analysis
      • Market Share Analysis, 2024
        • By Base Type
        • By Process Compatibility
        • By End Use
        • By Physical Form
        • By Application Role
    • France
      • Pricing Analysis
      • Market Share Analysis, 2024
        • By Base Type
        • By Process Compatibility
        • By End Use
        • By Physical Form
        • By Application Role
    • Italy
      • Pricing Analysis
      • Market Share Analysis, 2024
        • By Base Type
        • By Process Compatibility
        • By End Use
        • By Physical Form
        • By Application Role
    • Spain
      • Pricing Analysis
      • Market Share Analysis, 2024
        • By Base Type
        • By Process Compatibility
        • By End Use
        • By Physical Form
        • By Application Role
    • Belgium
      • Pricing Analysis
      • Market Share Analysis, 2024
        • By Base Type
        • By Process Compatibility
        • By End Use
        • By Physical Form
        • By Application Role
    • Netherlands
      • Pricing Analysis
      • Market Share Analysis, 2024
        • By Base Type
        • By Process Compatibility
        • By End Use
        • By Physical Form
        • By Application Role
    • Nordic
      • Pricing Analysis
      • Market Share Analysis, 2024
        • By Base Type
        • By Process Compatibility
        • By End Use
        • By Physical Form
        • By Application Role
    • Switzerland
      • Pricing Analysis
      • Market Share Analysis, 2024
        • By Base Type
        • By Process Compatibility
        • By End Use
        • By Physical Form
        • By Application Role
    • Russia
      • Pricing Analysis
      • Market Share Analysis, 2024
        • By Base Type
        • By Process Compatibility
        • By End Use
        • By Physical Form
        • By Application Role
    • Poland
      • Pricing Analysis
      • Market Share Analysis, 2024
        • By Base Type
        • By Process Compatibility
        • By End Use
        • By Physical Form
        • By Application Role
    • China
      • Pricing Analysis
      • Market Share Analysis, 2024
        • By Base Type
        • By Process Compatibility
        • By End Use
        • By Physical Form
        • By Application Role
    • Japan
      • Pricing Analysis
      • Market Share Analysis, 2024
        • By Base Type
        • By Process Compatibility
        • By End Use
        • By Physical Form
        • By Application Role
    • South Korea
      • Pricing Analysis
      • Market Share Analysis, 2024
        • By Base Type
        • By Process Compatibility
        • By End Use
        • By Physical Form
        • By Application Role
    • India
      • Pricing Analysis
      • Market Share Analysis, 2024
        • By Base Type
        • By Process Compatibility
        • By End Use
        • By Physical Form
        • By Application Role
    • Thailand
      • Pricing Analysis
      • Market Share Analysis, 2024
        • By Base Type
        • By Process Compatibility
        • By End Use
        • By Physical Form
        • By Application Role
    • Indonesia
      • Pricing Analysis
      • Market Share Analysis, 2024
        • By Base Type
        • By Process Compatibility
        • By End Use
        • By Physical Form
        • By Application Role
    • Australia
      • Pricing Analysis
      • Market Share Analysis, 2024
        • By Base Type
        • By Process Compatibility
        • By End Use
        • By Physical Form
        • By Application Role
    • New Zealand
      • Pricing Analysis
      • Market Share Analysis, 2024
        • By Base Type
        • By Process Compatibility
        • By End Use
        • By Physical Form
        • By Application Role
    • Turkey
      • Pricing Analysis
      • Market Share Analysis, 2024
        • By Base Type
        • By Process Compatibility
        • By End Use
        • By Physical Form
        • By Application Role
    • UAE
      • Pricing Analysis
      • Market Share Analysis, 2024
        • By Base Type
        • By Process Compatibility
        • By End Use
        • By Physical Form
        • By Application Role
    • Saudi Arabia
      • Pricing Analysis
      • Market Share Analysis, 2024
        • By Base Type
        • By Process Compatibility
        • By End Use
        • By Physical Form
        • By Application Role
    • Israel
      • Pricing Analysis
      • Market Share Analysis, 2024
        • By Base Type
        • By Process Compatibility
        • By End Use
        • By Physical Form
        • By Application Role
    • North Africa
      • Pricing Analysis
      • Market Share Analysis, 2024
        • By Base Type
        • By Process Compatibility
        • By End Use
        • By Physical Form
        • By Application Role
    • South Africa
      • Pricing Analysis
      • Market Share Analysis, 2024
        • By Base Type
        • By Process Compatibility
        • By End Use
        • By Physical Form
        • By Application Role
  18. Market Structure Analysis
    • Competition Dashboard
    • Competition Benchmarking
    • Market Share Analysis of Top Players
      • By Regional
      • By Base Type
      • By Process Compatibility
      • By End Use
      • By Physical Form
      • By Application Role
  19. Competition Analysis
    • Competition Deep Dive
      • Dow
        • Overview
        • Product Portfolio
        • Profitability by Market Segments (Product/Age /Sales Channel/Region)
        • Sales Footprint
        • Strategy Overview
          • Marketing Strategy
          • Product Strategy
          • Channel Strategy
      • Wacker
        • Overview
        • Product Portfolio
        • Profitability by Market Segments (Product/Age /Sales Channel/Region)
        • Sales Footprint
        • Strategy Overview
          • Marketing Strategy
          • Product Strategy
          • Channel Strategy
      • Momentive
        • Overview
        • Product Portfolio
        • Profitability by Market Segments (Product/Age /Sales Channel/Region)
        • Sales Footprint
        • Strategy Overview
          • Marketing Strategy
          • Product Strategy
          • Channel Strategy
      • Evonik
        • Overview
        • Product Portfolio
        • Profitability by Market Segments (Product/Age /Sales Channel/Region)
        • Sales Footprint
        • Strategy Overview
          • Marketing Strategy
          • Product Strategy
          • Channel Strategy
      • BASF
        • Overview
        • Product Portfolio
        • Profitability by Market Segments (Product/Age /Sales Channel/Region)
        • Sales Footprint
        • Strategy Overview
          • Marketing Strategy
          • Product Strategy
          • Channel Strategy
      • Elkem
        • Overview
        • Product Portfolio
        • Profitability by Market Segments (Product/Age /Sales Channel/Region)
        • Sales Footprint
        • Strategy Overview
          • Marketing Strategy
          • Product Strategy
          • Channel Strategy
      • Shin-Etsu
        • Overview
        • Product Portfolio
        • Profitability by Market Segments (Product/Age /Sales Channel/Region)
        • Sales Footprint
        • Strategy Overview
          • Marketing Strategy
          • Product Strategy
          • Channel Strategy
      • Ashland
        • Overview
        • Product Portfolio
        • Profitability by Market Segments (Product/Age /Sales Channel/Region)
        • Sales Footprint
        • Strategy Overview
          • Marketing Strategy
          • Product Strategy
          • Channel Strategy
      • BYK
        • Overview
        • Product Portfolio
        • Profitability by Market Segments (Product/Age /Sales Channel/Region)
        • Sales Footprint
        • Strategy Overview
          • Marketing Strategy
          • Product Strategy
          • Channel Strategy
      • Elementis
        • Overview
        • Product Portfolio
        • Profitability by Market Segments (Product/Age /Sales Channel/Region)
        • Sales Footprint
        • Strategy Overview
          • Marketing Strategy
          • Product Strategy
          • Channel Strategy
  20. Assumptions & Acronyms Used
  21. Research Methodology

List of Tables

  • Table 1: Global Market Value (USD Million) Forecast by Region, 2020-2035
  • Table 2: Global Market Volume (Units) Forecast by Region, 2020-2035
  • Table 3: Global Market Value (USD Million) Forecast by Base Type, 2020-2035
  • Table 4: Global Market Volume (Units) Forecast by Base Type, 2020-2035
  • Table 5: Global Market Value (USD Million) Forecast by Process Compatibility, 2020-2035
  • Table 6: Global Market Volume (Units) Forecast by Process Compatibility, 2020-2035
  • Table 7: Global Market Value (USD Million) Forecast by End Use, 2020-2035
  • Table 8: Global Market Volume (Units) Forecast by End Use, 2020-2035
  • Table 9: Global Market Value (USD Million) Forecast by Physical Form, 2020-2035
  • Table 10: Global Market Volume (Units) Forecast by Physical Form, 2020-2035
  • Table 11: Global Market Value (USD Million) Forecast by Application Role, 2020-2035
  • Table 12: Global Market Volume (Units) Forecast by Application Role, 2020-2035
  • Table 13: North America Market Value (USD Million) Forecast by Country, 2020-2035
  • Table 14: North America Market Volume (Units) Forecast by Country, 2020-2035
  • Table 15: North America Market Value (USD Million) Forecast by Base Type, 2020-2035
  • Table 16: North America Market Volume (Units) Forecast by Base Type, 2020-2035
  • Table 17: North America Market Value (USD Million) Forecast by Process Compatibility, 2020-2035
  • Table 18: North America Market Volume (Units) Forecast by Process Compatibility, 2020-2035
  • Table 19: North America Market Value (USD Million) Forecast by End Use, 2020-2035
  • Table 20: North America Market Volume (Units) Forecast by End Use, 2020-2035
  • Table 21: North America Market Value (USD Million) Forecast by Physical Form, 2020-2035
  • Table 22: North America Market Volume (Units) Forecast by Physical Form, 2020-2035
  • Table 23: North America Market Value (USD Million) Forecast by Application Role, 2020-2035
  • Table 24: North America Market Volume (Units) Forecast by Application Role, 2020-2035
  • Table 25: Latin America Market Value (USD Million) Forecast by Country, 2020-2035
  • Table 26: Latin America Market Volume (Units) Forecast by Country, 2020-2035
  • Table 27: Latin America Market Value (USD Million) Forecast by Base Type, 2020-2035
  • Table 28: Latin America Market Volume (Units) Forecast by Base Type, 2020-2035
  • Table 29: Latin America Market Value (USD Million) Forecast by Process Compatibility, 2020-2035
  • Table 30: Latin America Market Volume (Units) Forecast by Process Compatibility, 2020-2035
  • Table 31: Latin America Market Value (USD Million) Forecast by End Use, 2020-2035
  • Table 32: Latin America Market Volume (Units) Forecast by End Use, 2020-2035
  • Table 33: Latin America Market Value (USD Million) Forecast by Physical Form, 2020-2035
  • Table 34: Latin America Market Volume (Units) Forecast by Physical Form, 2020-2035
  • Table 35: Latin America Market Value (USD Million) Forecast by Application Role, 2020-2035
  • Table 36: Latin America Market Volume (Units) Forecast by Application Role, 2020-2035
  • Table 37: Europe Market Value (USD Million) Forecast by Country, 2020-2035
  • Table 38: Europe Market Volume (Units) Forecast by Country, 2020-2035
  • Table 39: Europe Market Value (USD Million) Forecast by Base Type, 2020-2035
  • Table 40: Europe Market Volume (Units) Forecast by Base Type, 2020-2035
  • Table 41: Europe Market Value (USD Million) Forecast by Process Compatibility, 2020-2035
  • Table 42: Europe Market Volume (Units) Forecast by Process Compatibility, 2020-2035
  • Table 43: Europe Market Value (USD Million) Forecast by End Use, 2020-2035
  • Table 44: Europe Market Volume (Units) Forecast by End Use, 2020-2035
  • Table 45: Europe Market Value (USD Million) Forecast by Physical Form, 2020-2035
  • Table 46: Europe Market Volume (Units) Forecast by Physical Form, 2020-2035
  • Table 47: Europe Market Value (USD Million) Forecast by Application Role, 2020-2035
  • Table 48: Europe Market Volume (Units) Forecast by Application Role, 2020-2035
  • Table 49: East Asia Market Value (USD Million) Forecast by Country, 2020-2035
  • Table 50: East Asia Market Volume (Units) Forecast by Country, 2020-2035
  • Table 51: East Asia Market Value (USD Million) Forecast by Base Type, 2020-2035
  • Table 52: East Asia Market Volume (Units) Forecast by Base Type, 2020-2035
  • Table 53: East Asia Market Value (USD Million) Forecast by Process Compatibility, 2020-2035
  • Table 54: East Asia Market Volume (Units) Forecast by Process Compatibility, 2020-2035
  • Table 55: East Asia Market Value (USD Million) Forecast by End Use, 2020-2035
  • Table 56: East Asia Market Volume (Units) Forecast by End Use, 2020-2035
  • Table 57: East Asia Market Value (USD Million) Forecast by Physical Form, 2020-2035
  • Table 58: East Asia Market Volume (Units) Forecast by Physical Form, 2020-2035
  • Table 59: East Asia Market Value (USD Million) Forecast by Application Role, 2020-2035
  • Table 60: East Asia Market Volume (Units) Forecast by Application Role, 2020-2035
  • Table 61: South Asia & Pacific Market Value (USD Million) Forecast by Country, 2020-2035
  • Table 62: South Asia & Pacific Market Volume (Units) Forecast by Country, 2020-2035
  • Table 63: South Asia & Pacific Market Value (USD Million) Forecast by Base Type, 2020-2035
  • Table 64: South Asia & Pacific Market Volume (Units) Forecast by Base Type, 2020-2035
  • Table 65: South Asia & Pacific Market Value (USD Million) Forecast by Process Compatibility, 2020-2035
  • Table 66: South Asia & Pacific Market Volume (Units) Forecast by Process Compatibility, 2020-2035
  • Table 67: South Asia & Pacific Market Value (USD Million) Forecast by End Use, 2020-2035
  • Table 68: South Asia & Pacific Market Volume (Units) Forecast by End Use, 2020-2035
  • Table 69: South Asia & Pacific Market Value (USD Million) Forecast by Physical Form, 2020-2035
  • Table 70: South Asia & Pacific Market Volume (Units) Forecast by Physical Form, 2020-2035
  • Table 71: South Asia & Pacific Market Value (USD Million) Forecast by Application Role, 2020-2035
  • Table 72: South Asia & Pacific Market Volume (Units) Forecast by Application Role, 2020-2035
  • Table 73: Middle East and Africa Market Value (USD Million) Forecast by Country, 2020-2035
  • Table 74: Middle East and Africa Market Volume (Units) Forecast by Country, 2020-2035
  • Table 75: Middle East and Africa Market Value (USD Million) Forecast by Base Type, 2020-2035
  • Table 76: Middle East and Africa Market Volume (Units) Forecast by Base Type, 2020-2035
  • Table 77: Middle East and Africa Market Value (USD Million) Forecast by Process Compatibility, 2020-2035
  • Table 78: Middle East and Africa Market Volume (Units) Forecast by Process Compatibility, 2020-2035
  • Table 79: Middle East and Africa Market Value (USD Million) Forecast by End Use, 2020-2035
  • Table 80: Middle East and Africa Market Volume (Units) Forecast by End Use, 2020-2035
  • Table 81: Middle East and Africa Market Value (USD Million) Forecast by Physical Form, 2020-2035
  • Table 82: Middle East and Africa Market Volume (Units) Forecast by Physical Form, 2020-2035
  • Table 83: Middle East and Africa Market Value (USD Million) Forecast by Application Role, 2020-2035
  • Table 84: Middle East and Africa Market Volume (Units) Forecast by Application Role, 2020-2035

List of Figures

  • Figure 1: Global Market Value (USD Million) by Base Type, 2025-2035
  • Figure 2: Global Market Value (USD Million) by Process Compatibility, 2025-2035
  • Figure 3: Global Market Value (USD Million) by End Use, 2025-2035
  • Figure 4: Global Market Value (USD Million) by Physical Form, 2025-2035
  • Figure 5: Global Market Value (USD Million) by Application Role, 2025-2035
  • Figure 6: Global Market Value (USD Million) by Region, 2025-2035
  • Figure 7: Global Market Value (USD Million) Analysis by Region, 2020-2035
  • Figure 8: Global Market Volume (Units) Analysis by Region, 2020-2035
  • Figure 9: Global Market Value Share (%) and BPS Analysis by Region, 2025-2035
  • Figure 10: Global Market Y-o-Y Growth (%) Projections by Region, 2025-2035
  • Figure 11: Global Market Value (USD Million) Analysis by Base Type, 2020-2035
  • Figure 12: Global Market Volume (Units) Analysis by Base Type, 2020-2035
  • Figure 13: Global Market Value Share (%) and BPS Analysis by Base Type, 2025-2035
  • Figure 14: Global Market Y-o-Y Growth (%) Projections by Base Type, 2025-2035
  • Figure 15: Global Market Value (USD Million) Analysis by Process Compatibility, 2020-2035
  • Figure 16: Global Market Volume (Units) Analysis by Process Compatibility, 2020-2035
  • Figure 17: Global Market Value Share (%) and BPS Analysis by Process Compatibility, 2025-2035
  • Figure 18: Global Market Y-o-Y Growth (%) Projections by Process Compatibility, 2025-2035
  • Figure 19: Global Market Value (USD Million) Analysis by End Use, 2020-2035
  • Figure 20: Global Market Volume (Units) Analysis by End Use, 2020-2035
  • Figure 21: Global Market Value Share (%) and BPS Analysis by End Use, 2025-2035
  • Figure 22: Global Market Y-o-Y Growth (%) Projections by End Use, 2025-2035
  • Figure 23: Global Market Value (USD Million) Analysis by Physical Form, 2020-2035
  • Figure 24: Global Market Volume (Units) Analysis by Physical Form, 2020-2035
  • Figure 25: Global Market Value Share (%) and BPS Analysis by Physical Form, 2025-2035
  • Figure 26: Global Market Y-o-Y Growth (%) Projections by Physical Form, 2025-2035
  • Figure 27: Global Market Value (USD Million) Analysis by Application Role, 2020-2035
  • Figure 28: Global Market Volume (Units) Analysis by Application Role, 2020-2035
  • Figure 29: Global Market Value Share (%) and BPS Analysis by Application Role, 2025-2035
  • Figure 30: Global Market Y-o-Y Growth (%) Projections by Application Role, 2025-2035
  • Figure 31: Global Market Attractiveness by Base Type, 2025-2035
  • Figure 32: Global Market Attractiveness by Process Compatibility, 2025-2035
  • Figure 33: Global Market Attractiveness by End Use, 2025-2035
  • Figure 34: Global Market Attractiveness by Physical Form, 2025-2035
  • Figure 35: Global Market Attractiveness by Application Role, 2025-2035
  • Figure 36: Global Market Attractiveness by Region, 2025-2035
  • Figure 37: North America Market Value (USD Million) by Base Type, 2025-2035
  • Figure 38: North America Market Value (USD Million) by Process Compatibility, 2025-2035
  • Figure 39: North America Market Value (USD Million) by End Use, 2025-2035
  • Figure 40: North America Market Value (USD Million) by Physical Form, 2025-2035
  • Figure 41: North America Market Value (USD Million) by Application Role, 2025-2035
  • Figure 42: North America Market Value (USD Million) by Country, 2025-2035
  • Figure 43: North America Market Value (USD Million) Analysis by Country, 2020-2035
  • Figure 44: North America Market Volume (Units) Analysis by Country, 2020-2035
  • Figure 45: North America Market Value Share (%) and BPS Analysis by Country, 2025-2035
  • Figure 46: North America Market Y-o-Y Growth (%) Projections by Country, 2025-2035
  • Figure 47: North America Market Value (USD Million) Analysis by Base Type, 2020-2035
  • Figure 48: North America Market Volume (Units) Analysis by Base Type, 2020-2035
  • Figure 49: North America Market Value Share (%) and BPS Analysis by Base Type, 2025-2035
  • Figure 50: North America Market Y-o-Y Growth (%) Projections by Base Type, 2025-2035
  • Figure 51: North America Market Value (USD Million) Analysis by Process Compatibility, 2020-2035
  • Figure 52: North America Market Volume (Units) Analysis by Process Compatibility, 2020-2035
  • Figure 53: North America Market Value Share (%) and BPS Analysis by Process Compatibility, 2025-2035
  • Figure 54: North America Market Y-o-Y Growth (%) Projections by Process Compatibility, 2025-2035
  • Figure 55: North America Market Value (USD Million) Analysis by End Use, 2020-2035
  • Figure 56: North America Market Volume (Units) Analysis by End Use, 2020-2035
  • Figure 57: North America Market Value Share (%) and BPS Analysis by End Use, 2025-2035
  • Figure 58: North America Market Y-o-Y Growth (%) Projections by End Use, 2025-2035
  • Figure 59: North America Market Value (USD Million) Analysis by Physical Form, 2020-2035
  • Figure 60: North America Market Volume (Units) Analysis by Physical Form, 2020-2035
  • Figure 61: North America Market Value Share (%) and BPS Analysis by Physical Form, 2025-2035
  • Figure 62: North America Market Y-o-Y Growth (%) Projections by Physical Form, 2025-2035
  • Figure 63: North America Market Value (USD Million) Analysis by Application Role, 2020-2035
  • Figure 64: North America Market Volume (Units) Analysis by Application Role, 2020-2035
  • Figure 65: North America Market Value Share (%) and BPS Analysis by Application Role, 2025-2035
  • Figure 66: North America Market Y-o-Y Growth (%) Projections by Application Role, 2025-2035
  • Figure 67: North America Market Attractiveness by Base Type, 2025-2035
  • Figure 68: North America Market Attractiveness by Process Compatibility, 2025-2035
  • Figure 69: North America Market Attractiveness by End Use, 2025-2035
  • Figure 70: North America Market Attractiveness by Physical Form, 2025-2035
  • Figure 71: North America Market Attractiveness by Application Role, 2025-2035
  • Figure 72: North America Market Attractiveness by Country, 2025-2035
  • Figure 73: Latin America Market Value (USD Million) by Base Type, 2025-2035
  • Figure 74: Latin America Market Value (USD Million) by Process Compatibility, 2025-2035
  • Figure 75: Latin America Market Value (USD Million) by End Use, 2025-2035
  • Figure 76: Latin America Market Value (USD Million) by Physical Form, 2025-2035
  • Figure 77: Latin America Market Value (USD Million) by Application Role, 2025-2035
  • Figure 78: Latin America Market Value (USD Million) by Country, 2025-2035
  • Figure 79: Latin America Market Value (USD Million) Analysis by Country, 2020-2035
  • Figure 80: Latin America Market Volume (Units) Analysis by Country, 2020-2035
  • Figure 81: Latin America Market Value Share (%) and BPS Analysis by Country, 2025-2035
  • Figure 82: Latin America Market Y-o-Y Growth (%) Projections by Country, 2025-2035
  • Figure 83: Latin America Market Value (USD Million) Analysis by Base Type, 2020-2035
  • Figure 84: Latin America Market Volume (Units) Analysis by Base Type, 2020-2035
  • Figure 85: Latin America Market Value Share (%) and BPS Analysis by Base Type, 2025-2035
  • Figure 86: Latin America Market Y-o-Y Growth (%) Projections by Base Type, 2025-2035
  • Figure 87: Latin America Market Value (USD Million) Analysis by Process Compatibility, 2020-2035
  • Figure 88: Latin America Market Volume (Units) Analysis by Process Compatibility, 2020-2035
  • Figure 89: Latin America Market Value Share (%) and BPS Analysis by Process Compatibility, 2025-2035
  • Figure 90: Latin America Market Y-o-Y Growth (%) Projections by Process Compatibility, 2025-2035
  • Figure 91: Latin America Market Value (USD Million) Analysis by End Use, 2020-2035
  • Figure 92: Latin America Market Volume (Units) Analysis by End Use, 2020-2035
  • Figure 93: Latin America Market Value Share (%) and BPS Analysis by End Use, 2025-2035
  • Figure 94: Latin America Market Y-o-Y Growth (%) Projections by End Use, 2025-2035
  • Figure 95: Latin America Market Value (USD Million) Analysis by Physical Form, 2020-2035
  • Figure 96: Latin America Market Volume (Units) Analysis by Physical Form, 2020-2035
  • Figure 97: Latin America Market Value Share (%) and BPS Analysis by Physical Form, 2025-2035
  • Figure 98: Latin America Market Y-o-Y Growth (%) Projections by Physical Form, 2025-2035
  • Figure 99: Latin America Market Value (USD Million) Analysis by Application Role, 2020-2035
  • Figure 100: Latin America Market Volume (Units) Analysis by Application Role, 2020-2035
  • Figure 101: Latin America Market Value Share (%) and BPS Analysis by Application Role, 2025-2035
  • Figure 102: Latin America Market Y-o-Y Growth (%) Projections by Application Role, 2025-2035
  • Figure 103: Latin America Market Attractiveness by Base Type, 2025-2035
  • Figure 104: Latin America Market Attractiveness by Process Compatibility, 2025-2035
  • Figure 105: Latin America Market Attractiveness by End Use, 2025-2035
  • Figure 106: Latin America Market Attractiveness by Physical Form, 2025-2035
  • Figure 107: Latin America Market Attractiveness by Application Role, 2025-2035
  • Figure 108: Latin America Market Attractiveness by Country, 2025-2035
  • Figure 109: Europe Market Value (USD Million) by Base Type, 2025-2035
  • Figure 110: Europe Market Value (USD Million) by Process Compatibility, 2025-2035
  • Figure 111: Europe Market Value (USD Million) by End Use, 2025-2035
  • Figure 112: Europe Market Value (USD Million) by Physical Form, 2025-2035
  • Figure 113: Europe Market Value (USD Million) by Application Role, 2025-2035
  • Figure 114: Europe Market Value (USD Million) by Country, 2025-2035
  • Figure 115: Europe Market Value (USD Million) Analysis by Country, 2020-2035
  • Figure 116: Europe Market Volume (Units) Analysis by Country, 2020-2035
  • Figure 117: Europe Market Value Share (%) and BPS Analysis by Country, 2025-2035
  • Figure 118: Europe Market Y-o-Y Growth (%) Projections by Country, 2025-2035
  • Figure 119: Europe Market Value (USD Million) Analysis by Base Type, 2020-2035
  • Figure 120: Europe Market Volume (Units) Analysis by Base Type, 2020-2035
  • Figure 121: Europe Market Value Share (%) and BPS Analysis by Base Type, 2025-2035
  • Figure 122: Europe Market Y-o-Y Growth (%) Projections by Base Type, 2025-2035
  • Figure 123: Europe Market Value (USD Million) Analysis by Process Compatibility, 2020-2035
  • Figure 124: Europe Market Volume (Units) Analysis by Process Compatibility, 2020-2035
  • Figure 125: Europe Market Value Share (%) and BPS Analysis by Process Compatibility, 2025-2035
  • Figure 126: Europe Market Y-o-Y Growth (%) Projections by Process Compatibility, 2025-2035
  • Figure 127: Europe Market Value (USD Million) Analysis by End Use, 2020-2035
  • Figure 128: Europe Market Volume (Units) Analysis by End Use, 2020-2035
  • Figure 129: Europe Market Value Share (%) and BPS Analysis by End Use, 2025-2035
  • Figure 130: Europe Market Y-o-Y Growth (%) Projections by End Use, 2025-2035
  • Figure 131: Europe Market Value (USD Million) Analysis by Physical Form, 2020-2035
  • Figure 132: Europe Market Volume (Units) Analysis by Physical Form, 2020-2035
  • Figure 133: Europe Market Value Share (%) and BPS Analysis by Physical Form, 2025-2035
  • Figure 134: Europe Market Y-o-Y Growth (%) Projections by Physical Form, 2025-2035
  • Figure 135: Europe Market Value (USD Million) Analysis by Application Role, 2020-2035
  • Figure 136: Europe Market Volume (Units) Analysis by Application Role, 2020-2035
  • Figure 137: Europe Market Value Share (%) and BPS Analysis by Application Role, 2025-2035
  • Figure 138: Europe Market Y-o-Y Growth (%) Projections by Application Role, 2025-2035
  • Figure 139: Europe Market Attractiveness by Base Type, 2025-2035
  • Figure 140: Europe Market Attractiveness by Process Compatibility, 2025-2035
  • Figure 141: Europe Market Attractiveness by End Use, 2025-2035
  • Figure 142: Europe Market Attractiveness by Physical Form, 2025-2035
  • Figure 143: Europe Market Attractiveness by Application Role, 2025-2035
  • Figure 144: Europe Market Attractiveness by Country, 2025-2035
  • Figure 145: East Asia Market Value (USD Million) by Base Type, 2025-2035
  • Figure 146: East Asia Market Value (USD Million) by Process Compatibility, 2025-2035
  • Figure 147: East Asia Market Value (USD Million) by End Use, 2025-2035
  • Figure 148: East Asia Market Value (USD Million) by Physical Form, 2025-2035
  • Figure 149: East Asia Market Value (USD Million) by Application Role, 2025-2035
  • Figure 150: East Asia Market Value (USD Million) by Country, 2025-2035
  • Figure 151: East Asia Market Value (USD Million) Analysis by Country, 2020-2035
  • Figure 152: East Asia Market Volume (Units) Analysis by Country, 2020-2035
  • Figure 153: East Asia Market Value Share (%) and BPS Analysis by Country, 2025-2035
  • Figure 154: East Asia Market Y-o-Y Growth (%) Projections by Country, 2025-2035
  • Figure 155: East Asia Market Value (USD Million) Analysis by Base Type, 2020-2035
  • Figure 156: East Asia Market Volume (Units) Analysis by Base Type, 2020-2035
  • Figure 157: East Asia Market Value Share (%) and BPS Analysis by Base Type, 2025-2035
  • Figure 158: East Asia Market Y-o-Y Growth (%) Projections by Base Type, 2025-2035
  • Figure 159: East Asia Market Value (USD Million) Analysis by Process Compatibility, 2020-2035
  • Figure 160: East Asia Market Volume (Units) Analysis by Process Compatibility, 2020-2035
  • Figure 161: East Asia Market Value Share (%) and BPS Analysis by Process Compatibility, 2025-2035
  • Figure 162: East Asia Market Y-o-Y Growth (%) Projections by Process Compatibility, 2025-2035
  • Figure 163: East Asia Market Value (USD Million) Analysis by End Use, 2020-2035
  • Figure 164: East Asia Market Volume (Units) Analysis by End Use, 2020-2035
  • Figure 165: East Asia Market Value Share (%) and BPS Analysis by End Use, 2025-2035
  • Figure 166: East Asia Market Y-o-Y Growth (%) Projections by End Use, 2025-2035
  • Figure 167: East Asia Market Value (USD Million) Analysis by Physical Form, 2020-2035
  • Figure 168: East Asia Market Volume (Units) Analysis by Physical Form, 2020-2035
  • Figure 169: East Asia Market Value Share (%) and BPS Analysis by Physical Form, 2025-2035
  • Figure 170: East Asia Market Y-o-Y Growth (%) Projections by Physical Form, 2025-2035
  • Figure 171: East Asia Market Value (USD Million) Analysis by Application Role, 2020-2035
  • Figure 172: East Asia Market Volume (Units) Analysis by Application Role, 2020-2035
  • Figure 173: East Asia Market Value Share (%) and BPS Analysis by Application Role, 2025-2035
  • Figure 174: East Asia Market Y-o-Y Growth (%) Projections by Application Role, 2025-2035
  • Figure 175: East Asia Market Attractiveness by Base Type, 2025-2035
  • Figure 176: East Asia Market Attractiveness by Process Compatibility, 2025-2035
  • Figure 177: East Asia Market Attractiveness by End Use, 2025-2035
  • Figure 178: East Asia Market Attractiveness by Physical Form, 2025-2035
  • Figure 179: East Asia Market Attractiveness by Application Role, 2025-2035
  • Figure 180: East Asia Market Attractiveness by Country, 2025-2035
  • Figure 181: South Asia & Pacific Market Value (USD Million) by Base Type, 2025-2035
  • Figure 182: South Asia & Pacific Market Value (USD Million) by Process Compatibility, 2025-2035
  • Figure 183: South Asia & Pacific Market Value (USD Million) by End Use, 2025-2035
  • Figure 184: South Asia & Pacific Market Value (USD Million) by Physical Form, 2025-2035
  • Figure 185: South Asia & Pacific Market Value (USD Million) by Application Role, 2025-2035
  • Figure 186: South Asia & Pacific Market Value (USD Million) by Country, 2025-2035
  • Figure 187: South Asia & Pacific Market Value (USD Million) Analysis by Country, 2020-2035
  • Figure 188: South Asia & Pacific Market Volume (Units) Analysis by Country, 2020-2035
  • Figure 189: South Asia & Pacific Market Value Share (%) and BPS Analysis by Country, 2025-2035
  • Figure 190: South Asia & Pacific Market Y-o-Y Growth (%) Projections by Country, 2025-2035
  • Figure 191: South Asia & Pacific Market Value (USD Million) Analysis by Base Type, 2020-2035
  • Figure 192: South Asia & Pacific Market Volume (Units) Analysis by Base Type, 2020-2035
  • Figure 193: South Asia & Pacific Market Value Share (%) and BPS Analysis by Base Type, 2025-2035
  • Figure 194: South Asia & Pacific Market Y-o-Y Growth (%) Projections by Base Type, 2025-2035
  • Figure 195: South Asia & Pacific Market Value (USD Million) Analysis by Process Compatibility, 2020-2035
  • Figure 196: South Asia & Pacific Market Volume (Units) Analysis by Process Compatibility, 2020-2035
  • Figure 197: South Asia & Pacific Market Value Share (%) and BPS Analysis by Process Compatibility, 2025-2035
  • Figure 198: South Asia & Pacific Market Y-o-Y Growth (%) Projections by Process Compatibility, 2025-2035
  • Figure 199: South Asia & Pacific Market Value (USD Million) Analysis by End Use, 2020-2035
  • Figure 200: South Asia & Pacific Market Volume (Units) Analysis by End Use, 2020-2035
  • Figure 201: South Asia & Pacific Market Value Share (%) and BPS Analysis by End Use, 2025-2035
  • Figure 202: South Asia & Pacific Market Y-o-Y Growth (%) Projections by End Use, 2025-2035
  • Figure 203: South Asia & Pacific Market Value (USD Million) Analysis by Physical Form, 2020-2035
  • Figure 204: South Asia & Pacific Market Volume (Units) Analysis by Physical Form, 2020-2035
  • Figure 205: South Asia & Pacific Market Value Share (%) and BPS Analysis by Physical Form, 2025-2035
  • Figure 206: South Asia & Pacific Market Y-o-Y Growth (%) Projections by Physical Form, 2025-2035
  • Figure 207: South Asia & Pacific Market Value (USD Million) Analysis by Application Role, 2020-2035
  • Figure 208: South Asia & Pacific Market Volume (Units) Analysis by Application Role, 2020-2035
  • Figure 209: South Asia & Pacific Market Value Share (%) and BPS Analysis by Application Role, 2025-2035
  • Figure 210: South Asia & Pacific Market Y-o-Y Growth (%) Projections by Application Role, 2025-2035
  • Figure 211: South Asia & Pacific Market Attractiveness by Base Type, 2025-2035
  • Figure 212: South Asia & Pacific Market Attractiveness by Process Compatibility, 2025-2035
  • Figure 213: South Asia & Pacific Market Attractiveness by End Use, 2025-2035
  • Figure 214: South Asia & Pacific Market Attractiveness by Physical Form, 2025-2035
  • Figure 215: South Asia & Pacific Market Attractiveness by Application Role, 2025-2035
  • Figure 216: South Asia & Pacific Market Attractiveness by Country, 2025-2035
  • Figure 217: Middle East and Africa Market Value (USD Million) by Base Type, 2025-2035
  • Figure 218: Middle East and Africa Market Value (USD Million) by Process Compatibility, 2025-2035
  • Figure 219: Middle East and Africa Market Value (USD Million) by End Use, 2025-2035
  • Figure 220: Middle East and Africa Market Value (USD Million) by Physical Form, 2025-2035
  • Figure 221: Middle East and Africa Market Value (USD Million) by Application Role, 2025-2035
  • Figure 222: Middle East and Africa Market Value (USD Million) by Country, 2025-2035
  • Figure 223: Middle East and Africa Market Value (USD Million) Analysis by Country, 2020-2035
  • Figure 224: Middle East and Africa Market Volume (Units) Analysis by Country, 2020-2035
  • Figure 225: Middle East and Africa Market Value Share (%) and BPS Analysis by Country, 2025-2035
  • Figure 226: Middle East and Africa Market Y-o-Y Growth (%) Projections by Country, 2025-2035
  • Figure 227: Middle East and Africa Market Value (USD Million) Analysis by Base Type, 2020-2035
  • Figure 228: Middle East and Africa Market Volume (Units) Analysis by Base Type, 2020-2035
  • Figure 229: Middle East and Africa Market Value Share (%) and BPS Analysis by Base Type, 2025-2035
  • Figure 230: Middle East and Africa Market Y-o-Y Growth (%) Projections by Base Type, 2025-2035
  • Figure 231: Middle East and Africa Market Value (USD Million) Analysis by Process Compatibility, 2020-2035
  • Figure 232: Middle East and Africa Market Volume (Units) Analysis by Process Compatibility, 2020-2035
  • Figure 233: Middle East and Africa Market Value Share (%) and BPS Analysis by Process Compatibility, 2025-2035
  • Figure 234: Middle East and Africa Market Y-o-Y Growth (%) Projections by Process Compatibility, 2025-2035
  • Figure 235: Middle East and Africa Market Value (USD Million) Analysis by End Use, 2020-2035
  • Figure 236: Middle East and Africa Market Volume (Units) Analysis by End Use, 2020-2035
  • Figure 237: Middle East and Africa Market Value Share (%) and BPS Analysis by End Use, 2025-2035
  • Figure 238: Middle East and Africa Market Y-o-Y Growth (%) Projections by End Use, 2025-2035
  • Figure 239: Middle East and Africa Market Value (USD Million) Analysis by Physical Form, 2020-2035
  • Figure 240: Middle East and Africa Market Volume (Units) Analysis by Physical Form, 2020-2035
  • Figure 241: Middle East and Africa Market Value Share (%) and BPS Analysis by Physical Form, 2025-2035
  • Figure 242: Middle East and Africa Market Y-o-Y Growth (%) Projections by Physical Form, 2025-2035
  • Figure 243: Middle East and Africa Market Value (USD Million) Analysis by Application Role, 2020-2035
  • Figure 244: Middle East and Africa Market Volume (Units) Analysis by Application Role, 2020-2035
  • Figure 245: Middle East and Africa Market Value Share (%) and BPS Analysis by Application Role, 2025-2035
  • Figure 246: Middle East and Africa Market Y-o-Y Growth (%) Projections by Application Role, 2025-2035
  • Figure 247: Middle East and Africa Market Attractiveness by Base Type, 2025-2035
  • Figure 248: Middle East and Africa Market Attractiveness by Process Compatibility, 2025-2035
  • Figure 249: Middle East and Africa Market Attractiveness by End Use, 2025-2035
  • Figure 250: Middle East and Africa Market Attractiveness by Physical Form, 2025-2035
  • Figure 251: Middle East and Africa Market Attractiveness by Application Role, 2025-2035
  • Figure 252: Middle East and Africa Market Attractiveness by Country, 2025-2035

Frequently Asked Questions

How big is the Anti-Foaming Agents / Defoamers Market in 2025?

The Anti-Foaming Agents / Defoamers Market is estimated to be valued at USD 1,151.6 million in 2025.

What will be the size of the Anti-Foaming Agents / Defoamers Market in 2035?

The market size for the Anti-Foaming Agents / Defoamers Market is projected to reach USD 2,253.4 million by 2035.

How much will be the Anti-Foaming Agents / Defoamers Market growth between 2025 and 2035?

The Anti-Foaming Agents / Defoamers Market is expected to grow at a 6.9% CAGR between 2025 and 2035.

What are the key product types in the Anti-Foaming Agents / Defoamers Market?

The key product types in the Anti-Foaming Agents / Defoamers Market are silicone-based, hydrocarbon-based, mineral-based, and vegetable-oil-based defoamers.

Which physical form segment will contribute significant share in the Anti-Foaming Agents / Defoamers Market in 2025?

In terms of physical form, the emulsion segment is set to command 46% share in the Anti-Foaming Agents / Defoamers Market in 2025.

Explore Similar Insights

Future Market Insights

Anti-Foaming Agents / Defoamers Market

Chat With

MaRIA

Hi There, I am MaRIA, Your Market Research Intelligence Assistant. How may I help you?