Anti-Stretch Marks Agents Market Size and Share Forecast Outlook 2025 to 2035

A market valuation of USD 1,402.1 million has been projected for anti-stretch marks agents in 2025, which is anticipated to reach USD 3,102.3 million by 2035. This increase of USD 1,700.2 million reflects more than a two-fold expansion across the decade, supported by an overall CAGR of 8.3%.
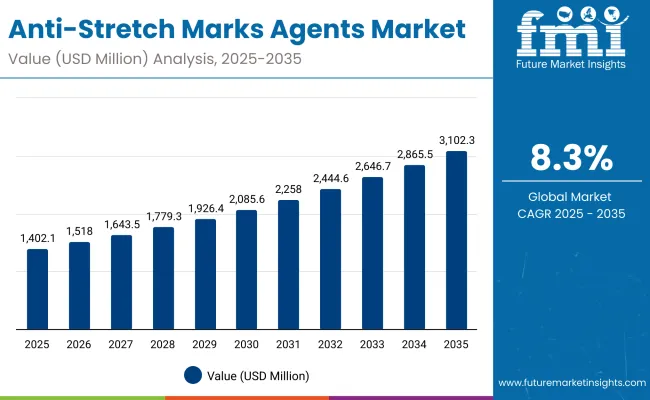
Quick Stats for Anti-Stretch Marks Agents Market

  • Anti-Stretch Marks Agents Market Value (2025): USD 1,402.1 million
  • Anti-Stretch Marks Agents Market Forecast Value (2035): USD 3,102.3 million
  • Anti-Stretch Marks Agents Market Forecast CAGR: 8.3%
  • Leading Segment in Anti-Stretch Marks Agents Market in 2025: Peptide-based ingredients (61.0%)
  • Key Growth Regions in the Anti-Stretch Marks Agents Market: North America, Europe, China, India, Japan
  • Top Key Players in Anti-Stretch Marks Agents Market: BASF, Croda, Lubrizol (Lipotec), Ashland, Clariant, Givaudan, Symrise, Seppic, DSM-Firmenich, Rahn

Anti Stretch Marks Agents Market

Anti-Stretch Marks Agents Market Key Takeaways

Metric Value
Anti-Stretch Marks Agents Market Estimated Value in (2025E) USD 1,402.1 million
Anti-Stretch Marks Agents Market Forecast Value in (2035F) USD 3,102.3 million
Forecast CAGR (2025 to 2035) 8.3%

The first half of the forecast period, from 2025 to 2030, is expected to see the market expand from USD 1,402.1 million to USD 2,085.6 million, adding USD 683.5 million. This segment of growth is forecast to contribute around 40% of the total decade increase, led by rising adoption in maternity care formulations and stronger integration into dermocosmetic body care ranges. The emphasis during these years is projected to remain on elasticity and firmness boosters that address preventive care needs, while peptide-based actives will secure a leading share through clinically backed results.

The second phase from 2030 to 2035 is anticipated to deliver an additional USD 1,016.7 million, which equals about 60% of the total market expansion. This acceleration is likely to be driven by expanded application in premium personal care lines, alongside a growing reliance on encapsulation technologies that enhance bioavailability and compatibility. By 2025, peptide-based ingredients are expected to dominate with 61.0% share, while encapsulated delivery systems are projected to hold 65.0% share, confirming their status as formulation standards. Regional leadership is forecast to remain with the USA and Europe in value terms, although China and India are projected to drive the fastest growth momentum.

From 2020 to 2024, the anti-stretch marks agents market was transitioned from a niche skincare ingredient category into a central part of dermocosmetic and maternity care formulations. Ingredient suppliers with encapsulation platforms and GMP-certified peptide production were positioned as leaders, capturing considerable procurement budgets. Competitive positioning was defined by clinical validation, enhanced bioavailability, and reliable claim substantiation.

By 2025, a valuation of USD 1,402.1 million is expected, with encapsulated delivery systems and peptide actives driving the mix. By 2035, the market is projected to more than double to USD 3,102.3 million, fueled by expanding demand in China and India, while the USA and Europe continue to anchor value. Competitive advantage is anticipated to shift decisively toward clinically backed peptides and advanced delivery systems with proven consumer outcomes.

Why the Anti-Stretch Marks Agents Market is growing?

Growth in the anti-stretch marks agents market is being driven by rising consumer demand for preventive and corrective skincare solutions. Increased awareness of skin health during maternity care and body care routines has been creating consistent adoption opportunities. Formulation advancements such as peptide-based actives and biotechnology-derived complexes are being prioritized due to their clinically validated outcomes in collagen remodeling and elasticity improvement. Encapsulation technologies are being widely adopted as they enhance bioavailability, improve stability, and support targeted release within formulations. Regional expansion is being reinforced by accelerated consumption in Asia, particularly in China and India, where higher CAGR growth is projected due to expanding middle-class populations and increasing affordability. Premiumization of personal care products is also stimulating demand, as dermocosmetic brands seek advanced raw materials with proven efficacy. As regulatory focus on safety and clinical substantiation strengthens, suppliers offering transparent dossiers and GMP-certified production are expected to capture greater procurement share.

Segmental Analysis

The anti-stretch marks agents market has been segmented across multiple parameters, including mode of action, source, and delivery system. Each segment reflects unique demand drivers that shape ingredient adoption and formulation trends. Mode of action highlights mechanisms addressing elasticity, firmness, and collagen remodeling, which are expected to remain central in preventive care solutions. Source-based classification demonstrates the growing emphasis on peptides, botanical, and biotechnology-derived actives that offer clinically validated efficacy. Delivery systems illustrate the critical role of encapsulation and free-form solutions in enhancing stability and performance. Together, these segments provide clarity on how ingredient-level innovation, coupled with formulation compatibility, is expected to accelerate procurement and strengthen market growth through 2035.
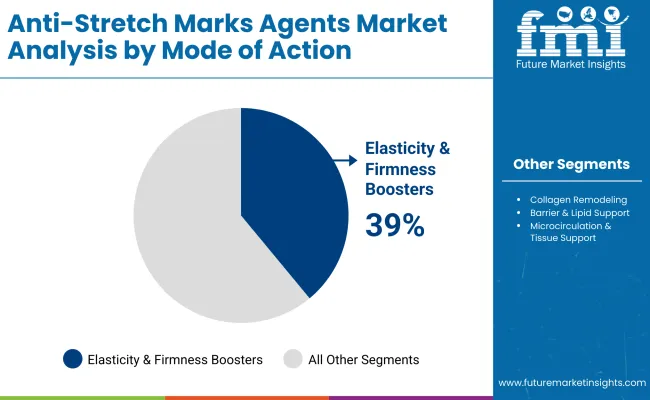
Insights into the Mode of Action Segment with Elasticity & Firmness Boosters Leading in Share

Anti Stretch Marks Agents Market By Mode Of Action

Mode of Action Market Value Share, 2025
Elasticity & firmness boosters 39%
Others 61.0%

Elasticity and firmness boosters are projected to account for 39% of the market in 2025, with an estimated value of USD 546.82 million. Growth is being driven by increasing demand for preventive formulations that strengthen skin resilience and reduce the visibility of stretch marks. Procurement strategies are expected to prioritize clinically substantiated actives that demonstrate elasticity improvements and long-term skin benefits. The segment is also anticipated to benefit from rising integration into maternity care ranges, where demand for proven preventive solutions is highest. While other mechanisms such as collagen remodeling are forecast to gain relevance, elasticity boosters are projected to remain the most adopted mode of action through the forecast horizon.
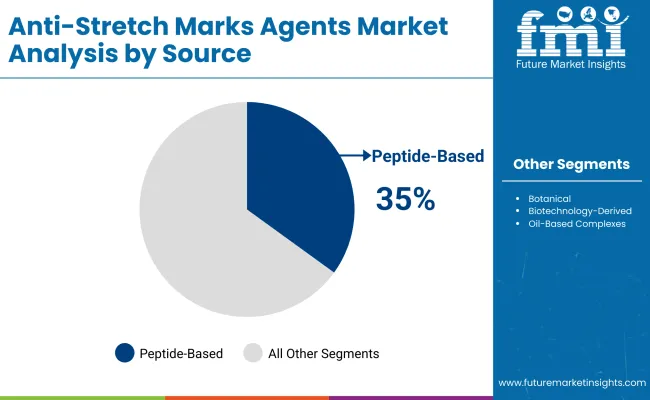
Insights into the Source Segment with Peptide-based Ingredients Driving Growth

Anti Stretch Marks Agents Market By Source

Source Market Value Share, 2025
Peptide-based 35%
Others 65.0%

Peptide-based actives are estimated to secure 35% of the global market in 2025, equating to USD 490.74 million. Their adoption is being accelerated by strong clinical evidence demonstrating their ability to stimulate collagen production and support tissue regeneration. Demand is expected to be reinforced by dermocosmetic brands that seek scientifically validated raw materials capable of supporting premium claims. Procurement teams are anticipated to continue favoring peptides for their efficacy, even though their higher cost positions them as specialized inputs. Other sources such as botanical and biotechnology-derived actives are also projected to witness increasing uptake, yet peptide-based ingredients are forecast to remain the leading driver of innovation and differentiation across the next decade.
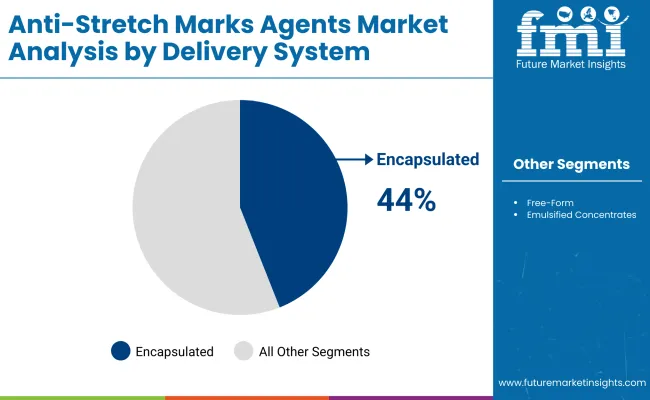
Insights into the Delivery System Segment with Encapsulated Formats Leading the Market

Anti Stretch Marks Agents Market By Delivery System

Delivery System Market Value Share, 2025
Encapsulated 44%
Others 56.0%

Encapsulated delivery systems are forecast to capture 44% of the market in 2025, representing USD 616.92 million in value. Their dominance is being supported by superior bioavailability, enhanced ingredient stability, and controlled release mechanisms that improve performance in final formulations. Adoption is expected to accelerate as dermocosmetic and maternity care brands increasingly prioritize differentiated formulations with verifiable efficacy. Encapsulation is also anticipated to reduce degradation risks during manufacturing and storage, which further strengthens its role in supply chain resilience. While free-form and emulsified formats will continue to serve cost-driven applications, encapsulated actives are projected to emerge as the benchmark standard for next-generation anti-stretch mark formulations through 2035.

What are the Drivers, Restraints, and Key Trends of the Anti-Stretch Marks Agents Market?

Complex formulation requirements and stringent safety validations are shaping the anti-stretch marks agents market, even as ingredient innovation and expanding clinical substantiation are unlocking broader opportunities across dermocosmetic, maternity, and global personal care portfolios.

Clinical Integration into Dermocosmetics

Market expansion is being accelerated by the integration of anti-stretch marks agents into dermocosmetic treatment frameworks. Dermatologists and aesthetic practitioners are increasingly specifying peptide-based and encapsulated actives in professional-grade formulations, supported by assay-backed efficacy and safety data. This clinical integration is reinforcing trust, allowing ingredient suppliers to secure premium positioning within procurement pipelines. Furthermore, the regulatory acceptance of these clinically validated actives is expected to ensure faster inclusion in new product launches, particularly where high evidence thresholds are demanded by regulators and healthcare professionals.

Manufacturing Complexity of Advanced Delivery Systems

Growth is being constrained by the technical complexity associated with producing encapsulated delivery systems at scale. Encapsulation requires precision in particle sizing, stability control, and compatibility testing with multiple excipient bases, which raises costs and lengthens production cycles. Contract manufacturers often face bottlenecks when handling such specialized systems, limiting throughput and increasing dependence on a few specialized suppliers. These constraints can slow down commercialization timelines and reduce flexibility for brands aiming to diversify their product ranges. As procurement shifts toward encapsulated actives, the need for standardized, cost-efficient manufacturing platforms will be critical to overcoming this restraint.
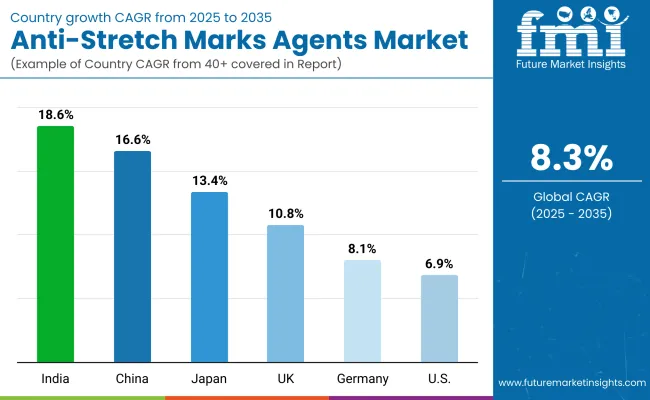
Analysis of Anti-Stretch Marks Agents Market By Key Countries

Country Wise Anti Stretch Marks Agents Market

Country CAGR
China 16.6%
USA 6.9%
India 18.6%
UK 10.8%
Germany 8.1%
Japan 13.4%

The anti-stretch marks agents market demonstrates varying adoption dynamics across key countries, shaped by consumer behavior, regulatory standards, and the maturity of dermocosmetic industries. Asia is projected to remain the fastest-expanding region, anchored by India at 18.6% CAGR and China at 16.6%. India’s momentum is being reinforced by rapid urbanization, rising disposable incomes, and growing awareness of maternity care, which is prompting stronger adoption of clinically validated ingredients. China’s trajectory reflects an expanding middle-class population and a surge in premium personal care consumption, supported by government emphasis on innovation within cosmetic formulations.

Japan is anticipated to grow at 13.4% CAGR, sustained by demand for advanced dermocosmetic solutions and consumer trust in clinically proven actives. In Europe, the UK is forecast at 10.8% CAGR, while Germany is expected at 8.1%, reflecting continued reliance on high safety standards and regulatory-driven adoption of quality ingredients. Europe overall is projected at 10.0%, benefiting from a mature consumer base that prioritizes clinically tested and sustainable formulations. The USA market, advancing at 6.9% CAGR, is anticipated to grow steadily, with emphasis on premium brands and dermatology-led innovations. Collectively, these dynamics highlight how regional disparities in consumer expectations and regulatory frameworks are shaping ingredient-level demand worldwide.
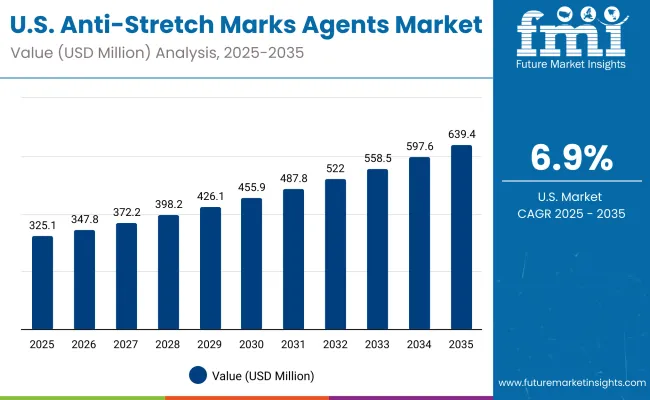
Sales Outlook for Anti-Stretch Marks Agents in the United States

Usa Anti Stretch Marks Agents Market

Year USA Anti-Stretch Marks Agents Market (USD Million)
2025 325.13
2026 347.88
2027 372.23
2028 398.27
2029 426.14
2030 455.97
2031 487.87
2032 522.01
2033 558.54
2034 597.63
2035 639.45

The anti-stretch marks agents market in the United States is projected to grow at a CAGR of 6.9% during 2025-2035. The market is expected to expand from USD 325.13 million in 2025 to USD 639.45 million by 2035, supported by consumer awareness of preventive skincare and rising dermocosmetic innovations. Growth is anticipated to be reinforced by the adoption of clinically validated actives such as peptides, as well as encapsulated delivery systems that enhance formulation performance. Regulatory alignment with international safety standards is projected to sustain confidence in advanced ingredients, while dermatology-led endorsements are expected to influence consumer purchasing patterns. Procurement decisions are also likely to shift toward suppliers offering transparent sourcing and sustainability certifications.

  • Peptide-based actives are being prioritized in premium formulations for clinically validated outcomes.
  • Encapsulation platforms are projected to strengthen demand due to stability and controlled release.
  • Professional dermatology endorsements are anticipated to accelerate consumer adoption across product lines.

Growth and Expansion Outlook for Anti-Stretch Marks Agents Market in the United Kingdom

The anti-stretch marks agents market in the UK is projected to grow at a CAGR of 10.8% during 2025-2035. Expansion is expected to be supported by retailer-led premiumization, strict cosmetic safety compliance, and rapid uptake of clinically substantiated actives in dermocosmetic body-care lines. Encapsulation platforms are anticipated to gain share as brands seek stability across complex base systems and extended supply chains. E-commerce and pharmacy channels are projected to accelerate trial, while dermatologist advocacy is expected to validate preventive claims for maternity care.

  • Peptide-forward briefs are being specified to unlock elasticity and firmness outcomes.
  • Encapsulated formats are projected to reduce degradation and improve bioavailability.
  • Retailer quality charters are anticipated to favor dossier-rich suppliers.
  • Private-label upgrades are expected to widen access at mid-tier price points.

Growth and Expansion Outlook for Anti-Stretch Marks Agents Market in India

The anti-stretch marks agents market in India is projected to grow at a CAGR of 18.6% during 2025-2035. Growth is expected to be propelled by rapid urbanization, rising maternity-care awareness, and the scale-up of domestic manufacturing under stringent quality systems. Portfolio mixes are anticipated to tilt toward clinically validated peptides paired with cost-effective co-actives, enabling premium mass positioning. Encapsulation is projected to see strong adoption in hot-climate stability programs and D2C launches.

  • Contract manufacturers are being onboarded for GMP-grade peptide and encapsulation runs.
  • Pharmacy and e-commerce hybrids are expected to drive trial beyond metros.
  • Multilingual claims and safety narratives are anticipated to increase trust.
  • Value engineering with smaller pack sizes is projected to expand reach.

Sales Outlook for Anti-Stretch Marks Agents in China

The anti-stretch marks agents market in China is projected to grow at a CAGR of 16.6% during 2025-2035. Expansion is expected to be underpinned by premium personal-care consumption, fast product refresh cycles, and strong KOL-dermatology influence on ingredient credibility. Peptide-based inputs are anticipated to scale alongside local innovation in biotechnology and advanced delivery systems. Cross-border and domestic platforms are projected to amplify brand discovery and rapid formulation iteration.
  • Speed-to-market via agile CMOs is being prioritized for seasonal drops.
  • Encapsulated systems are expected to support stability in complex textures.
  • Regulatory modernization is anticipated to reward transparent safety dossiers.
  • Tier-2/3 city penetration is projected to broaden demand beyond coastal hubs.

In-depth Analysis of Anti-Stretch Marks Agents in Germany

Europe Anti Stretch Marks Agents Market

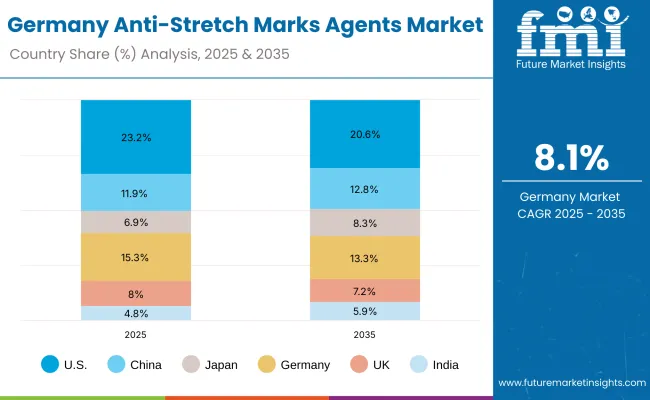
Country 2025
USA 23.2%
China 11.9%
Japan 6.9%
Germany 15.3%
UK 8.0%
India 4.8%
Country 2035
USA 20.6%
China 12.8%
Japan 8.3%
Germany 13.3%
UK 7.2%
India 5.9%

The anti-stretch marks agents market in Germany is projected to grow at a CAGR of 8.1% during 2025 to 2035. Growth is expected to reflect strong pharmacist-led counseling, rigorous safety expectations, and preference for science-backed formulations. Dermatology-endorsed peptides and controlled-release systems are anticipated to anchor premium offerings, while sustainability credentials are projected to act as tie-breakers in procurement.
  • Evidence-heavy claims with assay linkage are being favored by regulators and retailers.
  • Encapsulation is expected to support hypoallergenic and sensitive-skin propositions.
  • Local QA standards are anticipated to reward GMP-certified supply partners.
  • Clean-label inputs with traceable sourcing are projected to gain shelf advantage.

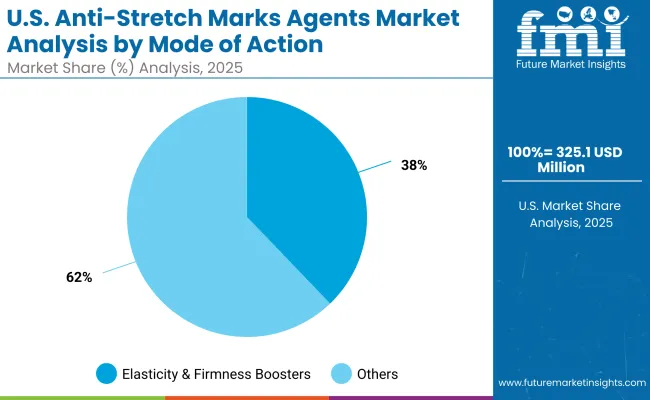
Growth Outlook for Anti-Stretch Marks Agents Market in USA

Us Anti Stretch Marks Agents Market

USA By Mode of Action Market Value Share, 2025
Elasticity & firmness boosters 38%
Others 62.4%

The anti-stretch marks agents market in the USA is projected at USD 325.13 million in 2025. Elasticity and firmness boosters contribute 38%, equivalent to USD 122.25 million, while the remaining 62.4% or USD 202.88 million is generated by other mechanisms, including collagen remodeling and barrier support systems. This distribution reflects a clear orientation toward clinically validated preventive solutions while leaving space for diversified functional pathways. Elasticity boosters are being prioritized due to their role in maintaining skin resilience and delivering measurable improvements, which align with dermatology-led product claims. Meanwhile, broader mechanisms are being retained in formulations as brands seek multi-functional appeal across dermocosmetic and maternity-care categories. As advanced delivery formats enhance the efficacy of elasticity-focused actives, their prominence is anticipated to grow further through the decade. The combination of preventive efficacy and multifunctional innovation is projected to define the USA outlook.
  • USA market is valued at USD 325.13 million in 2025.
  • Elasticity boosters hold 38% share, valued at USD 122.25 million.
  • Other mechanisms account for 62.4% share, valued at USD 202.88 million.
  • Dermatology-backed preventive care emphasis is expected to strengthen elasticity-focused adoption.

Opportunity Analysis of China Anti-Stretch Marks Agents Market

China Anti Stretch Marks Agents Market

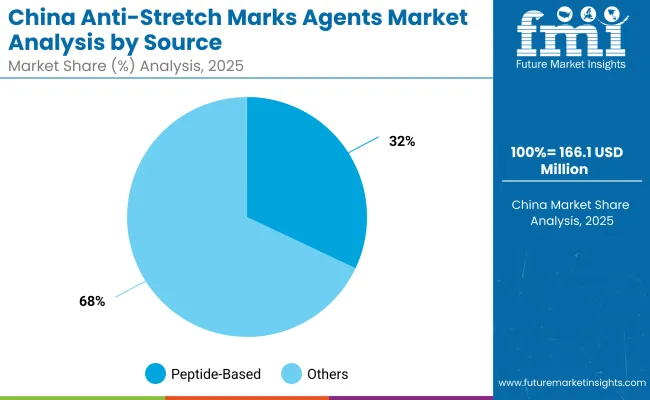
China By Source Market Value Share, 2025
Peptide-based 32%
Others 67.9%

The anti-stretch marks agents market in China is estimated at USD 166.18 million in 2025. Peptide-based actives are projected to contribute 32%, valued at USD 53.34 million, while other sources represent 67.9%, equal to USD 112.83 million. This distribution illustrates a strong opportunity for peptides, which are being increasingly recognized for their role in stimulating collagen and supporting skin regeneration. Their penetration, however, remains moderated by higher costs and limited large-scale local production capacity. Broader categories, including botanicals and biotechnology-derived actives, are being widely adopted due to affordability, cultural acceptance, and integration into traditional beauty practices. Growth is expected to accelerate as peptides gain traction through premium dermocosmetic launches, clinical substantiation, and cross-border brand strategies. The wider availability of encapsulated formats is anticipated to further strengthen the performance of peptides, ensuring higher adoption in the medium to long term.
  • Chinese market is valued at USD 166.18 million in 2025.
  • Peptide-based actives account for 32%, valued at USD 53.34 million.
  • Other sources dominate with 67.9%, equal to USD 112.83 million.
  • Local innovation and cross-border imports are expected to accelerate peptide adoption.

Competitive Landscape of Anti-Stretch Marks Agents Market

Anti Stretch Marks Agents Market By Company

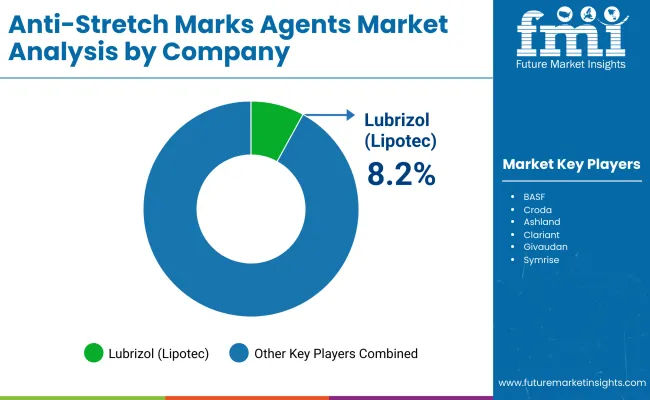
Company Global Value Share 2025
Lubrizol (Lipotec) 8.2%
Others 91.8%

The anti-stretch marks agents market is moderately consolidated, with global leaders, established raw material suppliers, and specialized innovators competing across dermocosmetic and maternity-care formulations. Multinational suppliers such as BASF, Croda, Clariant, Givaudan, Symrise, Seppic, DSM-Firmenich, and Ashland are positioned as key players, with Lubrizol (Lipotec) emerging as a notable market leader. According to 2025 estimates, Lubrizol (Lipotec) is projected to hold 8.2% of the global market value, while the remaining 91.8% share is fragmented among other ingredient providers.

Strategic emphasis has been placed on the development of peptide-based actives, encapsulation platforms, and clinically substantiated ingredients that align with preventive and corrective skincare trends. Larger suppliers are expected to leverage their scale, regulatory expertise, and global distribution to secure long-term procurement contracts with dermocosmetic majors. Mid-sized companies are anticipated to focus on innovation-driven growth, introducing differentiated formulations through partnerships with contract manufacturers and localized distributors.

Competitive differentiation is being reshaped by demand for clinical validation, sustainability credentials, and supply-chain transparency. The ability to provide assay-linked efficacy data, alongside GMP-certified manufacturing, is projected to act as a key selection criterion for brand owners. The competitive landscape is likely to evolve further as encapsulation technology adoption increases and regional companies strengthen positions through cost-optimized botanicals and biotechnology-derived actives.

Key Developments in Anti-Stretch Marks Agents Market

  • In July 2025, Clinikally reported that Heptapeptide-7 (HP7) was gaining attention as a regenerative peptide for stretch mark treatment. Preliminary evidence suggested that HP7 exhibited promise in smoothing and supporting skin repair, particularly in post-pregnancy applications.
  • In April 2025, an industry analysis noted that consumers’ preference for non-invasive, in-home stretch mark solutions had surged, driven by digital content, social media awareness, and growing demand for topical formulations with peptides, retinols, and botanicals. Effective elasticity-enhancing and barrier-support ingredients were being emphasized.

Scope of the Report

Item Value
Market Size (2025E) USD 1,402.1 million
Market Size (2035F) USD 3,102.3 million
Forecast CAGR (2025 to 2035) 8.30%
Quantitative Units USD million
Study Period 2025 to 2035
Market Definition Active ingredients and delivery systems used in anti-stretch-mark formulations for dermocosmetic, maternity, and body-care applications
Segmentation - Mode of Action Elasticity & firmness boosters; Collagen remodeling; Barrier & lipid support; Microcirculation & tissue support
Segmentation - Source Peptide-based; Botanical; Biotechnology-derived; Oil-based complexes
Segmentation - Delivery System Encapsulated; Free-form; Emulsified concentrates
Segmentation - Physical Form Emulsion concentrates; Powder; Solution/concentrate
Segmentation - Application Creams & lotions; Oils; Balms & butters; Serums
Segmentation - End Use Maternity care; Body care; Dermocosmetic
Regions Covered North America; Europe; East Asia; South Asia & Pacific; Latin America; Middle East & Africa
Countries Covered United States; China; India; United Kingdom; Germany; Japan
2025 Leaders (Select Shares) Encapsulated delivery 44% (USD 616.92 million); Elasticity & firmness boosters 39% (USD 546.82 million); Peptide-based source 35% (USD 490.74 million)
USA Snapshot (2025) USD 325.13 million
China Snapshot (2025) USD 166.18 million
Key Companies Profiled Lubrizol (Lipotec); BASF; Croda; Ashland; Clariant; Givaudan; Symrise; Seppic; DSM-Firmenich; Rahn
Additional Attributes Dollar sales by segment; dossier-backed efficacy and safety; GMP supply readiness; encapsulation for stability and controlled release; peptide platform scale-up; sustainability and traceability requirements; regional growth led by Asia with strong USA/Europe value leadership

Key Segments

By Mode of Action:

  • Elasticity & firmness boosters
  • Collagen remodeling enhancers
  • Barrier & lipid replenishment systems
  • Microcirculation & tissue support

By Source:

  • Botanical
  • Peptide-based
  • Biotechnology-derived
  • Oil-based complexes

By Delivery System:

  • Free form
  • Encapsulated
  • Emulsified concentrates

By Physical Form:

  • Solution/concentrate
  • Emulsion concentrate
  • Powder

By Region:

  • North America
  • Latin America
  • Europe
  • East Asia
  • South Asia & Pacific
  • Middle East and Africa

Table of Content

  1. Executive Summary
    • Global Market Outlook
    • Demand-side Trends
    • Supply-side Trends
    • Technology Roadmap Analysis
    • Analysis and Recommendations
  2. Market Overview
    • Market Coverage / Taxonomy
    • Market Definition / Scope / Limitations
  3. Market Background
    • Market Dynamics
      • Drivers
      • Restraints
      • Opportunity
      • Trends
    • Scenario Forecast
      • Demand in Optimistic Scenario
      • Demand in Likely Scenario
      • Demand in Conservative Scenario
    • Opportunity Map Analysis
    • Product Life Cycle Analysis
    • Supply Chain Analysis
      • Supply Side Participants and their Roles
        • Producers
        • Mid-Level Participants (Traders/ Agents/ Brokers)
        • Wholesalers and Distributors
      • Value Added and Value Created at Node in the Supply Chain
      • List of Raw Material Suppliers
      • List of Existing and Potential Buyer’s
    • Investment Feasibility Matrix
    • Value Chain Analysis
      • Profit Margin Analysis
      • Wholesalers and Distributors
      • Retailers
    • PESTLE and Porter’s Analysis
    • Regulatory Landscape
      • By Key Regions
      • By Key Countries
    • Regional Parent Market Outlook
    • Production and Consumption Statistics
    • Import and Export Statistics
  4. Global Market Analysis 2020 to 2024 and Forecast, 2025 to 2035
    • Historical Market Size Value (USD Million) & Volume (Units) Analysis, 2020 to 2024
    • Current and Future Market Size Value (USD Million) & Volume (Units) Projections, 2025 to 2035
      • Y-o-Y Growth Trend Analysis
      • Absolute $ Opportunity Analysis
  5. Global Market Analysis 2020 to 2024 and Forecast 2025 to 2035, By  Mode of Action
    • Introduction / Key Findings
    • Historical Market Size Value (USD Million) & Volume (Units) Analysis By  Mode of Action, 2020 to 2024
    • Current and Future Market Size Value (USD Million) & Volume (Units) Analysis and Forecast By  Mode of Action, 2025 to 2035
      • Elasticity & firmness boosters
      • Collagen remodeling enhancers
      • Barrier & lipid replenishment systems
      • Microcirculation & tissue support
    • Y-o-Y Growth Trend Analysis By  Mode of Action, 2020 to 2024
    • Absolute $ Opportunity Analysis By  Mode of Action, 2025 to 2035
  6. Global Market Analysis 2020 to 2024 and Forecast 2025 to 2035, By  Source
    • Introduction / Key Findings
    • Historical Market Size Value (USD Million) & Volume (Units) Analysis By  Source, 2020 to 2024
    • Current and Future Market Size Value (USD Million) & Volume (Units) Analysis and Forecast By  Source, 2025 to 2035
      • Botanical
      • Peptide-based
      • Biotechnology-derived
      • Oil-based complexes
    • Y-o-Y Growth Trend Analysis By  Source, 2020 to 2024
    • Absolute $ Opportunity Analysis By  Source, 2025 to 2035
  7. Global Market Analysis 2020 to 2024 and Forecast 2025 to 2035, By  Delivery System
    • Introduction / Key Findings
    • Historical Market Size Value (USD Million) & Volume (Units) Analysis By  Delivery System, 2020 to 2024
    • Current and Future Market Size Value (USD Million) & Volume (Units) Analysis and Forecast By  Delivery System, 2025 to 2035
      • Free form
      • Encapsulated
      • Emulsified concentrates
    • Y-o-Y Growth Trend Analysis By  Delivery System, 2020 to 2024
    • Absolute $ Opportunity Analysis By  Delivery System, 2025 to 2035
  8. Global Market Analysis 2020 to 2024 and Forecast 2025 to 2035, By  Physical Form
    • Introduction / Key Findings
    • Historical Market Size Value (USD Million) & Volume (Units) Analysis By  Physical Form, 2020 to 2024
    • Current and Future Market Size Value (USD Million) & Volume (Units) Analysis and Forecast By  Physical Form, 2025 to 2035
      • Solution/concentrate
      • Emulsion concentrate
      • Powder
    • Y-o-Y Growth Trend Analysis By  Physical Form, 2020 to 2024
    • Absolute $ Opportunity Analysis By  Physical Form, 2025 to 2035
  9. Global Market Analysis 2020 to 2024 and Forecast 2025 to 2035, By  Application
    • Introduction / Key Findings
    • Historical Market Size Value (USD Million) & Volume (Units) Analysis By  Application, 2020 to 2024
    • Current and Future Market Size Value (USD Million) & Volume (Units) Analysis and Forecast By  Application, 2025 to 2035
      • Oils
      • Creams & lotions
      • Balms & butters
      • Serums
    • Y-o-Y Growth Trend Analysis By  Application, 2020 to 2024
    • Absolute $ Opportunity Analysis By  Application, 2025 to 2035
  10. Global Market Analysis 2020 to 2024 and Forecast 2025 to 2035, By  End Use
    • Introduction / Key Findings
    • Historical Market Size Value (USD Million) & Volume (Units) Analysis By  End Use, 2020 to 2024
    • Current and Future Market Size Value (USD Million) & Volume (Units) Analysis and Forecast By  End Use, 2025 to 2035
      • Maternity care
      • Body care
      • Dermocosmetic
    • Y-o-Y Growth Trend Analysis By  End Use, 2020 to 2024
    • Absolute $ Opportunity Analysis By  End Use, 2025 to 2035
  11. Global Market Analysis 2020 to 2024 and Forecast 2025 to 2035, By Region
    • Introduction
    • Historical Market Size Value (USD Million) & Volume (Units) Analysis By Region, 2020 to 2024
    • Current Market Size Value (USD Million) & Volume (Units) Analysis and Forecast By Region, 2025 to 2035
      • North America
      • Latin America
      • Europe
      • East Asia
      • South Asia & Pacific
      • Middle East and Africa
    • Market Attractiveness Analysis By Region
  12. North America Market Analysis 2020 to 2024 and Forecast 2025 to 2035, By Country
    • Historical Market Size Value (USD Million) & Volume (Units) Trend Analysis By Market Taxonomy, 2020 to 2024
    • Market Size Value (USD Million) & Volume (Units) Forecast By Market Taxonomy, 2025 to 2035
      • By Country
        • USA
        • Canada
      • By  Mode of Action
      • By  Source
      • By  Delivery System
      • By  Physical Form
      • By  Application
      • By  End Use
    • Market Attractiveness Analysis
      • By Country
      • By  Mode of Action
      • By  Source
      • By  Delivery System
      • By  Physical Form
      • By  Application
      • By  End Use
    • Key Takeaways
  13. Latin America Market Analysis 2020 to 2024 and Forecast 2025 to 2035, By Country
    • Historical Market Size Value (USD Million) & Volume (Units) Trend Analysis By Market Taxonomy, 2020 to 2024
    • Market Size Value (USD Million) & Volume (Units) Forecast By Market Taxonomy, 2025 to 2035
      • By Country
        • Brazil
        • Mexico
        • Colombia
        • Rest of Latin America
      • By  Mode of Action
      • By  Source
      • By  Delivery System
      • By  Physical Form
      • By  Application
      • By  End Use
    • Market Attractiveness Analysis
      • By Country
      • By  Mode of Action
      • By  Source
      • By  Delivery System
      • By  Physical Form
      • By  Application
      • By  End Use
    • Key Takeaways
  14. Europe Market Analysis 2020 to 2024 and Forecast 2025 to 2035, By Country
    • Historical Market Size Value (USD Million) & Volume (Units) Trend Analysis By Market Taxonomy, 2020 to 2024
    • Market Size Value (USD Million) & Volume (Units) Forecast By Market Taxonomy, 2025 to 2035
      • By Country
        • Germany
        • UK
        • France
        • Italy
        • Spain
        • Belgium
        • Netherlands
        • Nordic
        • Switzerland
        • Russia
        • Poland
        • Rest of Europe
      • By  Mode of Action
      • By  Source
      • By  Delivery System
      • By  Physical Form
      • By  Application
      • By  End Use
    • Market Attractiveness Analysis
      • By Country
      • By  Mode of Action
      • By  Source
      • By  Delivery System
      • By  Physical Form
      • By  Application
      • By  End Use
    • Key Takeaways
  15. East Asia Market Analysis 2020 to 2024 and Forecast 2025 to 2035, By Country
    • Historical Market Size Value (USD Million) & Volume (Units) Trend Analysis By Market Taxonomy, 2020 to 2024
    • Market Size Value (USD Million) & Volume (Units) Forecast By Market Taxonomy, 2025 to 2035
      • By Country
        • China
        • Japan
        • South Korea
      • By  Mode of Action
      • By  Source
      • By  Delivery System
      • By  Physical Form
      • By  Application
      • By  End Use
    • Market Attractiveness Analysis
      • By Country
      • By  Mode of Action
      • By  Source
      • By  Delivery System
      • By  Physical Form
      • By  Application
      • By  End Use
    • Key Takeaways
  16. South Asia & Pacific Market Analysis 2020 to 2024 and Forecast 2025 to 2035, By Country
    • Historical Market Size Value (USD Million) & Volume (Units) Trend Analysis By Market Taxonomy, 2020 to 2024
    • Market Size Value (USD Million) & Volume (Units) Forecast By Market Taxonomy, 2025 to 2035
      • By Country
        • India
        • Thailand
        • Malaysia
        • Indonesia
        • Singapore
        • Vietnam
        • Australia
        • New Zealand
        • Rest of South Asia
      • By  Mode of Action
      • By  Source
      • By  Delivery System
      • By  Physical Form
      • By  Application
      • By  End Use
    • Market Attractiveness Analysis
      • By Country
      • By  Mode of Action
      • By  Source
      • By  Delivery System
      • By  Physical Form
      • By  Application
      • By  End Use
    • Key Takeaways
  17. Middle East and Africa Market Analysis 2020 to 2024 and Forecast 2025 to 2035, By Country
    • Historical Market Size Value (USD Million) & Volume (Units) Trend Analysis By Market Taxonomy, 2020 to 2024
    • Market Size Value (USD Million) & Volume (Units) Forecast By Market Taxonomy, 2025 to 2035
      • By Country
        • Turkey
        • UAE
        • Saudi Arabia
        • Israel
        • Other GCC Countries
        • North Africa
        • South Africa
      • By  Mode of Action
      • By  Source
      • By  Delivery System
      • By  Physical Form
      • By  Application
      • By  End Use
    • Market Attractiveness Analysis
      • By Country
      • By  Mode of Action
      • By  Source
      • By  Delivery System
      • By  Physical Form
      • By  Application
      • By  End Use
    • Key Takeaways
  18. Key Countries Market Analysis
    • USA
      • Pricing Analysis
      • Market Share Analysis, 2024
        • By  Mode of Action
        • By  Source
        • By  Delivery System
        • By  Physical Form
        • By  Application
        • By  End Use
    • Canada
      • Pricing Analysis
      • Market Share Analysis, 2024
        • By  Mode of Action
        • By  Source
        • By  Delivery System
        • By  Physical Form
        • By  Application
        • By  End Use
    • Brazil
      • Pricing Analysis
      • Market Share Analysis, 2024
        • By  Mode of Action
        • By  Source
        • By  Delivery System
        • By  Physical Form
        • By  Application
        • By  End Use
    • Mexico
      • Pricing Analysis
      • Market Share Analysis, 2024
        • By  Mode of Action
        • By  Source
        • By  Delivery System
        • By  Physical Form
        • By  Application
        • By  End Use
    • Colombia
      • Pricing Analysis
      • Market Share Analysis, 2024
        • By  Mode of Action
        • By  Source
        • By  Delivery System
        • By  Physical Form
        • By  Application
        • By  End Use
    • Germany
      • Pricing Analysis
      • Market Share Analysis, 2024
        • By  Mode of Action
        • By  Source
        • By  Delivery System
        • By  Physical Form
        • By  Application
        • By  End Use
    • UK
      • Pricing Analysis
      • Market Share Analysis, 2024
        • By  Mode of Action
        • By  Source
        • By  Delivery System
        • By  Physical Form
        • By  Application
        • By  End Use
    • France
      • Pricing Analysis
      • Market Share Analysis, 2024
        • By  Mode of Action
        • By  Source
        • By  Delivery System
        • By  Physical Form
        • By  Application
        • By  End Use
    • Italy
      • Pricing Analysis
      • Market Share Analysis, 2024
        • By  Mode of Action
        • By  Source
        • By  Delivery System
        • By  Physical Form
        • By  Application
        • By  End Use
    • Spain
      • Pricing Analysis
      • Market Share Analysis, 2024
        • By  Mode of Action
        • By  Source
        • By  Delivery System
        • By  Physical Form
        • By  Application
        • By  End Use
    • Belgium
      • Pricing Analysis
      • Market Share Analysis, 2024
        • By  Mode of Action
        • By  Source
        • By  Delivery System
        • By  Physical Form
        • By  Application
        • By  End Use
    • Netherlands
      • Pricing Analysis
      • Market Share Analysis, 2024
        • By  Mode of Action
        • By  Source
        • By  Delivery System
        • By  Physical Form
        • By  Application
        • By  End Use
    • Nordic
      • Pricing Analysis
      • Market Share Analysis, 2024
        • By  Mode of Action
        • By  Source
        • By  Delivery System
        • By  Physical Form
        • By  Application
        • By  End Use
    • Switzerland
      • Pricing Analysis
      • Market Share Analysis, 2024
        • By  Mode of Action
        • By  Source
        • By  Delivery System
        • By  Physical Form
        • By  Application
        • By  End Use
    • Russia
      • Pricing Analysis
      • Market Share Analysis, 2024
        • By  Mode of Action
        • By  Source
        • By  Delivery System
        • By  Physical Form
        • By  Application
        • By  End Use
    • Poland
      • Pricing Analysis
      • Market Share Analysis, 2024
        • By  Mode of Action
        • By  Source
        • By  Delivery System
        • By  Physical Form
        • By  Application
        • By  End Use
    • China
      • Pricing Analysis
      • Market Share Analysis, 2024
        • By  Mode of Action
        • By  Source
        • By  Delivery System
        • By  Physical Form
        • By  Application
        • By  End Use
    • Japan
      • Pricing Analysis
      • Market Share Analysis, 2024
        • By  Mode of Action
        • By  Source
        • By  Delivery System
        • By  Physical Form
        • By  Application
        • By  End Use
    • South Korea
      • Pricing Analysis
      • Market Share Analysis, 2024
        • By  Mode of Action
        • By  Source
        • By  Delivery System
        • By  Physical Form
        • By  Application
        • By  End Use
    • India
      • Pricing Analysis
      • Market Share Analysis, 2024
        • By  Mode of Action
        • By  Source
        • By  Delivery System
        • By  Physical Form
        • By  Application
        • By  End Use
    • Thailand
      • Pricing Analysis
      • Market Share Analysis, 2024
        • By  Mode of Action
        • By  Source
        • By  Delivery System
        • By  Physical Form
        • By  Application
        • By  End Use
    • Indonesia
      • Pricing Analysis
      • Market Share Analysis, 2024
        • By  Mode of Action
        • By  Source
        • By  Delivery System
        • By  Physical Form
        • By  Application
        • By  End Use
    • Australia
      • Pricing Analysis
      • Market Share Analysis, 2024
        • By  Mode of Action
        • By  Source
        • By  Delivery System
        • By  Physical Form
        • By  Application
        • By  End Use
    • New Zealand
      • Pricing Analysis
      • Market Share Analysis, 2024
        • By  Mode of Action
        • By  Source
        • By  Delivery System
        • By  Physical Form
        • By  Application
        • By  End Use
    • Turkey
      • Pricing Analysis
      • Market Share Analysis, 2024
        • By  Mode of Action
        • By  Source
        • By  Delivery System
        • By  Physical Form
        • By  Application
        • By  End Use
    • UAE
      • Pricing Analysis
      • Market Share Analysis, 2024
        • By  Mode of Action
        • By  Source
        • By  Delivery System
        • By  Physical Form
        • By  Application
        • By  End Use
    • Saudi Arabia
      • Pricing Analysis
      • Market Share Analysis, 2024
        • By  Mode of Action
        • By  Source
        • By  Delivery System
        • By  Physical Form
        • By  Application
        • By  End Use
    • Israel
      • Pricing Analysis
      • Market Share Analysis, 2024
        • By  Mode of Action
        • By  Source
        • By  Delivery System
        • By  Physical Form
        • By  Application
        • By  End Use
    • North Africa
      • Pricing Analysis
      • Market Share Analysis, 2024
        • By  Mode of Action
        • By  Source
        • By  Delivery System
        • By  Physical Form
        • By  Application
        • By  End Use
    • South Africa
      • Pricing Analysis
      • Market Share Analysis, 2024
        • By  Mode of Action
        • By  Source
        • By  Delivery System
        • By  Physical Form
        • By  Application
        • By  End Use
  19. Market Structure Analysis
    • Competition Dashboard
    • Competition Benchmarking
    • Market Share Analysis of Top Players
      • By Regional
      • By  Mode of Action
      • By  Source
      • By  Delivery System
      • By  Physical Form
      • By  Application
      • By  End Use
  20. Competition Analysis
    • Competition Deep Dive
      • BASF
        • Overview
        • Product Portfolio
        • Profitability by Market Segments (Product/Age /Sales Channel/Region)
        • Sales Footprint
        • Strategy Overview
          • Marketing Strategy
          • Product Strategy
          • Channel Strategy
      • Croda
        • Overview
        • Product Portfolio
        • Profitability by Market Segments (Product/Age /Sales Channel/Region)
        • Sales Footprint
        • Strategy Overview
          • Marketing Strategy
          • Product Strategy
          • Channel Strategy
      • Lubrizol (Lipotec)
        • Overview
        • Product Portfolio
        • Profitability by Market Segments (Product/Age /Sales Channel/Region)
        • Sales Footprint
        • Strategy Overview
          • Marketing Strategy
          • Product Strategy
          • Channel Strategy
      • Ashland
        • Overview
        • Product Portfolio
        • Profitability by Market Segments (Product/Age /Sales Channel/Region)
        • Sales Footprint
        • Strategy Overview
          • Marketing Strategy
          • Product Strategy
          • Channel Strategy
      • Clariant
        • Overview
        • Product Portfolio
        • Profitability by Market Segments (Product/Age /Sales Channel/Region)
        • Sales Footprint
        • Strategy Overview
          • Marketing Strategy
          • Product Strategy
          • Channel Strategy
      • Givaudan
        • Overview
        • Product Portfolio
        • Profitability by Market Segments (Product/Age /Sales Channel/Region)
        • Sales Footprint
        • Strategy Overview
          • Marketing Strategy
          • Product Strategy
          • Channel Strategy
      • Symrise
        • Overview
        • Product Portfolio
        • Profitability by Market Segments (Product/Age /Sales Channel/Region)
        • Sales Footprint
        • Strategy Overview
          • Marketing Strategy
          • Product Strategy
          • Channel Strategy
      • Seppic
        • Overview
        • Product Portfolio
        • Profitability by Market Segments (Product/Age /Sales Channel/Region)
        • Sales Footprint
        • Strategy Overview
          • Marketing Strategy
          • Product Strategy
          • Channel Strategy
      • DSM-Firmenich
        • Overview
        • Product Portfolio
        • Profitability by Market Segments (Product/Age /Sales Channel/Region)
        • Sales Footprint
        • Strategy Overview
          • Marketing Strategy
          • Product Strategy
          • Channel Strategy
      • Rahn
        • Overview
        • Product Portfolio
        • Profitability by Market Segments (Product/Age /Sales Channel/Region)
        • Sales Footprint
        • Strategy Overview
          • Marketing Strategy
          • Product Strategy
          • Channel Strategy
      • Others
        • Overview
        • Product Portfolio
        • Profitability by Market Segments (Product/Age /Sales Channel/Region)
        • Sales Footprint
        • Strategy Overview
          • Marketing Strategy
          • Product Strategy
          • Channel Strategy
  21. Assumptions & Acronyms Used
  22. Research Methodology

List of Tables

  • Table 1: Global Market Value (USD Million) Forecast by Region, 2020-2035
  • Table 2: Global Market Volume (Units) Forecast by Region, 2020-2035
  • Table 3: Global Market Value (USD Million) Forecast by  Mode of Action, 2020-2035
  • Table 4: Global Market Volume (Units) Forecast by  Mode of Action, 2020-2035
  • Table 5: Global Market Value (USD Million) Forecast by  Source, 2020-2035
  • Table 6: Global Market Volume (Units) Forecast by  Source, 2020-2035
  • Table 7: Global Market Value (USD Million) Forecast by  Delivery System, 2020-2035
  • Table 8: Global Market Volume (Units) Forecast by  Delivery System, 2020-2035
  • Table 9: Global Market Value (USD Million) Forecast by  Physical Form, 2020-2035
  • Table 10: Global Market Volume (Units) Forecast by  Physical Form, 2020-2035
  • Table 11: Global Market Value (USD Million) Forecast by  Application, 2020-2035
  • Table 12: Global Market Volume (Units) Forecast by  Application, 2020-2035
  • Table 13: Global Market Value (USD Million) Forecast by  End Use, 2020-2035
  • Table 14: Global Market Volume (Units) Forecast by  End Use, 2020-2035
  • Table 15: North America Market Value (USD Million) Forecast by Country, 2020-2035
  • Table 16: North America Market Volume (Units) Forecast by Country, 2020-2035
  • Table 17: North America Market Value (USD Million) Forecast by  Mode of Action, 2020-2035
  • Table 18: North America Market Volume (Units) Forecast by  Mode of Action, 2020-2035
  • Table 19: North America Market Value (USD Million) Forecast by  Source, 2020-2035
  • Table 20: North America Market Volume (Units) Forecast by  Source, 2020-2035
  • Table 21: North America Market Value (USD Million) Forecast by  Delivery System, 2020-2035
  • Table 22: North America Market Volume (Units) Forecast by  Delivery System, 2020-2035
  • Table 23: North America Market Value (USD Million) Forecast by  Physical Form, 2020-2035
  • Table 24: North America Market Volume (Units) Forecast by  Physical Form, 2020-2035
  • Table 25: North America Market Value (USD Million) Forecast by  Application, 2020-2035
  • Table 26: North America Market Volume (Units) Forecast by  Application, 2020-2035
  • Table 27: North America Market Value (USD Million) Forecast by  End Use, 2020-2035
  • Table 28: North America Market Volume (Units) Forecast by  End Use, 2020-2035
  • Table 29: Latin America Market Value (USD Million) Forecast by Country, 2020-2035
  • Table 30: Latin America Market Volume (Units) Forecast by Country, 2020-2035
  • Table 31: Latin America Market Value (USD Million) Forecast by  Mode of Action, 2020-2035
  • Table 32: Latin America Market Volume (Units) Forecast by  Mode of Action, 2020-2035
  • Table 33: Latin America Market Value (USD Million) Forecast by  Source, 2020-2035
  • Table 34: Latin America Market Volume (Units) Forecast by  Source, 2020-2035
  • Table 35: Latin America Market Value (USD Million) Forecast by  Delivery System, 2020-2035
  • Table 36: Latin America Market Volume (Units) Forecast by  Delivery System, 2020-2035
  • Table 37: Latin America Market Value (USD Million) Forecast by  Physical Form, 2020-2035
  • Table 38: Latin America Market Volume (Units) Forecast by  Physical Form, 2020-2035
  • Table 39: Latin America Market Value (USD Million) Forecast by  Application, 2020-2035
  • Table 40: Latin America Market Volume (Units) Forecast by  Application, 2020-2035
  • Table 41: Latin America Market Value (USD Million) Forecast by  End Use, 2020-2035
  • Table 42: Latin America Market Volume (Units) Forecast by  End Use, 2020-2035
  • Table 43: Europe Market Value (USD Million) Forecast by Country, 2020-2035
  • Table 44: Europe Market Volume (Units) Forecast by Country, 2020-2035
  • Table 45: Europe Market Value (USD Million) Forecast by  Mode of Action, 2020-2035
  • Table 46: Europe Market Volume (Units) Forecast by  Mode of Action, 2020-2035
  • Table 47: Europe Market Value (USD Million) Forecast by  Source, 2020-2035
  • Table 48: Europe Market Volume (Units) Forecast by  Source, 2020-2035
  • Table 49: Europe Market Value (USD Million) Forecast by  Delivery System, 2020-2035
  • Table 50: Europe Market Volume (Units) Forecast by  Delivery System, 2020-2035
  • Table 51: Europe Market Value (USD Million) Forecast by  Physical Form, 2020-2035
  • Table 52: Europe Market Volume (Units) Forecast by  Physical Form, 2020-2035
  • Table 53: Europe Market Value (USD Million) Forecast by  Application, 2020-2035
  • Table 54: Europe Market Volume (Units) Forecast by  Application, 2020-2035
  • Table 55: Europe Market Value (USD Million) Forecast by  End Use, 2020-2035
  • Table 56: Europe Market Volume (Units) Forecast by  End Use, 2020-2035
  • Table 57: East Asia Market Value (USD Million) Forecast by Country, 2020-2035
  • Table 58: East Asia Market Volume (Units) Forecast by Country, 2020-2035
  • Table 59: East Asia Market Value (USD Million) Forecast by  Mode of Action, 2020-2035
  • Table 60: East Asia Market Volume (Units) Forecast by  Mode of Action, 2020-2035
  • Table 61: East Asia Market Value (USD Million) Forecast by  Source, 2020-2035
  • Table 62: East Asia Market Volume (Units) Forecast by  Source, 2020-2035
  • Table 63: East Asia Market Value (USD Million) Forecast by  Delivery System, 2020-2035
  • Table 64: East Asia Market Volume (Units) Forecast by  Delivery System, 2020-2035
  • Table 65: East Asia Market Value (USD Million) Forecast by  Physical Form, 2020-2035
  • Table 66: East Asia Market Volume (Units) Forecast by  Physical Form, 2020-2035
  • Table 67: East Asia Market Value (USD Million) Forecast by  Application, 2020-2035
  • Table 68: East Asia Market Volume (Units) Forecast by  Application, 2020-2035
  • Table 69: East Asia Market Value (USD Million) Forecast by  End Use, 2020-2035
  • Table 70: East Asia Market Volume (Units) Forecast by  End Use, 2020-2035
  • Table 71: South Asia & Pacific Market Value (USD Million) Forecast by Country, 2020-2035
  • Table 72: South Asia & Pacific Market Volume (Units) Forecast by Country, 2020-2035
  • Table 73: South Asia & Pacific Market Value (USD Million) Forecast by  Mode of Action, 2020-2035
  • Table 74: South Asia & Pacific Market Volume (Units) Forecast by  Mode of Action, 2020-2035
  • Table 75: South Asia & Pacific Market Value (USD Million) Forecast by  Source, 2020-2035
  • Table 76: South Asia & Pacific Market Volume (Units) Forecast by  Source, 2020-2035
  • Table 77: South Asia & Pacific Market Value (USD Million) Forecast by  Delivery System, 2020-2035
  • Table 78: South Asia & Pacific Market Volume (Units) Forecast by  Delivery System, 2020-2035
  • Table 79: South Asia & Pacific Market Value (USD Million) Forecast by  Physical Form, 2020-2035
  • Table 80: South Asia & Pacific Market Volume (Units) Forecast by  Physical Form, 2020-2035
  • Table 81: South Asia & Pacific Market Value (USD Million) Forecast by  Application, 2020-2035
  • Table 82: South Asia & Pacific Market Volume (Units) Forecast by  Application, 2020-2035
  • Table 83: South Asia & Pacific Market Value (USD Million) Forecast by  End Use, 2020-2035
  • Table 84: South Asia & Pacific Market Volume (Units) Forecast by  End Use, 2020-2035
  • Table 85: Middle East and Africa Market Value (USD Million) Forecast by Country, 2020-2035
  • Table 86: Middle East and Africa Market Volume (Units) Forecast by Country, 2020-2035
  • Table 87: Middle East and Africa Market Value (USD Million) Forecast by  Mode of Action, 2020-2035
  • Table 88: Middle East and Africa Market Volume (Units) Forecast by  Mode of Action, 2020-2035
  • Table 89: Middle East and Africa Market Value (USD Million) Forecast by  Source, 2020-2035
  • Table 90: Middle East and Africa Market Volume (Units) Forecast by  Source, 2020-2035
  • Table 91: Middle East and Africa Market Value (USD Million) Forecast by  Delivery System, 2020-2035
  • Table 92: Middle East and Africa Market Volume (Units) Forecast by  Delivery System, 2020-2035
  • Table 93: Middle East and Africa Market Value (USD Million) Forecast by  Physical Form, 2020-2035
  • Table 94: Middle East and Africa Market Volume (Units) Forecast by  Physical Form, 2020-2035
  • Table 95: Middle East and Africa Market Value (USD Million) Forecast by  Application, 2020-2035
  • Table 96: Middle East and Africa Market Volume (Units) Forecast by  Application, 2020-2035
  • Table 97: Middle East and Africa Market Value (USD Million) Forecast by  End Use, 2020-2035
  • Table 98: Middle East and Africa Market Volume (Units) Forecast by  End Use, 2020-2035

List of Figures

  • Figure 1: Global Market Value (USD Million) by  Mode of Action, 2025-2035
  • Figure 2: Global Market Value (USD Million) by  Source, 2025-2035
  • Figure 3: Global Market Value (USD Million) by  Delivery System, 2025-2035
  • Figure 4: Global Market Value (USD Million) by  Physical Form, 2025-2035
  • Figure 5: Global Market Value (USD Million) by  Application, 2025-2035
  • Figure 6: Global Market Value (USD Million) by  End Use, 2025-2035
  • Figure 7: Global Market Value (USD Million) by Region, 2025-2035
  • Figure 8: Global Market Value (USD Million) Analysis by Region, 2020-2035
  • Figure 9: Global Market Volume (Units) Analysis by Region, 2020-2035
  • Figure 10: Global Market Value Share (%) and BPS Analysis by Region, 2025-2035
  • Figure 11: Global Market Y-o-Y Growth (%) Projections by Region, 2025-2035
  • Figure 12: Global Market Value (USD Million) Analysis by  Mode of Action, 2020-2035
  • Figure 13: Global Market Volume (Units) Analysis by  Mode of Action, 2020-2035
  • Figure 14: Global Market Value Share (%) and BPS Analysis by  Mode of Action, 2025-2035
  • Figure 15: Global Market Y-o-Y Growth (%) Projections by  Mode of Action, 2025-2035
  • Figure 16: Global Market Value (USD Million) Analysis by  Source, 2020-2035
  • Figure 17: Global Market Volume (Units) Analysis by  Source, 2020-2035
  • Figure 18: Global Market Value Share (%) and BPS Analysis by  Source, 2025-2035
  • Figure 19: Global Market Y-o-Y Growth (%) Projections by  Source, 2025-2035
  • Figure 20: Global Market Value (USD Million) Analysis by  Delivery System, 2020-2035
  • Figure 21: Global Market Volume (Units) Analysis by  Delivery System, 2020-2035
  • Figure 22: Global Market Value Share (%) and BPS Analysis by  Delivery System, 2025-2035
  • Figure 23: Global Market Y-o-Y Growth (%) Projections by  Delivery System, 2025-2035
  • Figure 24: Global Market Value (USD Million) Analysis by  Physical Form, 2020-2035
  • Figure 25: Global Market Volume (Units) Analysis by  Physical Form, 2020-2035
  • Figure 26: Global Market Value Share (%) and BPS Analysis by  Physical Form, 2025-2035
  • Figure 27: Global Market Y-o-Y Growth (%) Projections by  Physical Form, 2025-2035
  • Figure 28: Global Market Value (USD Million) Analysis by  Application, 2020-2035
  • Figure 29: Global Market Volume (Units) Analysis by  Application, 2020-2035
  • Figure 30: Global Market Value Share (%) and BPS Analysis by  Application, 2025-2035
  • Figure 31: Global Market Y-o-Y Growth (%) Projections by  Application, 2025-2035
  • Figure 32: Global Market Value (USD Million) Analysis by  End Use, 2020-2035
  • Figure 33: Global Market Volume (Units) Analysis by  End Use, 2020-2035
  • Figure 34: Global Market Value Share (%) and BPS Analysis by  End Use, 2025-2035
  • Figure 35: Global Market Y-o-Y Growth (%) Projections by  End Use, 2025-2035
  • Figure 36: Global Market Attractiveness by  Mode of Action, 2025-2035
  • Figure 37: Global Market Attractiveness by  Source, 2025-2035
  • Figure 38: Global Market Attractiveness by  Delivery System, 2025-2035
  • Figure 39: Global Market Attractiveness by  Physical Form, 2025-2035
  • Figure 40: Global Market Attractiveness by  Application, 2025-2035
  • Figure 41: Global Market Attractiveness by  End Use, 2025-2035
  • Figure 42: Global Market Attractiveness by Region, 2025-2035
  • Figure 43: North America Market Value (USD Million) by  Mode of Action, 2025-2035
  • Figure 44: North America Market Value (USD Million) by  Source, 2025-2035
  • Figure 45: North America Market Value (USD Million) by  Delivery System, 2025-2035
  • Figure 46: North America Market Value (USD Million) by  Physical Form, 2025-2035
  • Figure 47: North America Market Value (USD Million) by  Application, 2025-2035
  • Figure 48: North America Market Value (USD Million) by  End Use, 2025-2035
  • Figure 49: North America Market Value (USD Million) by Country, 2025-2035
  • Figure 50: North America Market Value (USD Million) Analysis by Country, 2020-2035
  • Figure 51: North America Market Volume (Units) Analysis by Country, 2020-2035
  • Figure 52: North America Market Value Share (%) and BPS Analysis by Country, 2025-2035
  • Figure 53: North America Market Y-o-Y Growth (%) Projections by Country, 2025-2035
  • Figure 54: North America Market Value (USD Million) Analysis by  Mode of Action, 2020-2035
  • Figure 55: North America Market Volume (Units) Analysis by  Mode of Action, 2020-2035
  • Figure 56: North America Market Value Share (%) and BPS Analysis by  Mode of Action, 2025-2035
  • Figure 57: North America Market Y-o-Y Growth (%) Projections by  Mode of Action, 2025-2035
  • Figure 58: North America Market Value (USD Million) Analysis by  Source, 2020-2035
  • Figure 59: North America Market Volume (Units) Analysis by  Source, 2020-2035
  • Figure 60: North America Market Value Share (%) and BPS Analysis by  Source, 2025-2035
  • Figure 61: North America Market Y-o-Y Growth (%) Projections by  Source, 2025-2035
  • Figure 62: North America Market Value (USD Million) Analysis by  Delivery System, 2020-2035
  • Figure 63: North America Market Volume (Units) Analysis by  Delivery System, 2020-2035
  • Figure 64: North America Market Value Share (%) and BPS Analysis by  Delivery System, 2025-2035
  • Figure 65: North America Market Y-o-Y Growth (%) Projections by  Delivery System, 2025-2035
  • Figure 66: North America Market Value (USD Million) Analysis by  Physical Form, 2020-2035
  • Figure 67: North America Market Volume (Units) Analysis by  Physical Form, 2020-2035
  • Figure 68: North America Market Value Share (%) and BPS Analysis by  Physical Form, 2025-2035
  • Figure 69: North America Market Y-o-Y Growth (%) Projections by  Physical Form, 2025-2035
  • Figure 70: North America Market Value (USD Million) Analysis by  Application, 2020-2035
  • Figure 71: North America Market Volume (Units) Analysis by  Application, 2020-2035
  • Figure 72: North America Market Value Share (%) and BPS Analysis by  Application, 2025-2035
  • Figure 73: North America Market Y-o-Y Growth (%) Projections by  Application, 2025-2035
  • Figure 74: North America Market Value (USD Million) Analysis by  End Use, 2020-2035
  • Figure 75: North America Market Volume (Units) Analysis by  End Use, 2020-2035
  • Figure 76: North America Market Value Share (%) and BPS Analysis by  End Use, 2025-2035
  • Figure 77: North America Market Y-o-Y Growth (%) Projections by  End Use, 2025-2035
  • Figure 78: North America Market Attractiveness by  Mode of Action, 2025-2035
  • Figure 79: North America Market Attractiveness by  Source, 2025-2035
  • Figure 80: North America Market Attractiveness by  Delivery System, 2025-2035
  • Figure 81: North America Market Attractiveness by  Physical Form, 2025-2035
  • Figure 82: North America Market Attractiveness by  Application, 2025-2035
  • Figure 83: North America Market Attractiveness by  End Use, 2025-2035
  • Figure 84: North America Market Attractiveness by Country, 2025-2035
  • Figure 85: Latin America Market Value (USD Million) by  Mode of Action, 2025-2035
  • Figure 86: Latin America Market Value (USD Million) by  Source, 2025-2035
  • Figure 87: Latin America Market Value (USD Million) by  Delivery System, 2025-2035
  • Figure 88: Latin America Market Value (USD Million) by  Physical Form, 2025-2035
  • Figure 89: Latin America Market Value (USD Million) by  Application, 2025-2035
  • Figure 90: Latin America Market Value (USD Million) by  End Use, 2025-2035
  • Figure 91: Latin America Market Value (USD Million) by Country, 2025-2035
  • Figure 92: Latin America Market Value (USD Million) Analysis by Country, 2020-2035
  • Figure 93: Latin America Market Volume (Units) Analysis by Country, 2020-2035
  • Figure 94: Latin America Market Value Share (%) and BPS Analysis by Country, 2025-2035
  • Figure 95: Latin America Market Y-o-Y Growth (%) Projections by Country, 2025-2035
  • Figure 96: Latin America Market Value (USD Million) Analysis by  Mode of Action, 2020-2035
  • Figure 97: Latin America Market Volume (Units) Analysis by  Mode of Action, 2020-2035
  • Figure 98: Latin America Market Value Share (%) and BPS Analysis by  Mode of Action, 2025-2035
  • Figure 99: Latin America Market Y-o-Y Growth (%) Projections by  Mode of Action, 2025-2035
  • Figure 100: Latin America Market Value (USD Million) Analysis by  Source, 2020-2035
  • Figure 101: Latin America Market Volume (Units) Analysis by  Source, 2020-2035
  • Figure 102: Latin America Market Value Share (%) and BPS Analysis by  Source, 2025-2035
  • Figure 103: Latin America Market Y-o-Y Growth (%) Projections by  Source, 2025-2035
  • Figure 104: Latin America Market Value (USD Million) Analysis by  Delivery System, 2020-2035
  • Figure 105: Latin America Market Volume (Units) Analysis by  Delivery System, 2020-2035
  • Figure 106: Latin America Market Value Share (%) and BPS Analysis by  Delivery System, 2025-2035
  • Figure 107: Latin America Market Y-o-Y Growth (%) Projections by  Delivery System, 2025-2035
  • Figure 108: Latin America Market Value (USD Million) Analysis by  Physical Form, 2020-2035
  • Figure 109: Latin America Market Volume (Units) Analysis by  Physical Form, 2020-2035
  • Figure 110: Latin America Market Value Share (%) and BPS Analysis by  Physical Form, 2025-2035
  • Figure 111: Latin America Market Y-o-Y Growth (%) Projections by  Physical Form, 2025-2035
  • Figure 112: Latin America Market Value (USD Million) Analysis by  Application, 2020-2035
  • Figure 113: Latin America Market Volume (Units) Analysis by  Application, 2020-2035
  • Figure 114: Latin America Market Value Share (%) and BPS Analysis by  Application, 2025-2035
  • Figure 115: Latin America Market Y-o-Y Growth (%) Projections by  Application, 2025-2035
  • Figure 116: Latin America Market Value (USD Million) Analysis by  End Use, 2020-2035
  • Figure 117: Latin America Market Volume (Units) Analysis by  End Use, 2020-2035
  • Figure 118: Latin America Market Value Share (%) and BPS Analysis by  End Use, 2025-2035
  • Figure 119: Latin America Market Y-o-Y Growth (%) Projections by  End Use, 2025-2035
  • Figure 120: Latin America Market Attractiveness by  Mode of Action, 2025-2035
  • Figure 121: Latin America Market Attractiveness by  Source, 2025-2035
  • Figure 122: Latin America Market Attractiveness by  Delivery System, 2025-2035
  • Figure 123: Latin America Market Attractiveness by  Physical Form, 2025-2035
  • Figure 124: Latin America Market Attractiveness by  Application, 2025-2035
  • Figure 125: Latin America Market Attractiveness by  End Use, 2025-2035
  • Figure 126: Latin America Market Attractiveness by Country, 2025-2035
  • Figure 127: Europe Market Value (USD Million) by  Mode of Action, 2025-2035
  • Figure 128: Europe Market Value (USD Million) by  Source, 2025-2035
  • Figure 129: Europe Market Value (USD Million) by  Delivery System, 2025-2035
  • Figure 130: Europe Market Value (USD Million) by  Physical Form, 2025-2035
  • Figure 131: Europe Market Value (USD Million) by  Application, 2025-2035
  • Figure 132: Europe Market Value (USD Million) by  End Use, 2025-2035
  • Figure 133: Europe Market Value (USD Million) by Country, 2025-2035
  • Figure 134: Europe Market Value (USD Million) Analysis by Country, 2020-2035
  • Figure 135: Europe Market Volume (Units) Analysis by Country, 2020-2035
  • Figure 136: Europe Market Value Share (%) and BPS Analysis by Country, 2025-2035
  • Figure 137: Europe Market Y-o-Y Growth (%) Projections by Country, 2025-2035
  • Figure 138: Europe Market Value (USD Million) Analysis by  Mode of Action, 2020-2035
  • Figure 139: Europe Market Volume (Units) Analysis by  Mode of Action, 2020-2035
  • Figure 140: Europe Market Value Share (%) and BPS Analysis by  Mode of Action, 2025-2035
  • Figure 141: Europe Market Y-o-Y Growth (%) Projections by  Mode of Action, 2025-2035
  • Figure 142: Europe Market Value (USD Million) Analysis by  Source, 2020-2035
  • Figure 143: Europe Market Volume (Units) Analysis by  Source, 2020-2035
  • Figure 144: Europe Market Value Share (%) and BPS Analysis by  Source, 2025-2035
  • Figure 145: Europe Market Y-o-Y Growth (%) Projections by  Source, 2025-2035
  • Figure 146: Europe Market Value (USD Million) Analysis by  Delivery System, 2020-2035
  • Figure 147: Europe Market Volume (Units) Analysis by  Delivery System, 2020-2035
  • Figure 148: Europe Market Value Share (%) and BPS Analysis by  Delivery System, 2025-2035
  • Figure 149: Europe Market Y-o-Y Growth (%) Projections by  Delivery System, 2025-2035
  • Figure 150: Europe Market Value (USD Million) Analysis by  Physical Form, 2020-2035
  • Figure 151: Europe Market Volume (Units) Analysis by  Physical Form, 2020-2035
  • Figure 152: Europe Market Value Share (%) and BPS Analysis by  Physical Form, 2025-2035
  • Figure 153: Europe Market Y-o-Y Growth (%) Projections by  Physical Form, 2025-2035
  • Figure 154: Europe Market Value (USD Million) Analysis by  Application, 2020-2035
  • Figure 155: Europe Market Volume (Units) Analysis by  Application, 2020-2035
  • Figure 156: Europe Market Value Share (%) and BPS Analysis by  Application, 2025-2035
  • Figure 157: Europe Market Y-o-Y Growth (%) Projections by  Application, 2025-2035
  • Figure 158: Europe Market Value (USD Million) Analysis by  End Use, 2020-2035
  • Figure 159: Europe Market Volume (Units) Analysis by  End Use, 2020-2035
  • Figure 160: Europe Market Value Share (%) and BPS Analysis by  End Use, 2025-2035
  • Figure 161: Europe Market Y-o-Y Growth (%) Projections by  End Use, 2025-2035
  • Figure 162: Europe Market Attractiveness by  Mode of Action, 2025-2035
  • Figure 163: Europe Market Attractiveness by  Source, 2025-2035
  • Figure 164: Europe Market Attractiveness by  Delivery System, 2025-2035
  • Figure 165: Europe Market Attractiveness by  Physical Form, 2025-2035
  • Figure 166: Europe Market Attractiveness by  Application, 2025-2035
  • Figure 167: Europe Market Attractiveness by  End Use, 2025-2035
  • Figure 168: Europe Market Attractiveness by Country, 2025-2035
  • Figure 169: East Asia Market Value (USD Million) by  Mode of Action, 2025-2035
  • Figure 170: East Asia Market Value (USD Million) by  Source, 2025-2035
  • Figure 171: East Asia Market Value (USD Million) by  Delivery System, 2025-2035
  • Figure 172: East Asia Market Value (USD Million) by  Physical Form, 2025-2035
  • Figure 173: East Asia Market Value (USD Million) by  Application, 2025-2035
  • Figure 174: East Asia Market Value (USD Million) by  End Use, 2025-2035
  • Figure 175: East Asia Market Value (USD Million) by Country, 2025-2035
  • Figure 176: East Asia Market Value (USD Million) Analysis by Country, 2020-2035
  • Figure 177: East Asia Market Volume (Units) Analysis by Country, 2020-2035
  • Figure 178: East Asia Market Value Share (%) and BPS Analysis by Country, 2025-2035
  • Figure 179: East Asia Market Y-o-Y Growth (%) Projections by Country, 2025-2035
  • Figure 180: East Asia Market Value (USD Million) Analysis by  Mode of Action, 2020-2035
  • Figure 181: East Asia Market Volume (Units) Analysis by  Mode of Action, 2020-2035
  • Figure 182: East Asia Market Value Share (%) and BPS Analysis by  Mode of Action, 2025-2035
  • Figure 183: East Asia Market Y-o-Y Growth (%) Projections by  Mode of Action, 2025-2035
  • Figure 184: East Asia Market Value (USD Million) Analysis by  Source, 2020-2035
  • Figure 185: East Asia Market Volume (Units) Analysis by  Source, 2020-2035
  • Figure 186: East Asia Market Value Share (%) and BPS Analysis by  Source, 2025-2035
  • Figure 187: East Asia Market Y-o-Y Growth (%) Projections by  Source, 2025-2035
  • Figure 188: East Asia Market Value (USD Million) Analysis by  Delivery System, 2020-2035
  • Figure 189: East Asia Market Volume (Units) Analysis by  Delivery System, 2020-2035
  • Figure 190: East Asia Market Value Share (%) and BPS Analysis by  Delivery System, 2025-2035
  • Figure 191: East Asia Market Y-o-Y Growth (%) Projections by  Delivery System, 2025-2035
  • Figure 192: East Asia Market Value (USD Million) Analysis by  Physical Form, 2020-2035
  • Figure 193: East Asia Market Volume (Units) Analysis by  Physical Form, 2020-2035
  • Figure 194: East Asia Market Value Share (%) and BPS Analysis by  Physical Form, 2025-2035
  • Figure 195: East Asia Market Y-o-Y Growth (%) Projections by  Physical Form, 2025-2035
  • Figure 196: East Asia Market Value (USD Million) Analysis by  Application, 2020-2035
  • Figure 197: East Asia Market Volume (Units) Analysis by  Application, 2020-2035
  • Figure 198: East Asia Market Value Share (%) and BPS Analysis by  Application, 2025-2035
  • Figure 199: East Asia Market Y-o-Y Growth (%) Projections by  Application, 2025-2035
  • Figure 200: East Asia Market Value (USD Million) Analysis by  End Use, 2020-2035
  • Figure 201: East Asia Market Volume (Units) Analysis by  End Use, 2020-2035
  • Figure 202: East Asia Market Value Share (%) and BPS Analysis by  End Use, 2025-2035
  • Figure 203: East Asia Market Y-o-Y Growth (%) Projections by  End Use, 2025-2035
  • Figure 204: East Asia Market Attractiveness by  Mode of Action, 2025-2035
  • Figure 205: East Asia Market Attractiveness by  Source, 2025-2035
  • Figure 206: East Asia Market Attractiveness by  Delivery System, 2025-2035
  • Figure 207: East Asia Market Attractiveness by  Physical Form, 2025-2035
  • Figure 208: East Asia Market Attractiveness by  Application, 2025-2035
  • Figure 209: East Asia Market Attractiveness by  End Use, 2025-2035
  • Figure 210: East Asia Market Attractiveness by Country, 2025-2035
  • Figure 211: South Asia & Pacific Market Value (USD Million) by  Mode of Action, 2025-2035
  • Figure 212: South Asia & Pacific Market Value (USD Million) by  Source, 2025-2035
  • Figure 213: South Asia & Pacific Market Value (USD Million) by  Delivery System, 2025-2035
  • Figure 214: South Asia & Pacific Market Value (USD Million) by  Physical Form, 2025-2035
  • Figure 215: South Asia & Pacific Market Value (USD Million) by  Application, 2025-2035
  • Figure 216: South Asia & Pacific Market Value (USD Million) by  End Use, 2025-2035
  • Figure 217: South Asia & Pacific Market Value (USD Million) by Country, 2025-2035
  • Figure 218: South Asia & Pacific Market Value (USD Million) Analysis by Country, 2020-2035
  • Figure 219: South Asia & Pacific Market Volume (Units) Analysis by Country, 2020-2035
  • Figure 220: South Asia & Pacific Market Value Share (%) and BPS Analysis by Country, 2025-2035
  • Figure 221: South Asia & Pacific Market Y-o-Y Growth (%) Projections by Country, 2025-2035
  • Figure 222: South Asia & Pacific Market Value (USD Million) Analysis by  Mode of Action, 2020-2035
  • Figure 223: South Asia & Pacific Market Volume (Units) Analysis by  Mode of Action, 2020-2035
  • Figure 224: South Asia & Pacific Market Value Share (%) and BPS Analysis by  Mode of Action, 2025-2035
  • Figure 225: South Asia & Pacific Market Y-o-Y Growth (%) Projections by  Mode of Action, 2025-2035
  • Figure 226: South Asia & Pacific Market Value (USD Million) Analysis by  Source, 2020-2035
  • Figure 227: South Asia & Pacific Market Volume (Units) Analysis by  Source, 2020-2035
  • Figure 228: South Asia & Pacific Market Value Share (%) and BPS Analysis by  Source, 2025-2035
  • Figure 229: South Asia & Pacific Market Y-o-Y Growth (%) Projections by  Source, 2025-2035
  • Figure 230: South Asia & Pacific Market Value (USD Million) Analysis by  Delivery System, 2020-2035
  • Figure 231: South Asia & Pacific Market Volume (Units) Analysis by  Delivery System, 2020-2035
  • Figure 232: South Asia & Pacific Market Value Share (%) and BPS Analysis by  Delivery System, 2025-2035
  • Figure 233: South Asia & Pacific Market Y-o-Y Growth (%) Projections by  Delivery System, 2025-2035
  • Figure 234: South Asia & Pacific Market Value (USD Million) Analysis by  Physical Form, 2020-2035
  • Figure 235: South Asia & Pacific Market Volume (Units) Analysis by  Physical Form, 2020-2035
  • Figure 236: South Asia & Pacific Market Value Share (%) and BPS Analysis by  Physical Form, 2025-2035
  • Figure 237: South Asia & Pacific Market Y-o-Y Growth (%) Projections by  Physical Form, 2025-2035
  • Figure 238: South Asia & Pacific Market Value (USD Million) Analysis by  Application, 2020-2035
  • Figure 239: South Asia & Pacific Market Volume (Units) Analysis by  Application, 2020-2035
  • Figure 240: South Asia & Pacific Market Value Share (%) and BPS Analysis by  Application, 2025-2035
  • Figure 241: South Asia & Pacific Market Y-o-Y Growth (%) Projections by  Application, 2025-2035
  • Figure 242: South Asia & Pacific Market Value (USD Million) Analysis by  End Use, 2020-2035
  • Figure 243: South Asia & Pacific Market Volume (Units) Analysis by  End Use, 2020-2035
  • Figure 244: South Asia & Pacific Market Value Share (%) and BPS Analysis by  End Use, 2025-2035
  • Figure 245: South Asia & Pacific Market Y-o-Y Growth (%) Projections by  End Use, 2025-2035
  • Figure 246: South Asia & Pacific Market Attractiveness by  Mode of Action, 2025-2035
  • Figure 247: South Asia & Pacific Market Attractiveness by  Source, 2025-2035
  • Figure 248: South Asia & Pacific Market Attractiveness by  Delivery System, 2025-2035
  • Figure 249: South Asia & Pacific Market Attractiveness by  Physical Form, 2025-2035
  • Figure 250: South Asia & Pacific Market Attractiveness by  Application, 2025-2035
  • Figure 251: South Asia & Pacific Market Attractiveness by  End Use, 2025-2035
  • Figure 252: South Asia & Pacific Market Attractiveness by Country, 2025-2035
  • Figure 253: Middle East and Africa Market Value (USD Million) by  Mode of Action, 2025-2035
  • Figure 254: Middle East and Africa Market Value (USD Million) by  Source, 2025-2035
  • Figure 255: Middle East and Africa Market Value (USD Million) by  Delivery System, 2025-2035
  • Figure 256: Middle East and Africa Market Value (USD Million) by  Physical Form, 2025-2035
  • Figure 257: Middle East and Africa Market Value (USD Million) by  Application, 2025-2035
  • Figure 258: Middle East and Africa Market Value (USD Million) by  End Use, 2025-2035
  • Figure 259: Middle East and Africa Market Value (USD Million) by Country, 2025-2035
  • Figure 260: Middle East and Africa Market Value (USD Million) Analysis by Country, 2020-2035
  • Figure 261: Middle East and Africa Market Volume (Units) Analysis by Country, 2020-2035
  • Figure 262: Middle East and Africa Market Value Share (%) and BPS Analysis by Country, 2025-2035
  • Figure 263: Middle East and Africa Market Y-o-Y Growth (%) Projections by Country, 2025-2035
  • Figure 264: Middle East and Africa Market Value (USD Million) Analysis by  Mode of Action, 2020-2035
  • Figure 265: Middle East and Africa Market Volume (Units) Analysis by  Mode of Action, 2020-2035
  • Figure 266: Middle East and Africa Market Value Share (%) and BPS Analysis by  Mode of Action, 2025-2035
  • Figure 267: Middle East and Africa Market Y-o-Y Growth (%) Projections by  Mode of Action, 2025-2035
  • Figure 268: Middle East and Africa Market Value (USD Million) Analysis by  Source, 2020-2035
  • Figure 269: Middle East and Africa Market Volume (Units) Analysis by  Source, 2020-2035
  • Figure 270: Middle East and Africa Market Value Share (%) and BPS Analysis by  Source, 2025-2035
  • Figure 271: Middle East and Africa Market Y-o-Y Growth (%) Projections by  Source, 2025-2035
  • Figure 272: Middle East and Africa Market Value (USD Million) Analysis by  Delivery System, 2020-2035
  • Figure 273: Middle East and Africa Market Volume (Units) Analysis by  Delivery System, 2020-2035
  • Figure 274: Middle East and Africa Market Value Share (%) and BPS Analysis by  Delivery System, 2025-2035
  • Figure 275: Middle East and Africa Market Y-o-Y Growth (%) Projections by  Delivery System, 2025-2035
  • Figure 276: Middle East and Africa Market Value (USD Million) Analysis by  Physical Form, 2020-2035
  • Figure 277: Middle East and Africa Market Volume (Units) Analysis by  Physical Form, 2020-2035
  • Figure 278: Middle East and Africa Market Value Share (%) and BPS Analysis by  Physical Form, 2025-2035
  • Figure 279: Middle East and Africa Market Y-o-Y Growth (%) Projections by  Physical Form, 2025-2035
  • Figure 280: Middle East and Africa Market Value (USD Million) Analysis by  Application, 2020-2035
  • Figure 281: Middle East and Africa Market Volume (Units) Analysis by  Application, 2020-2035
  • Figure 282: Middle East and Africa Market Value Share (%) and BPS Analysis by  Application, 2025-2035
  • Figure 283: Middle East and Africa Market Y-o-Y Growth (%) Projections by  Application, 2025-2035
  • Figure 284: Middle East and Africa Market Value (USD Million) Analysis by  End Use, 2020-2035
  • Figure 285: Middle East and Africa Market Volume (Units) Analysis by  End Use, 2020-2035
  • Figure 286: Middle East and Africa Market Value Share (%) and BPS Analysis by  End Use, 2025-2035
  • Figure 287: Middle East and Africa Market Y-o-Y Growth (%) Projections by  End Use, 2025-2035
  • Figure 288: Middle East and Africa Market Attractiveness by  Mode of Action, 2025-2035
  • Figure 289: Middle East and Africa Market Attractiveness by  Source, 2025-2035
  • Figure 290: Middle East and Africa Market Attractiveness by  Delivery System, 2025-2035
  • Figure 291: Middle East and Africa Market Attractiveness by  Physical Form, 2025-2035
  • Figure 292: Middle East and Africa Market Attractiveness by  Application, 2025-2035
  • Figure 293: Middle East and Africa Market Attractiveness by  End Use, 2025-2035
  • Figure 294: Middle East and Africa Market Attractiveness by Country, 2025-2035

Frequently Asked Questions

How big is the Anti-Stretch Marks Agents Market in 2025?

The global Anti-Stretch Marks Agents Market is estimated to be valued at USD 1,402.1 million in 2025.

What will be the size of the Anti-Stretch Marks Agents Market in 2035?

The market size for the Anti-Stretch Marks Agents Market is projected to reach USD 3,102.3 million by 2035.

How much will be the Anti-Stretch Marks Agents Market growth between 2025 and 2035?

The Anti-Stretch Marks Agents Market is expected to grow at a CAGR of 8.3% between 2025 and 2035.

What are the key product types in the Anti-Stretch Marks Agents Market?

The key product types in the Anti-Stretch Marks Agents Market include elasticity & firmness boosters, collagen remodeling enhancers, barrier & lipid replenishment systems, and microcirculation & tissue support agents.

Which segment is expected to contribute significant share in the Anti-Stretch Marks Agents Market in 2025?

In terms of delivery system, the encapsulated segment is expected to command 44% share in the Anti-Stretch Marks Agents Market in 2025.

Explore Similar Insights

Future Market Insights

Anti-Stretch Marks Agents Market

Chat With

MaRIA

Hi There, I am MaRIA, Your Market Research Intelligence Assistant. How may I help you?