Antioxidant Premix Market Size and Share Forecast Outlook 2025 to 2035

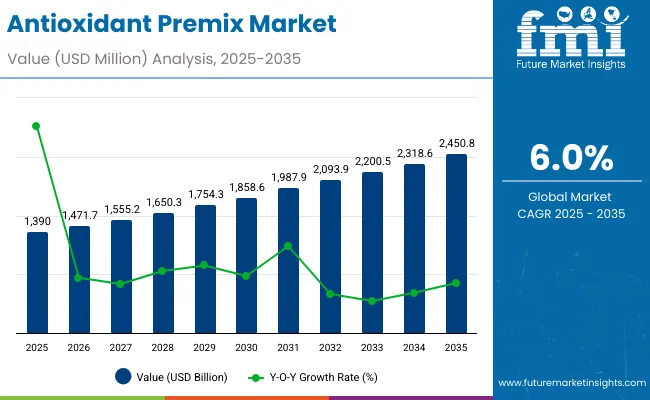
A valuation of USD 1.39 Billion is projected for the Antioxidants Premix Market in 2025, with expansion expected to reach USD 2.49 Billion by 2035. This growth reflects an absolute increase of over USD 1.15 Billion across the decade, representing a compound annual growth rate (CAGR) of 6.0%. The trajectory signals more than a more than a 1.79X enlargement in overall market size within the forecast horizon.
Quick Stats for Antioxidant Premix Market

  • Antioxidants Premix Market Value (2025): USD 1.39 Billion
  • Antioxidants Premix Market Forecast Value (2035): USD 2.49 Billion
  • Antioxidants Premix Market Forecast CAGR (2025 to 2035): 6.0%
  • Leading Segment in 2025: Natural Antioxidants (72%)
  • Key Growth Regions: North America, South Asia & Pacific, Europe
  • Top Key Players in Antioxidants Premix Market: DSM Nutritional Products, BASF SE, Archer Daniels Midland Company (ADM), Glanbia Nutritionals, Barentz International, Vitablend, Prinova Group, Watson Inc.

Antioxidant Premix Market

Metrics Value
Antioxidant Premix Market Estimated Value in (2025E) USD 1.39 Billion
Antioxidant Premix Market Forecast Value in (2035F) USD 2.49 Billion
Forecast CAGR (2025 to 2035) 6.0%

During the initial phase from 2025 to 2030, the market is forecast to advance from USD 1.39 Billion to USD 1.86 Billion, adding nearly USD 0.48 Billion, equal to about 42% of the total decade expansion. This stage is anticipated to be shaped by greater adoption of natural antioxidant blends in food and beverage applications, where shelf-life extension and stability assurance remain central. Natural antioxidants, commanding a 72% share in 2025, are positioned to anchor growth momentum, while powders are set to maintain their lead with a 45% share.

In the latter half from 2030 to 2035, acceleration is expected as valuations rise from USD 1.86 Billion to USD 2.49 Billion, adding USD 0.63 Billion or 58% of total growth. This period is projected to be reinforced by strong dietary supplement demand, where sports nutrition and geriatric formulations are set to expand above market average. Cosmetics and personal care are also anticipated to strengthen their contribution, supported by anti-aging and skin care segments growing at over 7.3% CAGR.

Between 2020 and 2024, the Antioxidants Premix Market expanded steadily, supported by food and beverage manufacturers adopting premixes to achieve consistent shelf-life extension and reduce oxidative stress in processed products. During this period, global suppliers dominated, controlling the majority of industry revenues by leveraging wide ingredient portfolios and strong distribution networks. Differentiation was largely based on formulation consistency, regulatory compliance, and cost efficiency, while online ingredient marketplaces and direct-to-brand services remained in their infancy, contributing minimally to total value.

Demand is forecast to reach USD 1.39 Billion in 2025, and the revenue structure is expected to shift as dietary supplements and cosmetics accelerate. Traditional premix leaders are projected to face rising competition from regional suppliers offering plant-extract based formulations with clean-label positioning. Leading incumbents are anticipated to pivot toward hybrid models by integrating encapsulation technologies, stability testing services, and digital ordering platforms to retain their relevance. Emerging participants focusing on polyphenol and carotenoid innovation are forecast to gain share, particularly in Asia-Pacific where demand for functional nutrition and beauty-from-within supplements is expanding rapidly. Competitive advantage is expected to move away from cost-driven supply alone toward end-to-end ecosystem strength, combining scientific validation, regulatory assurance, and recurring contract-based supply models

Why the Antioxidant Premix Market is growing?

Growth in the Antioxidants Premix Market is being is being supported by shelf-life targets and oxidative stability requirements across food, beverage, supplement, and cosmetic applications. Increased consumer awareness regarding immune health, anti-aging, and chronic disease prevention has been translated into higher usage of natural antioxidants such as vitamin C, vitamin E, carotenoids, and polyphenols within premix formulations.

A shift toward natural and clean-label solutions is being reinforced by regulatory scrutiny of synthetic antioxidants, encouraging manufacturers to prioritize safer, plant-extract-based blends. Demand for dietary supplements, particularly in sports nutrition and geriatric health, is accelerating the adoption of specialized antioxidant premixes. Cosmetics and personal care sectors are integrating premixes for anti-aging and skin protection benefits, further supporting momentum. Technological advances in encapsulation and micro-delivery systems are enabling greater bioavailability and stability, ensuring long-term application viability. Collectively, these forces are positioning antioxidant premixes as strategic components in global nutrition and wellness innovation.

Segmental Analysis

The Antioxidants Premix Market has been segmented across ingredient type, form, application, functionality, end-user, distribution channel, and region. Each category reflects the diverse adoption pathways and performance priorities driving demand across industries. Ingredient type segmentation highlights the rising prominence of natural antioxidants such as vitamins, carotenoids, and polyphenols, while synthetic variants continue to serve cost-sensitive uses.

By form, powders remain widely utilized for formulation flexibility, though encapsulated formats are advancing quickly due to enhanced stability and bioavailability. Applications span food and beverages, animal feed, dietary supplements, pharmaceuticals, and cosmetics, each representing unique demand drivers. This segmentation framework provides a comprehensive lens into evolving market preferences, offering clarity on where growth opportunities are concentrated over the 2025-2035 forecast horizon.
Insights into Ingredient Type Segment with Natural Antioxidants Leading

Antioxidant Premix Market By Ingrediant

Ingredient Type Market Value Share, 2025
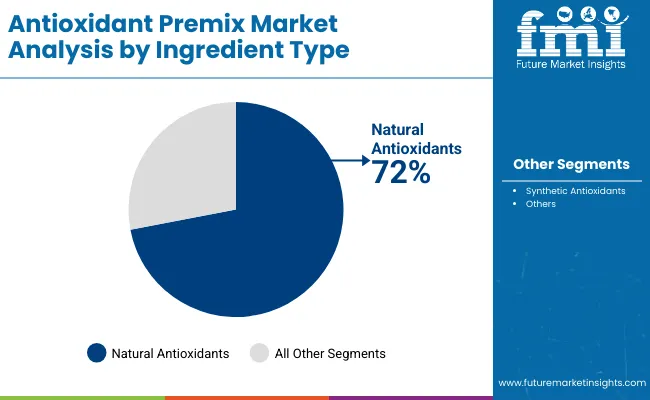
Natural Antioxidants 72%
Synthetic Antioxidants 28%

Natural antioxidants are projected to dominate with a 72% share of the market in 2025, outpacing synthetic alternatives due to rising health awareness and regulatory scrutiny over chemical additives. Growth will be driven by consumer preference for vitamin C, vitamin E, carotenoids, and plant-derived extracts, each offering functional and clean-label advantages. A CAGR of 6.8% is anticipated for natural antioxidants through 2035, making them the leading growth engine of the category. Synthetic antioxidants, while still relevant for cost-sensitive formulations, are expected to grow more moderately at 5.4%. As transparency and safety documentation gain importance, natural antioxidants are expected to solidify their role as the backbone of premix innovation, with applications stretching from fortified foods to nutraceuticals and skincare.
Insights into Form Segment with Powder Remaining the Dominant Choice

Antioxidant Premix Market By Form

Form Market Value Share, 2025
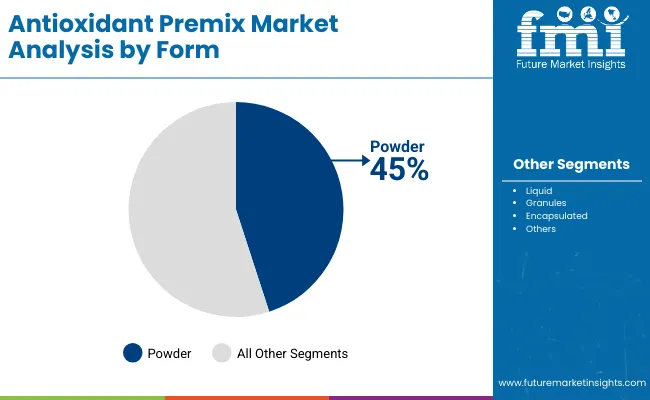
Powder 45%
Liquid 25%
Granules 18%
Encapsulated 1 2%

Powders are forecast to maintain their lead with a 45% market share in 2025, favored for their compatibility with a wide range of formulations in food, feed, and supplements. Their longer shelf-life, ease of storage, and ability to blend consistently across applications make powders the preferred format for manufacturers. While powders dominate, encapsulated formats are projected to record the fastest CAGR of 7.3%, driven by technological advancements that improve antioxidant stability and targeted release. Liquids and granules will continue to serve specialized uses, yet powders will remain the most scalable and cost-effective solution. As personalized nutrition and advanced formulations expand, encapsulated solutions are expected to complement powders, creating a dual pathway of dominance and innovation within the segment.
Insights into Application Segment with Food & Beverages Holding Leadership

Antioxidant Premix Market By Application

Application Market Value Share, 2025
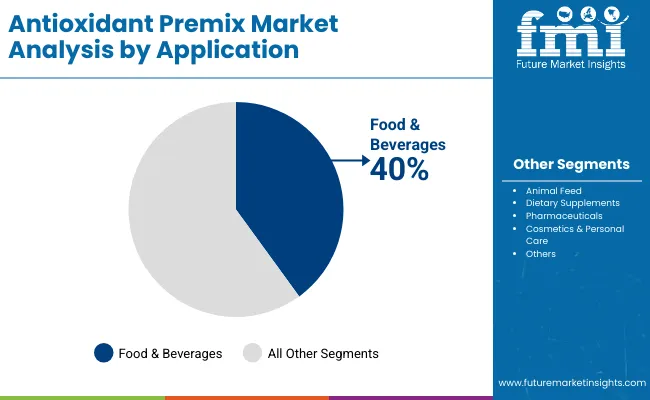
Food & Beverages 40%
Animal Feed 22%
Dietary Supplements 20%
Pharmaceuticals: 8%
Cosmetics & Personal Care 10%

The food and beverages segment is anticipated to lead with a 40% share in 2025, supported by continuous demand for shelf-life extension, flavor preservation, and nutritional fortification. Bakery, meat, dairy, and beverage applications will sustain demand, reinforced by rising consumption of packaged and convenience foods. Dietary supplements are expected to post faster growth at a CAGR of 7.2%, particularly within sports nutrition and geriatric health. Cosmetics and personal care, though smaller at 10% share, are projected to expand at 7.5%, making them a high-potential growth avenue. As functional foods and personalized supplements accelerate globally, applications in nutrition and beauty are expected to increasingly complement the dominance of traditional food and beverage uses.

What are the Drivers, Restraints, and Key Trends of the Antioxidant Premix Market?

Regulatory shifts, evolving consumer expectations, and formulation innovation are reshaping the Antioxidants Premix Market. While clean-label preferences and preventive health awareness support expansion, compliance costs, synthetic scrutiny, and complex raw material supply networks introduce barriers that companies must strategically navigate through 2035.

Integration into Preventive Healthcare and Nutraceutical Platforms

The Antioxidants Premix Market is being reinforced by integration into preventive healthcare frameworks, where premixes are positioned as enablers of long-term wellness. Health systems and insurers are increasingly emphasizing preventive nutrition to reduce chronic disease burdens, encouraging supplement and fortified food manufacturers to embed antioxidant premixes into their offerings. Multivitamin complexes, geriatric formulations, and immune-support blends are forecast to gain stronger adoption under this paradigm, backed by rising clinical validation for polyphenols, carotenoids, and tocopherols. As digital health platforms expand, premixes with measurable health claims and biomarker-linked evidence are expected to become a strategic differentiator across nutraceutical and functional food portfolios.

Regulatory Tightening on Synthetic Antioxidant Classes

Market growth is being constrained by intensifying regulatory scrutiny surrounding synthetic antioxidant classes such as BHA, BHT, TBHQ, and propyl gallate. Food safety agencies across North America and Europe are re-evaluating additive thresholds, requiring extensive documentation, toxicological data, and safety dossiers from manufacturers. This process elevates compliance costs and lengthens approval cycles, thereby discouraging smaller entrants and slowing reformulation timelines for multinational brands. Consumer advocacy groups and NGO campaigns have further heightened reputational risks, creating pressure on brands to accelerate the transition toward natural antioxidant premixes. This regulatory tightening is anticipated to reshape portfolio strategies, favoring plant-derived and encapsulated alternatives.
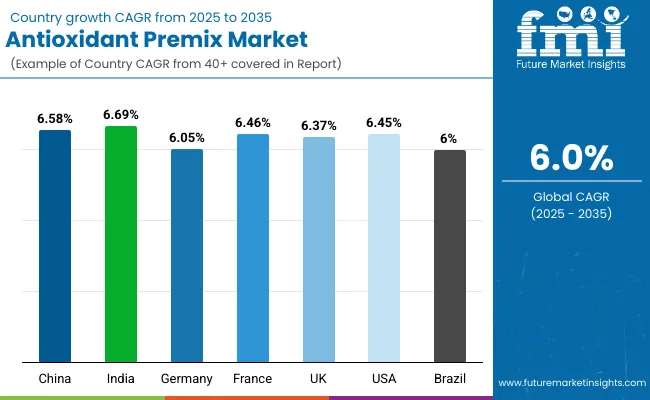
Analysis of Antioxidant Premix Market By Key Countries

Antioxidant Premix Market By Country

Country CAGR
China 6.58%
India 6.69%
Germany 6.05%
France 6.46%
UK 6.37%
USA 6.45%
Brazil 6.00%

A varied country trajectory is observed for the Antioxidants Premix Market, reflecting regulatory stance, nutrition transitions, and category sophistication. Asia’s momentum is projected to be led by India (6.69% CAGR) and China (6.58%), where fortified foods, sports nutrition, and beauty‑from‑within formats are expected to scale under supportive policy and expanding retail distribution. The United States is anticipated to advance at 6.45% CAGR, with steady uptake across food, supplements, and cosmetics as natural premix architectures and encapsulated delivery gain prominence.

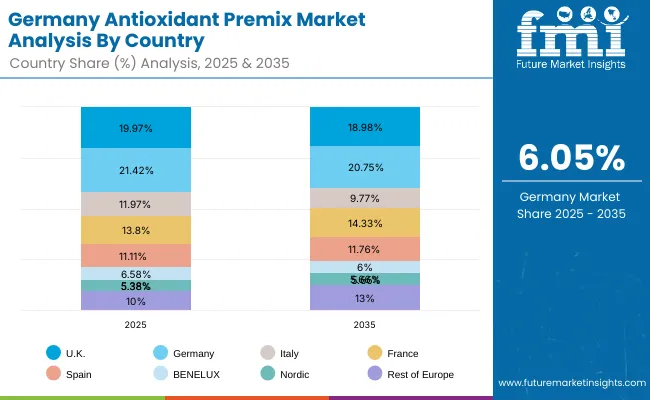
Europe is set to remain a high‑value hub; however, intra‑regional share is forecast to rebalance by 2035 France, Spain, Nordic markets, and “Rest of Europe” are expected to gain mix, while Germany, the UK, Italy, and BENELUX are projected to cede share as reformulation cycles mature and demand broadens eastward and southward. Brazil’s 6.00% CAGR positions it as Latin America’s anchor, aided by organized retail penetration and feed premix usage. Regionally, North America (30% share) and Europe (28%) will continue to concentrate value, while South Asia & Pacific (25%) is expected to contribute a rising portion of incremental growth. Across countries, documentation strength, clean‑label positioning, and application‑level efficacy are projected to determine competitive advantage through 2035.
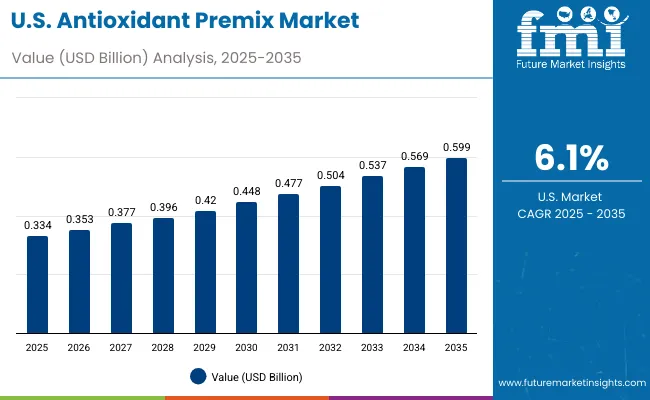
Sales Outlook for Antioxidant Premix in the United States

Antioxidant Premix Market Usa

Year USA Mushroom-Based Snack Market (USD Million)
2025 333.60
2026 352.8
2027 374.8
2028 395.2
2029 418.3
2030 444.9
2031 472.5
2032 497.3
2033 532.1
2034 566.0
2035 602.4

The antioxidant premix market in the United States is forecasted to grow from USD 333.6 Million in 2025 to USD 602.4 Million by 2035, reflecting a CAGR of 6.1%. Growth momentum is expected to remain steady, with annual increases ranging from 5.2% to 7.0%, demonstrating resilience across end-use sectors.

The expansion is being driven by higher utilization of antioxidant premixes in functional foods, dietary supplements, and fortified beverages, where preventive healthcare and immunity enhancement are prioritized by consumers. Demand in the animal nutrition sector is projected to strengthen, as feed manufacturers focus on extending shelf life, improving palatability, and ensuring livestock health. The cosmetic and personal care industry is also expected to integrate antioxidant premixes at a faster pace, aligning with rising consumer preference for clean-label and anti-aging formulations.

A transition toward customized premix solutions tailored for sports nutrition, geriatric health, and pediatric applications is anticipated, as manufacturers emphasize product differentiation. Strategic collaborations between premix formulators and food manufacturers are expected to improve market penetration. By 2035, the United States is projected to remain a pivotal market, supported by regulatory frameworks encouraging food fortification and preventive health solutions.

  • Functional foods and supplements will remain the largest application area.
  • Animal feed fortification is set to accelerate adoption.
  • Clean-label and anti-aging trends will drive demand in cosmetics and personal care.

Growth and Expansion Outlook for Antioxidant Premix Market in the United Kingdom

The antioxidant premix market in the United Kingdom is expected to advance at a CAGR of 6.37% between 2025 and 2035, supported by rising consumer emphasis on functional nutrition and healthy aging. A surge in fortified food and beverage launches is anticipated, aligned with regulatory support for reducing lifestyle-related diseases. Demand is expected to be reinforced by the sports nutrition sector, where antioxidant premixes are integrated for recovery and endurance. The cosmetics and personal care market is forecasted to experience significant adoption, as antioxidant-based formulations align with clean-label and sustainability trends. By 2035, the UK is projected to remain a leading European hub for antioxidant innovation, particularly in personalized nutrition and nutraceutical solutions.

  • Growth reinforced by fortified food adoption in daily diets.
  • Expanding demand in sports and lifestyle nutrition.
  • Cosmetics sector driving antioxidant-based skincare.
  • Regulatory mandates accelerating clean-label fortification.

Growth and Expansion Outlook for Antioxidant Premix Market in India

The antioxidant premix market in India is projected to grow at the highest CAGR of 6.69% from 2025 to 2035, reflecting increasing awareness of preventive health and government-backed food fortification programs. The integration of antioxidant premixes in staples such as flour, rice, and dairy is anticipated to expand, driven by national nutrition missions. Rapid urbanization and rising disposable incomes are expected to accelerate demand for dietary supplements and functional beverages. The animal nutrition sector is also projected to benefit significantly, with premixes used to improve feed efficiency and animal health. By 2035, India is forecasted to be a key growth engine in Asia-Pacific, with tailored premixes targeting both pediatric and geriatric populations.

  • Food fortification supported by government initiatives.
  • Functional beverages gaining traction in urban centers.
  • Rising demand in animal feed and livestock health.
  • Custom premix blends driving pediatric and geriatric nutrition.

Sales Outlook for Antioxidant Premix in China

The antioxidant premix market in China is forecasted to expand at a CAGR of 6.58% between 2025 and 2035, sustained by rising demand across fortified foods, nutraceuticals, and beverages. Growing consumer focus on immunity and preventive healthcare is expected to accelerate adoption. The feed industry is anticipated to generate substantial opportunities, as antioxidant premixes are increasingly used to improve poultry and aquaculture productivity. The cosmetics market is projected to integrate antioxidant-based formulations at scale, aligning with the popularity of natural and anti-aging solutions. By 2035, China is likely to retain its position as the largest market in Asia-Pacific, supported by innovation in customized premix solutions and strategic collaborations with domestic FMCG players.
  • Food and beverage fortification gaining mass-market acceptance.
  • Feed premixes vital for poultry and aquaculture growth.
  • Cosmetics and skincare expanding antioxidant usage.
  • Strong domestic ecosystem fostering innovative blends.

In-depth Analysis of Antioxidant Premix in Germany

Antioxidant Premix Market Germany

Countries 2025
UK 19.97%
Germany 21.42%
Italy 11.97%
France 13.80%
Spain 11.11%
BENELUX 6.58%
Nordic 5.38%
Rest of Europe 10%
Countries 2035
UK 18.98%
Germany 20.75%
Italy 9.77%
France 14.33%
Spain 11.76%
BENELUX 6.00%
Nordic 5.66%
Rest of Europe 13%

The antioxidant premix market in Germany is expected to advance at a CAGR of 6.05% between 2025 and 2035, supported by strong adoption in functional foods and clinical nutrition. Regulatory emphasis on quality and food safety is anticipated to foster greater use of antioxidant premixes across fortified dairy, bakery, and beverages. The nutraceutical industry is projected to expand rapidly, with antioxidants used for cardiovascular, cognitive, and metabolic health solutions. The personal care industry is also expected to increase utilization of premixes, particularly in anti-aging skincare formulations. By 2035, Germany is forecasted to remain a pillar of Europe’s antioxidant premix demand, driven by innovation, compliance, and consumer trust.
  • Regulatory framework reinforcing fortified product growth.
  • Clinical nutrition and nutraceuticals accelerating demand.
  • Expanding role in anti-aging personal care solutions.
  • Positioned as a European leader in antioxidant innovation.

Growth Outlook for Antioxidant Premix Market in Japan

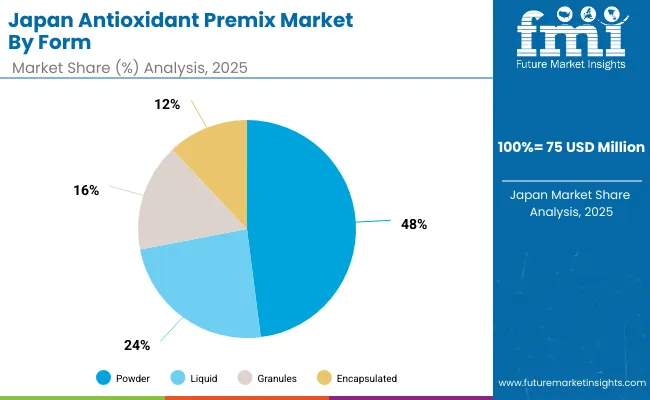
Antioxidant Premix Market Japan

Range Segment Market Value Share, 2025
Powder 48%
Liquid 24%
Granules 16%
Encapsulated 12%

The Antioxidant Premix Market in Japan is projected at USD 75 Million in 2025, contributing nearly 5.4% of global sales. Powder form dominates with a 48% share, reflecting strong integration into fortified foods, sports nutrition, and dietary supplements. Liquid formats represent 24%, supported by adoption in functional beverages, while granules account for 16%, used mainly in livestock and aqua feed applications. Encapsulated premixes, though only 12% in 2025, are expected to grow fastest at a 7.0% CAGR, driven by demand for enhanced bioavailability and precision delivery in health supplements. Japan’s aging population and preference for natural antioxidants such as green tea extracts and carotenoids are anticipated to reinforce long-term uptake. By 2035, the market is estimated to reach USD 135-140 Million, with encapsulated innovations and personalized nutrition platforms expected to reshape competitive dynamics.
  • Japan is projected to account for ~5.4% of global share in 2025.
  • Powder leads at 48%, but encapsulated grows fastest (7.0% CAGR).
  • Functional foods and supplements remain the primary growth drivers.
  • Personalized nutrition and bioavailability-focused innovations to accelerate demand.

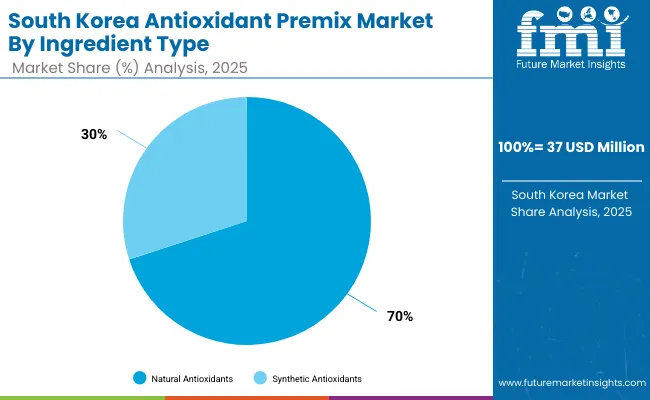
Opportunity Analysis of South Korea Antioxidant Premix Market

Antioxidant Premix Market South Korea

Component Segment Market Value Share, 2025
Natural Antioxidants 70%
Synthetic Antioxidants 30%

The Antioxidant Premix Market in South Korea is projected at USD 37 Million in 2025, representing ~2.7% of global sales. Natural antioxidants dominate with a 70% share, supported by strong consumer affinity for clean-label nutrition and plant-based solutions. Polyphenols (14%) and plant extracts (14%) are gaining traction, driven by functional beverages, skincare formulations, and fortified dietary supplements. Synthetic antioxidants account for 30%, with TBHQ (9%) leading due to its application in processed foods and edible oils. While synthetic antioxidants remain cost-effective, their long-term share is expected to decline as regulatory scrutiny and consumer health concerns intensify. The market is projected to expand to USD ~72 Million by 2035, with encapsulated natural blends and advanced delivery systems expected to capture incremental demand. South Korea’s innovation in beauty-from-within products and functional foods positions the country as a trend-setter in antioxidant-based wellness.
  • South Korea expected to hold ~2.7% global share in 2025.
  • Natural antioxidants dominate at 70%, led by polyphenols and plant extracts.
  • Synthetic antioxidants (30%) face gradual decline due to regulatory pressure.
  • “Beauty-from-within” supplements and functional beverages drive long-term growth.

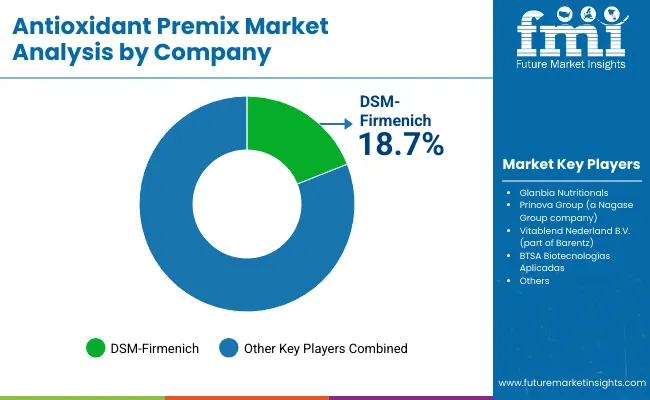
Competitive Landscape of Antioxidant Premix Market

Antioxidant Premix Market By Company

The Antioxidant Premix Market is moderately fragmented, with global ingredient leaders, regional formulators, and niche-focused specialists competing across diverse end-use sectors. Global nutrition and ingredient leaders such as DSM-Firmenich, BASF SE, and Archer Daniels Midland (ADM) hold significant market positions, supported by strong R&D pipelines, integrated supply chains, and strategic partnerships with food, pharmaceutical, and cosmetic companies. Their approaches are increasingly centered on natural antioxidant innovation, encapsulation technologies, and customized premix formulations aligned with clean-label and functional wellness trends.

Established mid-sized players, including Prinova Group, Barentz, and Kemin Industries, are actively addressing demand for application-specific blends tailored to bakery, dairy, and nutraceutical formulations. Their strengths are anchored in flexible manufacturing, regional presence, and rapid response to evolving regulatory frameworks. Value-added services such as formulation consultancy and stability testing are being leveraged to strengthen customer stickiness.

Specialized providers and regional blenders focus on cost-effective solutions for animal nutrition, personal care, and localized food markets. Their adaptability in customizing small-batch formulations and addressing specific health claims provides them with resilient positioning despite limited scale.

Competitive differentiation is expected to continue shifting away from bulk ingredient supply toward integrated solutions that combine science-backed claims, traceable sourcing, and digital formulation support platforms, ensuring stronger customer alignment and long-term value creation.

Key Developments in Antioxidant Premix Market

On June 4, 2025, Premix Group was awarded an EcoVadis Gold Medal, placing it in the top 5% globally for sustainability or the 98th percentile recognizing excellence in environmental, labor, ethics, and sustainable procurement practices. This is expected to elevate trust in green antioxidant premix solutions.

In early 2025 (around January-February), new USA tariffs ranging from 5-15% were imposed on select micronutrients and carrier materials, increasing cost pressure across the antioxidant premix value chain. As a result, many manufacturers initiated near-shoring and diversified sourcing to maintain margin stability.

Scope of the Report

Item Value
Quantitative Units USD 1.39 Billion (2025) → USD 2.49 Billion (2035)
Component Natural Antioxidants (Vitamin C, Vitamin E, Carotenoids, Polyphenols, Plant Extracts), Synthetic Antioxidants (BHA, BHT, TBHQ, Propyl Gallate)
Range Powder, Liquid, Granules, Encapsulated
Technology Encapsulation Technology, Spray Drying, Microencapsulation, Nanotechnology-based Delivery
Type Functional Blends, Customized Premixes, Standardized Premixes
End-use Industry Food & Beverages, Animal Feed, Dietary Supplements, Pharmaceuticals, Cosmetics & Personal Care
Regions Covered North America, Europe, East Asia, South Asia & Pacific, Latin America, Middle East & Africa
Country Covered United States, Germany, France, United Kingdom, China, India, Japan, Brazil, South Korea
Key Companies Profiled Cargill Inc., Archer Daniels Midland (ADM), DSM-Firmenich, BASF SE, DuPont Nutrition & Biosciences, Glanbia Nutritionals, Kerry Group, Barentz International, Vitablend Netherlands BV, Camlin Fine Sciences
Additional Attributes Dollar sales by ingredient type and application, adoption trends in fortified foods, supplements, and cosmetics, rising preference for natural antioxidants over synthetic, sector-specific growth in sports nutrition and geriatric health, increasing demand for clean-label and plant-based solutions, regional growth shaped by preventive healthcare initiatives, regulatory scrutiny driving synthetic reformulation, and innovation through encapsulation and nanotechnology for improved stability and bioavailability.

Key Segments

By Ingredient Type:

  • Natural Antioxidants
    • Vitamin C (Ascorbic Acid)
    • Vitamin E (Tocopherols, Tocotrienols)
    • Carotenoids (Beta-carotene, Lutein)
    • Polyphenols (Flavonoids, Resveratrol)
    • Plant Extracts (Green Tea, Grape Seed, Rosemary)
  • Synthetic Antioxidants
    • BHA
    • BHT
    • TBHQ
    • Propyl Gallate

By Form:

  • Powder
  • Liquid
  • Granules
  • Encapsulated

By Application:

  • Food & Beverages
    • Bakery
    • Meat & Poultry
    • Dairy Products
    • Beverages
    • Snacks
  • Animal Feed
    • Pet Food
    • Livestock Feed
    • Aquafeed
  • Dietary Supplements
    • Multivitamin Complexes
    • Sports Nutrition
    • Geriatric Nutrition
  • Pharmaceuticals
  • Cosmetics & Personal Care
    • Anti-aging Products
    • Skin Care Formulations

By Functionality:

  • Shelf-life Extension
  • Oxidative Stress Reduction
  • Color & Flavor Stabilization
  • Immune Support

By End User:

  • Food & Beverage Manufacturers
  • Nutraceutical Manufacturers
  • Pharmaceutical Companies
  • Cosmetic Brands
  • Feed Millers

By Distribution Channel:

  • Direct Sales (B2B)
  • Distributors/Wholesalers
  • Online Ingredient Marketplaces

By Region:

  • North America
  • Latin America
  • Europe
  • East Asia
  • South Asia & Pacific
  • Middle East and Africa

Table of Content

  1. Executive Summary
    • Global Market Outlook
    • Demand-side Trends
    • Supply-side Trends
    • Technology Roadmap Analysis
    • Analysis and Recommendations
  2. Market Overview
    • Market Coverage / Taxonomy
    • Market Definition / Scope / Limitations
  3. Market Background
    • Market Dynamics
      • Drivers
      • Restraints
      • Opportunity
      • Trends
    • Scenario Forecast
      • Demand in Optimistic Scenario
      • Demand in Likely Scenario
      • Demand in Conservative Scenario
    • Opportunity Map Analysis
    • Product Life Cycle Analysis
    • Supply Chain Analysis
    • Investment Feasibility Matrix
    • Value Chain Analysis
    • PESTLE and Porter’s Analysis
    • Regulatory Landscape
    • Regional Parent Market Outlook
    • Production and Consumption Statistics
    • Import and Export Statistics
  4. Global Market Analysis 2020 to 2024 and Forecast, 2025 to 2035
    • Historical Market Size Value (USD Million) Analysis, 2020 to 2024
    • Current and Future Market Size Value (USD Million) Projections, 2025 to 2035
      • Y-o-Y Growth Trend Analysis
      • Absolute $ Opportunity Analysis
  5. Global Market Pricing Analysis 2020 to 2024 and Forecast 2025 to 2035
  6. Global Market Analysis 2020 to 2024 and Forecast 2025 to 2035, By Ingredient Type
    • Introduction / Key Findings
    • Historical Market Size Value (USD Million) Analysis By Ingredient Type, 2020 to 2024
    • Current and Future Market Size Value (USD Million) Analysis and Forecast By Ingredient Type, 2025 to 2035
      • Natural Antioxidants
        • Vitamin C (Ascorbic Acid)
        • Vitamin E (Tocopherols, Tocotrienols)
        • Carotenoids (Beta-carotene, Lutein)
        • Polyphenols (Flavonoids, Resveratrol)
        • Plant Extracts (Green Tea, Grape Seed, Rosemary)
      • Synthetic Antioxidants
        • BHA
        • BHT
        • TBHQ
        • Propyl Gallate
    • Y-o-Y Growth Trend Analysis By Ingredient Type, 2020 to 2024
    • Absolute $ Opportunity Analysis By Ingredient Type, 2025 to 2035
  7. Global Market Analysis 2020 to 2024 and Forecast 2025 to 2035, By Form
    • Introduction / Key Findings
    • Historical Market Size Value (USD Million) Analysis By Form, 2020 to 2024
    • Current and Future Market Size Value (USD Million) Analysis and Forecast By Form, 2025 to 2035
      • Powder
      • Liquid
      • Granules
      • Encapsulated
    • Y-o-Y Growth Trend Analysis By Form, 2020 to 2024
    • Absolute $ Opportunity Analysis By Form, 2025 to 2035
  8. Global Market Analysis 2020 to 2024 and Forecast 2025 to 2035, By Application
    • Introduction / Key Findings
    • Historical Market Size Value (USD Million) Analysis By Application, 2020 to 2024
    • Current and Future Market Size Value (USD Million) Analysis and Forecast By Application, 2025 to 2035
      • Food & Beverages
        • Bakery
        • Meat & Poultry
        • Dairy Products
        • Beverages
        • Snacks
      • Animal Feed
        • Pet Food
        • Livestock Feed
        • Aquafeed
      • Dietary Supplements
        • Multivitamin Complexes
        • Sports Nutrition
        • Geriatric Nutrition
      • Pharmaceuticals
      • Cosmetics & Personal Care
        • Anti-aging Products
        • Skin Care Formulations
    • Y-o-Y Growth Trend Analysis By Application, 2020 to 2024
    • Absolute $ Opportunity Analysis By Application, 2025 to 2035
  9. Global Market Analysis 2020 to 2024 and Forecast 2025 to 2035, By Functionality
    • Introduction / Key Findings
    • Historical Market Size Value (USD Million) Analysis By Functionality, 2020 to 2024
    • Current and Future Market Size Value (USD Million) Analysis and Forecast By Functionality, 2025 to 2035
      • Shelf-life Extension
      • Oxidative Stress Reduction
      • Color & Flavor Stabilization
      • Immune Support
    • Y-o-Y Growth Trend Analysis By Functionality, 2020 to 2024
    • Absolute $ Opportunity Analysis By Functionality, 2025 to 2035
  10. Global Market Analysis 2020 to 2024 and Forecast 2025 to 2035, By End User
    • Introduction / Key Findings
    • Historical Market Size Value (USD Million) Analysis By End User, 2020 to 2024
    • Current and Future Market Size Value (USD Million) Analysis and Forecast By End User, 2025 to 2035
      • Food & Beverage Manufacturers
      • Nutraceutical Manufacturers
      • Pharmaceutical Companies
      • Cosmetic Brands
      • Feed Millers
    • Y-o-Y Growth Trend Analysis By End User, 2020 to 2024
    • Absolute $ Opportunity Analysis By End User, 2025 to 2035
  11. Global Market Analysis 2020 to 2024 and Forecast 2025 to 2035, By Distribution Channel
    • Introduction / Key Findings
    • Historical Market Size Value (USD Million) Analysis By Distribution Channel, 2020 to 2024
    • Current and Future Market Size Value (USD Million) Analysis and Forecast By Distribution Channel, 2025 to 2035
      • Direct Sales (B2B)
      • Distributors/Wholesalers
      • Online Ingredient Marketplaces
    • Y-o-Y Growth Trend Analysis By Distribution Channel, 2020 to 2024
    • Absolute $ Opportunity Analysis By Distribution Channel, 2025 to 2035
  12. Global Market Analysis 2020 to 2024 and Forecast 2025 to 2035, By Region
    • Introduction
    • Historical Market Size Value (USD Million) Analysis By Region, 2020 to 2024
    • Current Market Size Value (USD Million) Analysis and Forecast By Region, 2025 to 2035
      • North America
      • Latin America
      • Europe
      • East Asia
      • South Asia & Pacific
      • Middle East and Africa
    • Market Attractiveness Analysis By Region
  13. North America Market Analysis 2020 to 2024 and Forecast 2025 to 2035, By Country
    • Historical Market Size Value (USD Million) Trend Analysis By Market Taxonomy, 2020 to 2024
    • Market Size Value (USD Million) Forecast By Market Taxonomy, 2025 to 2035
      • By Country
        • USA
        • Canada
      • By Ingredient Type
      • By Form
      • By Application
      • By Functionality
      • By End User
      • By Distribution Channel
    • Market Attractiveness Analysis
      • By Country
      • By Ingredient Type
      • By Form
      • By Application
      • By Functionality
      • By End User
      • By Distribution Channel
    • Key Takeaways
  14. Latin America Market Analysis 2020 to 2024 and Forecast 2025 to 2035, By Country
    • Historical Market Size Value (USD Million) Trend Analysis By Market Taxonomy, 2020 to 2024
    • Market Size Value (USD Million) Forecast By Market Taxonomy, 2025 to 2035
      • By Country
        • Brazil
        • Mexico
        • Colombia
        • Rest of Latin America
      • By Ingredient Type
      • By Form
      • By Application
      • By Functionality
      • By End User
      • By Distribution Channel
    • Market Attractiveness Analysis
      • By Country
      • By Ingredient Type
      • By Form
      • By Application
      • By Functionality
      • By End User
      • By Distribution Channel
    • Key Takeaways
  15. Europe Market Analysis 2020 to 2024 and Forecast 2025 to 2035, By Country
    • Historical Market Size Value (USD Million) Trend Analysis By Market Taxonomy, 2020 to 2024
    • Market Size Value (USD Million) Forecast By Market Taxonomy, 2025 to 2035
      • By Country
        • Germany
        • UK
        • France
        • Italy
        • Spain
        • Belgium
        • Netherlands
        • Nordic
        • Switzerland
        • Russia
        • Poland
        • Rest of Europe
      • By Ingredient Type
      • By Form
      • By Application
      • By Functionality
      • By End User
      • By Distribution Channel
    • Market Attractiveness Analysis
      • By Country
      • By Ingredient Type
      • By Form
      • By Application
      • By Functionality
      • By End User
      • By Distribution Channel
    • Key Takeaways
  16. East Asia Market Analysis 2020 to 2024 and Forecast 2025 to 2035, By Country
    • Historical Market Size Value (USD Million) Trend Analysis By Market Taxonomy, 2020 to 2024
    • Market Size Value (USD Million) Forecast By Market Taxonomy, 2025 to 2035
      • By Country
        • China
        • Japan
        • South Korea
      • By Ingredient Type
      • By Form
      • By Application
      • By Functionality
      • By End User
      • By Distribution Channel
    • Market Attractiveness Analysis
      • By Country
      • By Ingredient Type
      • By Form
      • By Application
      • By Functionality
      • By End User
      • By Distribution Channel
    • Key Takeaways
  17. South Asia & Pacific Market Analysis 2020 to 2024 and Forecast 2025 to 2035, By Country
    • Historical Market Size Value (USD Million) Trend Analysis By Market Taxonomy, 2020 to 2024
    • Market Size Value (USD Million) Forecast By Market Taxonomy, 2025 to 2035
      • By Country
        • India
        • Thailand
        • Malaysia
        • Indonesia
        • Singapore
        • Vietnam
        • Australia
        • New Zealand
        • Rest of South Asia
      • By Ingredient Type
      • By Form
      • By Application
      • By Functionality
      • By End User
      • By Distribution Channel
    • Market Attractiveness Analysis
      • By Country
      • By Ingredient Type
      • By Form
      • By Application
      • By Functionality
      • By End User
      • By Distribution Channel
    • Key Takeaways
  18. Middle East and Africa Market Analysis 2020 to 2024 and Forecast 2025 to 2035, By Country
    • Historical Market Size Value (USD Million) Trend Analysis By Market Taxonomy, 2020 to 2024
    • Market Size Value (USD Million) Forecast By Market Taxonomy, 2025 to 2035
      • By Country
        • Turkey
        • UAE
        • Saudi Arabia
        • Israel
        • Other GCC Countries
        • North Africa
        • South Africa
      • By Ingredient Type
      • By Form
      • By Application
      • By Functionality
      • By End User
      • By Distribution Channel
    • Market Attractiveness Analysis
      • By Country
      • By Ingredient Type
      • By Form
      • By Application
      • By Functionality
      • By End User
      • By Distribution Channel
    • Key Takeaways
  19. Key Countries Market Analysis
    • USA
      • Pricing Analysis
      • Market Share Analysis, 2024
        • By Ingredient Type
        • By Form
        • By Application
        • By Functionality
        • By End User
        • By Distribution Channel
    • Canada
      • Pricing Analysis
      • Market Share Analysis, 2024
        • By Ingredient Type
        • By Form
        • By Application
        • By Functionality
        • By End User
        • By Distribution Channel
    • Brazil
      • Pricing Analysis
      • Market Share Analysis, 2024
        • By Ingredient Type
        • By Form
        • By Application
        • By Functionality
        • By End User
        • By Distribution Channel
    • Mexico
      • Pricing Analysis
      • Market Share Analysis, 2024
        • By Ingredient Type
        • By Form
        • By Application
        • By Functionality
        • By End User
        • By Distribution Channel
    • Colombia
      • Pricing Analysis
      • Market Share Analysis, 2024
        • By Ingredient Type
        • By Form
        • By Application
        • By Functionality
        • By End User
        • By Distribution Channel
    • Rest of Latin America
      • Pricing Analysis
      • Market Share Analysis, 2024
        • By Ingredient Type
        • By Form
        • By Application
        • By Functionality
        • By End User
        • By Distribution Channel
    • Germany
      • Pricing Analysis
      • Market Share Analysis, 2024
        • By Ingredient Type
        • By Form
        • By Application
        • By Functionality
        • By End User
        • By Distribution Channel
    • UK
      • Pricing Analysis
      • Market Share Analysis, 2024
        • By Ingredient Type
        • By Form
        • By Application
        • By Functionality
        • By End User
        • By Distribution Channel
    • France
      • Pricing Analysis
      • Market Share Analysis, 2024
        • By Ingredient Type
        • By Form
        • By Application
        • By Functionality
        • By End User
        • By Distribution Channel
    • Italy
      • Pricing Analysis
      • Market Share Analysis, 2024
        • By Ingredient Type
        • By Form
        • By Application
        • By Functionality
        • By End User
        • By Distribution Channel
    • Spain
      • Pricing Analysis
      • Market Share Analysis, 2024
        • By Ingredient Type
        • By Form
        • By Application
        • By Functionality
        • By End User
        • By Distribution Channel
    • Belgium
      • Pricing Analysis
      • Market Share Analysis, 2024
        • By Ingredient Type
        • By Form
        • By Application
        • By Functionality
        • By End User
        • By Distribution Channel
    • Netherlands
      • Pricing Analysis
      • Market Share Analysis, 2024
        • By Ingredient Type
        • By Form
        • By Application
        • By Functionality
        • By End User
        • By Distribution Channel
    • Nordic
      • Pricing Analysis
      • Market Share Analysis, 2024
        • By Ingredient Type
        • By Form
        • By Application
        • By Functionality
        • By End User
        • By Distribution Channel
    • Switzerland
      • Pricing Analysis
      • Market Share Analysis, 2024
        • By Ingredient Type
        • By Form
        • By Application
        • By Functionality
        • By End User
        • By Distribution Channel
    • Russia
      • Pricing Analysis
      • Market Share Analysis, 2024
        • By Ingredient Type
        • By Form
        • By Application
        • By Functionality
        • By End User
        • By Distribution Channel
    • Poland
      • Pricing Analysis
      • Market Share Analysis, 2024
        • By Ingredient Type
        • By Form
        • By Application
        • By Functionality
        • By End User
        • By Distribution Channel
    • Rest of Europe
      • Pricing Analysis
      • Market Share Analysis, 2024
        • By Ingredient Type
        • By Form
        • By Application
        • By Functionality
        • By End User
        • By Distribution Channel
    • China
      • Pricing Analysis
      • Market Share Analysis, 2024
        • By Ingredient Type
        • By Form
        • By Application
        • By Functionality
        • By End User
        • By Distribution Channel
    • Japan
      • Pricing Analysis
      • Market Share Analysis, 2024
        • By Ingredient Type
        • By Form
        • By Application
        • By Functionality
        • By End User
        • By Distribution Channel
    • South Korea
      • Pricing Analysis
      • Market Share Analysis, 2024
        • By Ingredient Type
        • By Form
        • By Application
        • By Functionality
        • By End User
        • By Distribution Channel
    • India
      • Pricing Analysis
      • Market Share Analysis, 2024
        • By Ingredient Type
        • By Form
        • By Application
        • By Functionality
        • By End User
        • By Distribution Channel
    • Thailand
      • Pricing Analysis
      • Market Share Analysis, 2024
        • By Ingredient Type
        • By Form
        • By Application
        • By Functionality
        • By End User
        • By Distribution Channel
    • Malaysia
      • Pricing Analysis
      • Market Share Analysis, 2024
        • By Ingredient Type
        • By Form
        • By Application
        • By Functionality
        • By End User
        • By Distribution Channel
    • Indonesia
      • Pricing Analysis
      • Market Share Analysis, 2024
        • By Ingredient Type
        • By Form
        • By Application
        • By Functionality
        • By End User
        • By Distribution Channel
    • Singapore
      • Pricing Analysis
      • Market Share Analysis, 2024
        • By Ingredient Type
        • By Form
        • By Application
        • By Functionality
        • By End User
        • By Distribution Channel
    • Vietnam
      • Pricing Analysis
      • Market Share Analysis, 2024
        • By Ingredient Type
        • By Form
        • By Application
        • By Functionality
        • By End User
        • By Distribution Channel
    • Australia
      • Pricing Analysis
      • Market Share Analysis, 2024
        • By Ingredient Type
        • By Form
        • By Application
        • By Functionality
        • By End User
        • By Distribution Channel
    • New Zealand
      • Pricing Analysis
      • Market Share Analysis, 2024
        • By Ingredient Type
        • By Form
        • By Application
        • By Functionality
        • By End User
        • By Distribution Channel
    • Rest of South Asia
      • Pricing Analysis
      • Market Share Analysis, 2024
        • By Ingredient Type
        • By Form
        • By Application
        • By Functionality
        • By End User
        • By Distribution Channel
  20. Market Structure Analysis
    • Competition Dashboard
    • Competition Benchmarking
    • Market Share Analysis of Top Players
      • By Regional
      • By Ingredient Type
      • By Form
      • By Application
      • By Functionality
      • By End User
      • By Distribution Channel
  21. Competition Analysis
    • Competition Deep Dive
      • DSM-Firmenich
        • Overview
        • Product Portfolio
        • Profitability by Market Segments (Product/Age /Sales Channel/Region)
        • Sales Footprint
        • Strategy Overview
        • Glanbia Nutritionals
        • Prinova Group (a Nagase Group company)
        • Vitablend Nederland B.V. (part of Barentz)
        • BTSA Biotecnologías Aplicadas
  22. Assumptions & Acronyms Used
  23. Research Methodology

List of Tables

  • Table 1: Global Market Value (USD Million) Forecast by Region, 2020-2035
  • Table 2: Global Market Value (USD Million) Forecast by Ingredient Type, 2020-2035
  • Table 3: Global Market Value (USD Million) Forecast by Form, 2020-2035
  • Table 4: Global Market Value (USD Million) Forecast by Application, 2020-2035
  • Table 5: Global Market Value (USD Million) Forecast by Functionality, 2020-2035
  • Table 6: Global Market Value (USD Million) Forecast by End User, 2020-2035
  • Table 7: Global Market Value (USD Million) Forecast by Distribution Channel, 2020-2035
  • Table 8: North America Market Value (USD Million) Forecast by Country, 2020-2035
  • Table 9: North America Market Value (USD Million) Forecast by Ingredient Type, 2020-2035
  • Table 10: North America Market Value (USD Million) Forecast by Form, 2020-2035
  • Table 11: North America Market Value (USD Million) Forecast by Application, 2020-2035
  • Table 12: North America Market Value (USD Million) Forecast by Functionality, 2020-2035
  • Table 13: North America Market Value (USD Million) Forecast by End User, 2020-2035
  • Table 14: North America Market Value (USD Million) Forecast by Distribution Channel, 2020-2035
  • Table 15: Latin America Market Value (USD Million) Forecast by Country, 2020-2035
  • Table 16: Latin America Market Value (USD Million) Forecast by Ingredient Type, 2020-2035
  • Table 17: Latin America Market Value (USD Million) Forecast by Form, 2020-2035
  • Table 18: Latin America Market Value (USD Million) Forecast by Application, 2020-2035
  • Table 19: Latin America Market Value (USD Million) Forecast by Functionality, 2020-2035
  • Table 20: Latin America Market Value (USD Million) Forecast by End User, 2020-2035
  • Table 21: Latin America Market Value (USD Million) Forecast by Distribution Channel, 2020-2035
  • Table 22: Europe Market Value (USD Million) Forecast by Country, 2020-2035
  • Table 23: Europe Market Value (USD Million) Forecast by Ingredient Type, 2020-2035
  • Table 24: Europe Market Value (USD Million) Forecast by Form, 2020-2035
  • Table 25: Europe Market Value (USD Million) Forecast by Application, 2020-2035
  • Table 26: Europe Market Value (USD Million) Forecast by Functionality, 2020-2035
  • Table 27: Europe Market Value (USD Million) Forecast by End User, 2020-2035
  • Table 28: Europe Market Value (USD Million) Forecast by Distribution Channel, 2020-2035
  • Table 29: East Asia Market Value (USD Million) Forecast by Country, 2020-2035
  • Table 30: East Asia Market Value (USD Million) Forecast by Ingredient Type, 2020-2035
  • Table 31: East Asia Market Value (USD Million) Forecast by Form, 2020-2035
  • Table 32: East Asia Market Value (USD Million) Forecast by Application, 2020-2035
  • Table 33: East Asia Market Value (USD Million) Forecast by Functionality, 2020-2035
  • Table 34: East Asia Market Value (USD Million) Forecast by End User, 2020-2035
  • Table 35: East Asia Market Value (USD Million) Forecast by Distribution Channel, 2020-2035
  • Table 36: South Asia & Pacific Market Value (USD Million) Forecast by Country, 2020-2035
  • Table 37: South Asia & Pacific Market Value (USD Million) Forecast by Ingredient Type, 2020-2035
  • Table 38: South Asia & Pacific Market Value (USD Million) Forecast by Form, 2020-2035
  • Table 39: South Asia & Pacific Market Value (USD Million) Forecast by Application, 2020-2035
  • Table 40: South Asia & Pacific Market Value (USD Million) Forecast by Functionality, 2020-2035
  • Table 41: South Asia & Pacific Market Value (USD Million) Forecast by End User, 2020-2035
  • Table 42: South Asia & Pacific Market Value (USD Million) Forecast by Distribution Channel, 2020-2035
  • Table 43: Middle East and Africa Market Value (USD Million) Forecast by Country, 2020-2035
  • Table 44: Middle East and Africa Market Value (USD Million) Forecast by Ingredient Type, 2020-2035
  • Table 45: Middle East and Africa Market Value (USD Million) Forecast by Form, 2020-2035
  • Table 46: Middle East and Africa Market Value (USD Million) Forecast by Application, 2020-2035
  • Table 47: Middle East and Africa Market Value (USD Million) Forecast by Functionality, 2020-2035
  • Table 48: Middle East and Africa Market Value (USD Million) Forecast by End User, 2020-2035
  • Table 49: Middle East and Africa Market Value (USD Million) Forecast by Distribution Channel, 2020-2035

List of Figures

  • Figure 1: Global Market Pricing Analysis
  • Figure 2: Global Market Value (USD Million) Forecast 2020–2035
  • Figure 3: Global Market Value Share and BPS Analysis by Ingredient Type, 2025 and 2035
  • Figure 4: Global Market Y-o-Y Growth Comparison by Ingredient Type, 2025–2035
  • Figure 5: Global Market Attractiveness Analysis by Ingredient Type
  • Figure 6: Global Market Value Share and BPS Analysis by Form, 2025 and 2035
  • Figure 7: Global Market Y-o-Y Growth Comparison by Form, 2025–2035
  • Figure 8: Global Market Attractiveness Analysis by Form
  • Figure 9: Global Market Value Share and BPS Analysis by Application, 2025 and 2035
  • Figure 10: Global Market Y-o-Y Growth Comparison by Application, 2025–2035
  • Figure 11: Global Market Attractiveness Analysis by Application
  • Figure 12: Global Market Value Share and BPS Analysis by Functionality, 2025 and 2035
  • Figure 13: Global Market Y-o-Y Growth Comparison by Functionality, 2025–2035
  • Figure 14: Global Market Attractiveness Analysis by Functionality
  • Figure 15: Global Market Value Share and BPS Analysis by End User, 2025 and 2035
  • Figure 16: Global Market Y-o-Y Growth Comparison by End User, 2025–2035
  • Figure 17: Global Market Attractiveness Analysis by End User
  • Figure 18: Global Market Value Share and BPS Analysis by Distribution Channel, 2025 and 2035
  • Figure 19: Global Market Y-o-Y Growth Comparison by Distribution Channel, 2025–2035
  • Figure 20: Global Market Attractiveness Analysis by Distribution Channel
  • Figure 21: Global Market Value (USD Million) Share and BPS Analysis by Region, 2025 and 2035
  • Figure 22: Global Market Y-o-Y Growth Comparison by Region, 2025–2035
  • Figure 23: Global Market Attractiveness Analysis by Region
  • Figure 24: North America Market Incremental $ Opportunity, 2025–2035
  • Figure 25: Latin America Market Incremental $ Opportunity, 2025–2035
  • Figure 26: Europe Market Incremental $ Opportunity, 2025–2035
  • Figure 27: East Asia Market Incremental $ Opportunity, 2025–2035
  • Figure 28: South Asia & Pacific Market Incremental $ Opportunity, 2025–2035
  • Figure 29: Middle East and Africa Market Incremental $ Opportunity, 2025–2035
  • Figure 30: North America Market Value Share and BPS Analysis by Country, 2025 and 2035
  • Figure 31: North America Market Value Share and BPS Analysis by Ingredient Type, 2025 and 2035
  • Figure 32: North America Market Y-o-Y Growth Comparison by Ingredient Type, 2025–2035
  • Figure 33: North America Market Attractiveness Analysis by Ingredient Type
  • Figure 34: North America Market Value Share and BPS Analysis by Form, 2025 and 2035
  • Figure 35: North America Market Y-o-Y Growth Comparison by Form, 2025–2035
  • Figure 36: North America Market Attractiveness Analysis by Form
  • Figure 37: North America Market Value Share and BPS Analysis by Application, 2025 and 2035
  • Figure 38: North America Market Y-o-Y Growth Comparison by Application, 2025–2035
  • Figure 39: North America Market Attractiveness Analysis by Application
  • Figure 40: North America Market Value Share and BPS Analysis by Functionality, 2025 and 2035
  • Figure 41: North America Market Y-o-Y Growth Comparison by Functionality, 2025–2035
  • Figure 42: North America Market Attractiveness Analysis by Functionality
  • Figure 43: North America Market Value Share and BPS Analysis by End User, 2025 and 2035
  • Figure 44: North America Market Y-o-Y Growth Comparison by End User, 2025–2035
  • Figure 45: North America Market Attractiveness Analysis by End User
  • Figure 46: North America Market Value Share and BPS Analysis by Distribution Channel, 2025 and 2035
  • Figure 47: North America Market Y-o-Y Growth Comparison by Distribution Channel, 2025–2035
  • Figure 48: North America Market Attractiveness Analysis by Distribution Channel
  • Figure 49: Latin America Market Value Share and BPS Analysis by Country, 2025 and 2035
  • Figure 50: Latin America Market Value Share and BPS Analysis by Ingredient Type, 2025 and 2035
  • Figure 51: Latin America Market Y-o-Y Growth Comparison by Ingredient Type, 2025–2035
  • Figure 52: Latin America Market Attractiveness Analysis by Ingredient Type
  • Figure 53: Latin America Market Value Share and BPS Analysis by Form, 2025 and 2035
  • Figure 54: Latin America Market Y-o-Y Growth Comparison by Form, 2025–2035
  • Figure 55: Latin America Market Attractiveness Analysis by Form
  • Figure 56: Latin America Market Value Share and BPS Analysis by Application, 2025 and 2035
  • Figure 57: Latin America Market Y-o-Y Growth Comparison by Application, 2025–2035
  • Figure 58: Latin America Market Attractiveness Analysis by Application
  • Figure 59: Latin America Market Value Share and BPS Analysis by Functionality, 2025 and 2035
  • Figure 60: Latin America Market Y-o-Y Growth Comparison by Functionality, 2025–2035
  • Figure 61: Latin America Market Attractiveness Analysis by Functionality
  • Figure 62: Latin America Market Value Share and BPS Analysis by End User, 2025 and 2035
  • Figure 63: Latin America Market Y-o-Y Growth Comparison by End User, 2025–2035
  • Figure 64: Latin America Market Attractiveness Analysis by End User
  • Figure 65: Latin America Market Value Share and BPS Analysis by Distribution Channel, 2025 and 2035
  • Figure 66: Latin America Market Y-o-Y Growth Comparison by Distribution Channel, 2025–2035
  • Figure 67: Latin America Market Attractiveness Analysis by Distribution Channel
  • Figure 68: Europe Market Value Share and BPS Analysis by Country, 2025 and 2035
  • Figure 69: Europe Market Value Share and BPS Analysis by Ingredient Type, 2025 and 2035
  • Figure 70: Europe Market Y-o-Y Growth Comparison by Ingredient Type, 2025–2035
  • Figure 71: Europe Market Attractiveness Analysis by Ingredient Type
  • Figure 72: Europe Market Value Share and BPS Analysis by Form, 2025 and 2035
  • Figure 73: Europe Market Y-o-Y Growth Comparison by Form, 2025–2035
  • Figure 74: Europe Market Attractiveness Analysis by Form
  • Figure 75: Europe Market Value Share and BPS Analysis by Application, 2025 and 2035
  • Figure 76: Europe Market Y-o-Y Growth Comparison by Application, 2025–2035
  • Figure 77: Europe Market Attractiveness Analysis by Application
  • Figure 78: Europe Market Value Share and BPS Analysis by Functionality, 2025 and 2035
  • Figure 79: Europe Market Y-o-Y Growth Comparison by Functionality, 2025–2035
  • Figure 80: Europe Market Attractiveness Analysis by Functionality
  • Figure 81: Europe Market Value Share and BPS Analysis by End User, 2025 and 2035
  • Figure 82: Europe Market Y-o-Y Growth Comparison by End User, 2025–2035
  • Figure 83: Europe Market Attractiveness Analysis by End User
  • Figure 84: Europe Market Value Share and BPS Analysis by Distribution Channel, 2025 and 2035
  • Figure 85: Europe Market Y-o-Y Growth Comparison by Distribution Channel, 2025–2035
  • Figure 86: Europe Market Attractiveness Analysis by Distribution Channel
  • Figure 87: East Asia Market Value Share and BPS Analysis by Country, 2025 and 2035
  • Figure 88: East Asia Market Value Share and BPS Analysis by Ingredient Type, 2025 and 2035
  • Figure 89: East Asia Market Y-o-Y Growth Comparison by Ingredient Type, 2025–2035
  • Figure 90: East Asia Market Attractiveness Analysis by Ingredient Type
  • Figure 91: East Asia Market Value Share and BPS Analysis by Form, 2025 and 2035
  • Figure 92: East Asia Market Y-o-Y Growth Comparison by Form, 2025–2035
  • Figure 93: East Asia Market Attractiveness Analysis by Form
  • Figure 94: East Asia Market Value Share and BPS Analysis by Application, 2025 and 2035
  • Figure 95: East Asia Market Y-o-Y Growth Comparison by Application, 2025–2035
  • Figure 96: East Asia Market Attractiveness Analysis by Application
  • Figure 97: East Asia Market Value Share and BPS Analysis by Functionality, 2025 and 2035
  • Figure 98: East Asia Market Y-o-Y Growth Comparison by Functionality, 2025–2035
  • Figure 99: East Asia Market Attractiveness Analysis by Functionality
  • Figure 100: East Asia Market Value Share and BPS Analysis by End User, 2025 and 2035
  • Figure 101: East Asia Market Y-o-Y Growth Comparison by End User, 2025–2035
  • Figure 102: East Asia Market Attractiveness Analysis by End User
  • Figure 103: East Asia Market Value Share and BPS Analysis by Distribution Channel, 2025 and 2035
  • Figure 104: East Asia Market Y-o-Y Growth Comparison by Distribution Channel, 2025–2035
  • Figure 105: East Asia Market Attractiveness Analysis by Distribution Channel
  • Figure 106: South Asia & Pacific Market Value Share and BPS Analysis by Country, 2025 and 2035
  • Figure 107: South Asia & Pacific Market Value Share and BPS Analysis by Ingredient Type, 2025 and 2035
  • Figure 108: South Asia & Pacific Market Y-o-Y Growth Comparison by Ingredient Type, 2025–2035
  • Figure 109: South Asia & Pacific Market Attractiveness Analysis by Ingredient Type
  • Figure 110: South Asia & Pacific Market Value Share and BPS Analysis by Form, 2025 and 2035
  • Figure 111: South Asia & Pacific Market Y-o-Y Growth Comparison by Form, 2025–2035
  • Figure 112: South Asia & Pacific Market Attractiveness Analysis by Form
  • Figure 113: South Asia & Pacific Market Value Share and BPS Analysis by Application, 2025 and 2035
  • Figure 114: South Asia & Pacific Market Y-o-Y Growth Comparison by Application, 2025–2035
  • Figure 115: South Asia & Pacific Market Attractiveness Analysis by Application
  • Figure 116: South Asia & Pacific Market Value Share and BPS Analysis by Functionality, 2025 and 2035
  • Figure 117: South Asia & Pacific Market Y-o-Y Growth Comparison by Functionality, 2025–2035
  • Figure 118: South Asia & Pacific Market Attractiveness Analysis by Functionality
  • Figure 119: South Asia & Pacific Market Value Share and BPS Analysis by End User, 2025 and 2035
  • Figure 120: South Asia & Pacific Market Y-o-Y Growth Comparison by End User, 2025–2035
  • Figure 121: South Asia & Pacific Market Attractiveness Analysis by End User
  • Figure 122: South Asia & Pacific Market Value Share and BPS Analysis by Distribution Channel, 2025 and 2035
  • Figure 123: South Asia & Pacific Market Y-o-Y Growth Comparison by Distribution Channel, 2025–2035
  • Figure 124: South Asia & Pacific Market Attractiveness Analysis by Distribution Channel
  • Figure 125: Middle East and Africa Market Value Share and BPS Analysis by Country, 2025 and 2035
  • Figure 126: Middle East and Africa Market Value Share and BPS Analysis by Ingredient Type, 2025 and 2035
  • Figure 127: Middle East and Africa Market Y-o-Y Growth Comparison by Ingredient Type, 2025–2035
  • Figure 128: Middle East and Africa Market Attractiveness Analysis by Ingredient Type
  • Figure 129: Middle East and Africa Market Value Share and BPS Analysis by Form, 2025 and 2035
  • Figure 130: Middle East and Africa Market Y-o-Y Growth Comparison by Form, 2025–2035
  • Figure 131: Middle East and Africa Market Attractiveness Analysis by Form
  • Figure 132: Middle East and Africa Market Value Share and BPS Analysis by Application, 2025 and 2035
  • Figure 133: Middle East and Africa Market Y-o-Y Growth Comparison by Application, 2025–2035
  • Figure 134: Middle East and Africa Market Attractiveness Analysis by Application
  • Figure 135: Middle East and Africa Market Value Share and BPS Analysis by Functionality, 2025 and 2035
  • Figure 136: Middle East and Africa Market Y-o-Y Growth Comparison by Functionality, 2025–2035
  • Figure 137: Middle East and Africa Market Attractiveness Analysis by Functionality
  • Figure 138: Middle East and Africa Market Value Share and BPS Analysis by End User, 2025 and 2035
  • Figure 139: Middle East and Africa Market Y-o-Y Growth Comparison by End User, 2025–2035
  • Figure 140: Middle East and Africa Market Attractiveness Analysis by End User
  • Figure 141: Middle East and Africa Market Value Share and BPS Analysis by Distribution Channel, 2025 and 2035
  • Figure 142: Middle East and Africa Market Y-o-Y Growth Comparison by Distribution Channel, 2025–2035
  • Figure 143: Middle East and Africa Market Attractiveness Analysis by Distribution Channel
  • Figure 144: Global Market – Tier Structure Analysis
  • Figure 145: Global Market – Company Share Analysis

Frequently Asked Questions

How big is the Antioxidant Premix Market in 2025?

The global Antioxidant Premix Market is estimated to be valued at USD 1.39 Billion in 2025, supported by increasing applications across food, dietary supplements, and cosmetics.

What will be the size of the Antioxidant Premix Market in 2035?

The market size for the Antioxidant Premix Market is projected to reach USD 2.49 Billion by 2035, driven by sustained demand for natural antioxidants and functional nutrition.

How much will the Antioxidant Premix Market grow between 2025 and 2035?

The Antioxidant Premix Market is expected to expand at a 6.0% CAGR between 2025 and 2035, reflecting rising preference for clean-label, fortified, and plant-derived products.

What are the key product types in the Antioxidant Premix Market?

The key product types in the Antioxidant Premix Market are natural antioxidants (Vitamin C, Vitamin E, Carotenoids, Polyphenols, Plant Extracts) and synthetic antioxidants (BHA, BHT, TBHQ, Propyl Gallate).

Which form segment will contribute a significant share in the Antioxidant Premix Market in 2025?

In terms of form, the powder segment is expected to command 45% share in 2025, supported by its wide application in food, supplements, and feed formulations.

Explore Similar Insights

Future Market Insights

Antioxidant Premix Market

Chat With

MaRIA

Hi There, I am MaRIA, Your Market Research Intelligence Assistant. How may I help you?