Reports

- Global Locations -

Headquarters

Future Market Insights, Inc.

Christiana Corporate, 200
Continental Drive, Suite 401,
Newark, Delaware - 19713,
United States

T: +1-845-579-5705

Americas

Future Market Insights, Inc.

616 Corporate Way, Suite 2-9018,
Valley Cottage, NY 10989, United States

T: +1-347-918-3531

MEA

Future Market Insights

1602-6 Jumeirah Bay X2 Tower, Plot No: JLT-PH2-X2A,
Jumeirah Lakes Towers, Dubai,
United Arab Emirates

Europe

Future Market Insights

3rd Floor, 207 Regent Street,
W1B 3HH London
United Kingdom

T: + 44 (0) 20 8123 9659
D: +44 (0) 20 3287 4268

Asia Pacific

Future Market Insights

IndiaLand Global Tech Park, Unit UG-1, Behind Grand HighStreet, Phase 1, Hinjawadi, MH, Pune – 411057, India

Automotive Manufacturing Equipment Market Outlook from 2024 to 2034

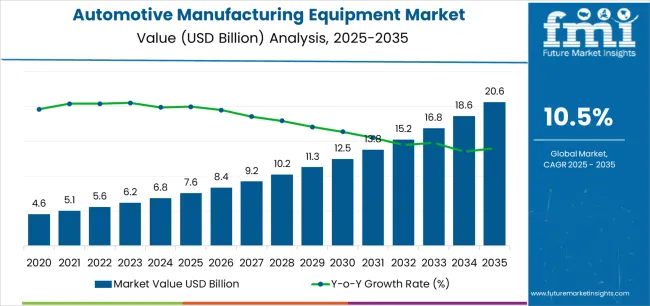
The global automotive manufacturing equipment market size is estimated to reach US$ 6.8 billion in 2024. It is anticipated to register strong growth, with overall automotive manufacturing equipment demand rising at a CAGR of 11.1% during the forecast period. Accordingly, the total market valuation is projected to reach US$ 19.4 billion by 2034.

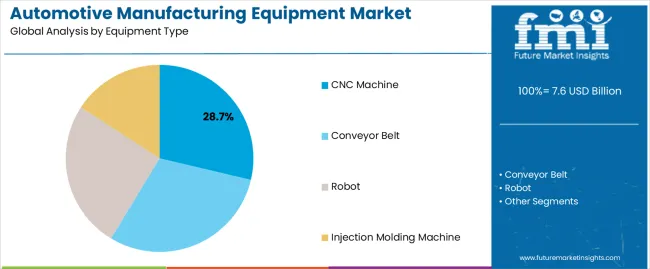
Demand remains high for conveyor belts owing to their growing usage in the automotive sector for moving materials and parts. The target segment is expected to thrive at 11.0% CAGR during the assessment period.

Automotive manufacturing equipment, consisting of several machines, devices, and tools, is witnessing strong demand, and the trend is expected to continue through 2034. This is due to their growing adoption in the automotive sector.

The ultimate search for enhanced productivity and reduced labor costs is prompting the automotive industry to embrace automation. This, in turn, is expected to fuel sales of automotive manufacturing equipment during the assessment period.

Several automotive manufacturers are employing advanced manufacturing technologies to boost their productivity, improve product quality, and reduce labor costs. This is expected to boost the growth of the automotive manufacturing equipment industry.

Some widely used equipment in the auto sector include conveyor belts, bending machines, stamping presses, CNC machines, grinding machines, and drilling and milling machines. Similarly, welding robots, assembly robots, painting robots, and coordinate measuring machines (CMMs) are employed in the automotive industry.

Leading automotive equipment manufacturers are expanding their product portfolios by launching advanced technologies, including smart robots and advanced CNC machines, to meet growing demand for the auto sector. For instance,

  • In November 2023, Yaskawa Electric Corporation introduced the MOTOMAN NEXT series to realize a new industrial automation revolution. The new generation of robots has autonomous adaptivity to the environment and makes judgments.

Other Factors Boosting the Automotive Manufacturing Equipment Market Growth

  • Rising production and sales of passenger and commercial vehicles globally
  • Growing adoption of smart and connected technologies, like advanced robotics and automation systems, in the automotive industry to improve efficiency, reduce production time, and enhance overall quality
  • Rising popularity of collaborative robots (cobots) in automotive manufacturing
  • Growing importance of flexible manufacturing systems in the automotive industry
  • Increasing investments in automotive assembly line equipment as well as automotive welding equipment
Attributes Key Insights
Base Market Value (2023) US$ 6.0 billion
Estimated Global Automotive Manufacturing Equipment Market Value (2024E) US$ 6.8 billion
Projected Automotive Manufacturing Equipment Market Revenue (2034F) US$ 19.4 billion
Value-based CAGR (2024 to 2034) 11.1%

Don't pay for what you don't need

Customize your report by selecting specific countries or regions and save 30%!

Global Automotive Manufacturing Equipment Market Trends

Rapid Penetration of Automation is a Key Market-shaping Trend

  • Integration of Industry 4.0 technologies like IoT, AI, and data analytics in the auto sector to create smart and connected manufacturing environments for better decision-making and real-time monitoring
  • Rising emphasis of automotive manufacturers to enhance operational efficiency and reduce production costs
  • Adoption of 3D printing and additive manufacturing technologies
  • Growing popularity of electric and autonomous vehicles
  • Rise of ‘Dark Factories’ or inclination towards ‘Lights Out Manufacturing’

Historical Vs. Future Automotive Manufacturing Equipment Market Insights

Global sales of automotive manufacturing equipment grew at a CAGR of 13.8% from 2019 to 2023. Total market valuation at the end of 2023 reached about US$ 6.0 billion. Over the forecast period, the global market for automotive manufacturing equipment is set to grow at 11.1% CAGR.

During the historical period, top automakers increasingly adopted automation due to the labor shortage caused by the COVID-19 pandemic. For instance, they employed automotive welding equipment, robotic manufacturing systems, and automotive painting equipment. As a result, the demand for automotive manufacturing equipment grew rapidly.

In the assessment period, factors like the growing adoption of smart manufacturing practices and rising demand for autonomous vehicles are expected to boost the automotive manufacturing equipment market growth. Similarly, advancements in CNC machines and robotic manufacturing systems will benefit the market.

Governments across the world are enforcing stringent regulations and emission standards to promote sustainable practices and address environmental issues. Compliance with these regulations often necessitates using novel manufacturing equipment in the automotive industry, fueling their demand.

Nikhil Kaitwade
Nikhil Kaitwade

Principal Consultant

Talk to Analyst

Find your sweet spots for generating winning opportunities in this market.

Semi-annual Market Update

Particular Value CAGR
H1 10.9% (2023 to 2033)
H2 10.7% (2023 to 2033)
H1 11.8% (2024 to 2034)
H2 10.8% (2024 to 2034)

Insights into Key Trends

  • Growing Emphasis on Lightweight Materials

Rising demand for fuel-efficient vehicles and growing environmental concerns are prompting the automotive sector to utilize lightweight materials like carbon fiber, aluminum, and advanced composites. This is expected to boost the target market as the adoption of these materials requires specialized manufacturing equipment to handle their unique properties.

  • Transition toward Electric and Hybrid Vehicles

There is a gradual transition from traditional internal combustion engine vehicles towards electric and hybrid ones. This is anticipated to uplift demand for automotive manufacturing equipment as these vehicles require different assembly processes and equipment.

To capitalize on this trend and boost their sales, top companies are introducing advanced automotive production machinery and robots. For instance, in April 2020, YASKAWA launched a shelf-type robot called MOTOMAN-GP300R. The new robot lineup will help companies shorten the line length to save space and construct high-value lines during the assembly process of lightweight vehicles or environmentally friendly vehicles.

Get the data you need at a Fraction of the cost

Personalize your report by choosing insights you need
and save 40%!

Comparative View of Adjacent Automotive Manufacturing Equipment Markets

The global automotive is likely to be impacted by the peer or tangential markets in the automotive division. These include the automotive test equipment market and the automotive OEM industry. Drivers and trends are thoroughly analyzed to find business opportunities in all these markets.

The global automotive manufacturing equipment industry is poised to grow at a higher rate than the other related industries. This growth is expected to be propelled by surging demand for vehicles, especially electric ones, high adoption of robotic manufacturing systems, and rising demand for press machines for car manufacturing.

The growing need for automotive inspection systems is expected to propel sales of automotive test equipment during the forecast period. Similarly, escalating demand for vehicles and the adoption of advanced manufacturing technology in the auto sector will likely boost the automotive OEM market.

Automotive Manufacturing Equipment Market Analysis:

Attributes Automotive Manufacturing Equipment Industry Outlook
CAGR (2024 to 2034) 11.1%
Growth Factor Rising demand for vehicles is expected to boost growth of the automotive manufacturing equipment market.
Market Trend The transition toward electric vehicles is emerging as a key market-shaping trend.

Automotive Test Equipment Market Outlook:

Attributes Automotive Test Equipment Sales Forecast
CAGR (2024 to 2034) 4.3%
Growth Factor The rising need for specialized testing equipment in the automotive sector to ensure safety, performance, and compliance with regulations is expected to boost the market.
Market Trend Increasing sales of electric and autonomous vehicles will likely expand the automotive test equipment market size.

Automotive Original Equipment Manufacturer (OEM) Market Analysis:

Attributes Automotive Original Equipment Manufacturer (OEM) Market Outlook
CAGR (2024 to 2034) 4.17%
Growth Factor Increasing demand for passenger and commercial vehicles globally is expected to boost the automotive OEM market.
Market Trend A key trend observed in the market is the growing popularity of electric vehicles.

Country-wise Insights

The table below highlights the automotive manufacturing equipment market revenue in top nations. The United States, China, and Japan are expected to remain the top three consumers of automotive production machinery, with expected valuations of US$ 3.5 billion, US$ 3.2 billion, and US$ 2.1 billion, respectively, in 2034.

Countries Estimated Automotive Manufacturing Equipment Market Value (2034)
United States US$ 3.5 billion
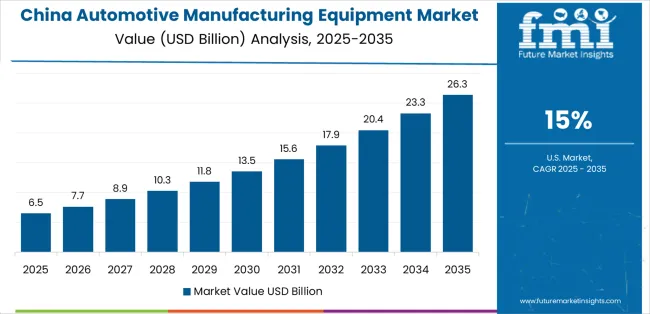
China US$ 3.2 billion
Japan US$ 2.1 billion
South Korea US$ 1.2 billion
United Kingdom US$ 795.1 million

The below table shows the estimated growth rates of the top countries. South Korea, the United Kingdom, and China are set to record high CAGRs of 13.3%, 12.3%, and 12.1%, respectively, through 2034.

Robust growth of the automotive industry across these countries is a key factor boosting the automotive manufacturing equipment market. Similarly, these countries are witnessing rising adoption of automation and digital twin technology, creating growth opportunities for automotive manufacturing equipment manufacturers.

Countries Expected Automotive Manufacturing Equipment Market CAGR (2024 to 2034)
United States 11.3%
China 12.1%
Japan 11.9%
South Korea 13.3%
United Kingdom 12.3%

Rising Adoption of Industry 4.0 in the United States Propelling Demand

The United States automotive manufacturing equipment market size is projected to reach US$ 3.5 billion in 2034. It will continue to dominate the global market, with overall demand for automotive manufacturing equipment rising at 11.3% CAGR throughout the forecast period. Some of the key drivers/trends include:

  • Increasing adoption of Industry 4.0 technologies like automation, artificial intelligence (AI), and robotics in the automotive sector
  • Growing demand for environmentally friendly vehicles, including electric vehicles, fuel cell vehicles, and hybrid vehicles
  • Rising emphasis of United States-based automakers on improving efficiency and productivity in their manufacturing operations
  • Surging popularity of robotic automotive automation manufacturing solutions
  • Increasing labor costs

Advanced technologies like automation and robotics are gaining immense traction across industries like manufacturing and automotive in the United States. These technologies help industries increase productivity while reducing labor requirements. This is expected to drive demand for automotive manufacturing equipment in the nation.

Several automakers in the United States are employing robots for welding, painting, and assembly tasks. As per the International Federation of Robotics (IFR), around 30787 industrial robot units were installed in the United States during 2020. Thus, the growing adoption of robots will likely play a key role in fostering the growth of the automotive manufacturing market through 2034.

The strong presence of top automotive manufacturers and rising government support are expected to positively impact sales of automotive manufacturing equipment. Similarly, the growing popularity of electric and hybrid vehicles will likely improve the nation’s automotive manufacturing equipment market share through 2034.

Booming Automotive Sector Fueling Sales in China

As per the latest analysis, sales of automotive manufacturing equipment in China are projected to soar at 12.1% CAGR during the forecast period. By 2034, China's automotive manufacturing equipment market value is set to total US$ 3.2 billion, driven by factors like:

  • Flourishing the automotive industry
  • Increasing penetration of automation and other Industry 4.0 technologies in the auto sector to improve efficiency, quality, and productivity
  • Rising export of vehicles as well as robots
  • Growing support for the government
  • Increasing importance of automotive assembly line equipment and robotic manufacturing systems

When it comes to automotive manufacturing, China leads from the forefront. It is the world’s leading automotive market and is set to witness robust growth owing to rising vehicle demand. This, in turn, is expected to fuel sales of sophisticated automotive manufacturing equipment.

An increasing push from the government for industrial automation is acting as a catalyst fueling the growth of China's automotive manufacturing equipment industry. Various initiatives and policies are being launched in China to promote the production and usage of robotics.

For instance, China introduced a five-year plan in 2021 to transform the country into a global robotics innovation hub by 2025. From the electronics to the automotive sector, manufacturers constantly embrace automation and robotics. This will likely foster market growth through 2034.

China is home to several leading robot manufacturing companies. As per the U.S. International Trade Commission, there are around 7,000 robotics companies in China. Easy accessibility and reduction in robot prices are expected to benefit China market during the forecast period.
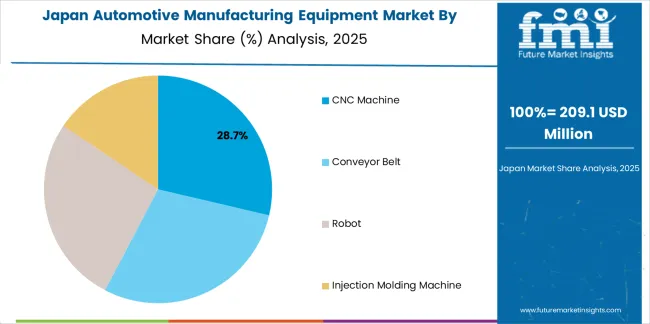
Rapid Transition toward Electric Vehicles Spurring Market Growth in Japan

Japan’s automotive manufacturing equipment market is poised to exhibit a CAGR of 11.9% during the forecast period. It will likely attain a valuation of US$ 2.1 billion by 2034. This is attributable to factors like:

  • Transition towards electric and hybrid vehicles
  • Growing demand for lightweight materials
  • Increasing adoption of automation in the auto sector
  • Ongoing innovation in automotive manufacturing equipment like robots and CNC machines
  • Rising need for automotive testing equipment and smart manufacturing
  • Growing need for advanced automotive machine tools

Amid rising environmental concerns and the implementation of stringent regulations, Japan’s automotive industry is embracing electrification. This is expected to drive demand for advanced automotive manufacturing technologies.

Electric and hybrid vehicles are gaining wider popularity in the country, which is expected to boost the growth of the automotive manufacturing equipment market. This is because these vehicles require different processes and equipment than traditional internal combustion engine vehicles.

Category-wise Insights

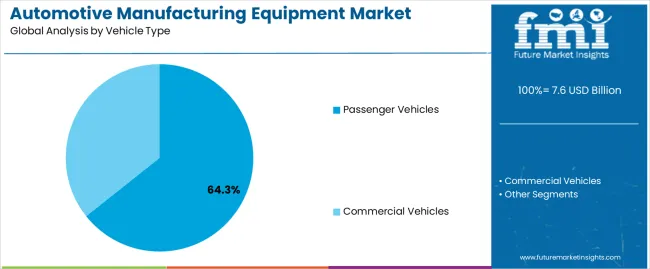
The section below offers profound insights into top segments and their respective growth rates for the assessment period. Based on equipment type, the conveyor belt segment is set to grow at a robust CAGR of 11.0% through 2034. By vehicle type, the passenger vehicles segment will likely exhibit a CAGR of 10.5% during the forecast period.

Top Segment Conveyor Belt (Equipment Type)
Estimated CAGR (2024 to 2034) 11.0%

Conveyor Belt Remains Highly Sought-after Equipment Type

As per the latest analysis, conveyor belts remain the most sought-after equipment type in the automotive industry. The target segment is projected to grow at a robust CAGR of 11.0% during the forecast period.

The rising usage of conveyor belts for moving materials and parts around automotive factories is a key factor driving the growth of the target segment. Conveyors automate the movement of parts and vehicles, thereby streamlining production flow and reducing labor costs. They operate continuously, maximizing throughput and minimizing downtime.

  • As the auto sector continues to develop and improve, so too does the need for efficient manufacturing processes. It becomes essential for automotive companies to utilize equipment like conveyor systems to minimize overhead expenses amid rising labor costs. This will likely uplift conveyor belt demand during the forecast period.
  • Conveyor belts are gaining wider popularity in the automotive sector due to their simplicity, versatility, and low cost.
  • The universality of conveyor belts across various stages compared to equipment with more specific functions contributed to their higher overall demand. They are used throughout the entire automotive assembly process, from transporting raw materials to finished vehicles.
  • Depending on production needs, conveyor belts can be easily adapted to different configurations and lengths. This modularity allows automotive manufacturers to adjust their conveyor systems without significant equipment overhauls, further driving demand.
  • Another factor fueling sales of conveyor belts is their easy integration with automation. Modern conveyor belts can be integrated with automation systems for efficient control and material handling.
  • Top automotive equipment manufacturers are responding to this growing demand by introducing durable, easy-to-install conveyor belts. New conveyor belts made with durable materials and requiring minimal maintenance are entering the market.

Demand for robots is also expected to increase significantly during the assessment period. This is attributable to the increasing installation of robots in the automotive sector to handle various tasks due to their efficiency and versatility.

Leading automotive giants are increasingly employing robots, including articulated robots, in their facilities to improve safety and productivity as well as reduce labor costs. Robots are expected to replace around 20 million jobs by 2030, as per the Oxford Economics. This will create lucrative growth opportunities for automotive manufacturing equipment companies.

As robotic technology continues to advance, the role of robots in automotive manufacturing is set to grow even further. Hence, the robot segment will likely record strong growth during the assessment period.

Passenger Vehicles Segment Leading the Charge in Fostering Market Growth

Top Segment Passenger Vehicles (Vehicle Type)
Estimated CAGR (2024 to 2034) 10.5%

Based on vehicle type, the passenger vehicles segment is expected to grow at a CAGR of 10.5% during the assessment period. As a result, it will generate lucrative growth opportunities for automotive manufacturing equipment companies.
  • Rising demand for passenger vehicles globally is a key factor expected to drive the target segment during the forecast period.
  • Passenger vehicles represent a significantly larger market globally than commercial vehicles. This translates to a higher demand for equipment dedicated to their production.
  • Passenger cars also have shorter lifespans and see higher replacement rates than commercial vehicles. This leads to a constant need for new vehicle production and supporting equipment.
  • Passenger cars like SUVs and sedans have specific manufacturing requirements. This is driving demand for specialized equipment, thereby fostering the growth of the target segment.
  • The emergence of new technologies like advanced driver-assistance systems (ADAS), electric vehicles, and autonomous driving in the passenger vehicle segment will necessitate investments in specialized equipment.

Competitive Landscape

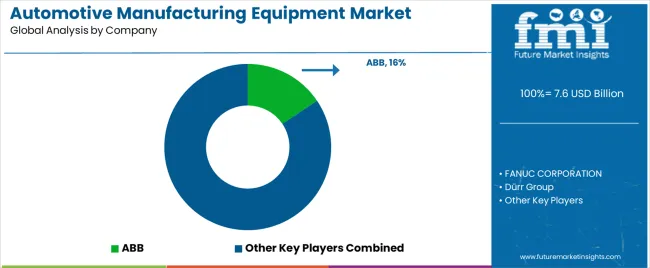
The automotive manufacturing equipment market is highly competitive due to the presence of several players. Top manufacturers of automotive equipment are constantly innovating to develop novel solutions integrated with advanced technologies. For instance, they are introducing advanced automotive robots and CNC machines.

Many automotive production machinery companies are also employing strategies like partnerships, facility expansions, acquisitions, mergers, and collaborations. These strategies will help them boost their revenue and gain a competitive edge in the market. Similarly, they are participating in exhibitions and other events to expand their customer reach.

Recent Developments in the Automotive Manufacturing Equipment Market

  • In 2022, FANUC, a prominent leader in robots, CNCs, and ROBOMACHINEs, unveiled its latest automation solutions, including new robots, cobots, and factory automation technologies at IMTS.
  • In June 2023, Nidec Machine Tool Corporation announced the establishment of a new cutting tool factory in India to meet rising demand for automotive and related components. The new factory will increase the company’s production capacity by 1.5X and will produce pinion cutters, hob cutters, and other cutting tools.
  • In September 2020, KUKA received a major order from the Korea-based company SEOJIN Industrial for 185 KUKA robots. The company will use these robots to manufacture car parts.

Scope of the Report

Attribute Details
Estimated Market Value (2024) US$ 6.8 billion
Projected Market Value (2034) US$ 19.4 billion
Anticipated Growth Rate (2024 to 2034) 11.1% CAGR
Forecast Period 2024 to 2034
Historical Data Available for 2019 to 2023
Market Analysis Value (US$ billion), Volume (Units), and CAGR for 2024 to 2034
Key Regions Covered Latin America, North America, Western Europe, Eastern Europe, South Asia and Pacific, East Asia, and Middle East & Africa
Key Countries Covered Canada, United States, Mexico, Brazil, Chile, Peru, Argentina, Germany, France, Italy, Spain, United Kingdom, Netherlands, Belgium, Nordic, Russia, Poland, China, Japan, South Korea, India, Thailand, Malaysia, Indonesia, Singapore, Australia, New Zealand, GCC Countries, South Africa, Central Africa, and others
Key Market Segments Covered Equipment Type, Vehicle Type, and Region
Key Companies Profiled
  • ABB
  • FANUC CORPORATION
  • KUKA AG
  • Dürr Group
  • AMADA CO
  • Yaskawa Electric Corporation
  • Kawasaki Heavy Industries
  • Schuler Group

Automotive Manufacturing Equipment Market by Category

By Equipment Type:

  • Conveyor Belt
  • CNC Machine
  • Robot
  • Injection Molding Machine

By Vehicle Type:

  • Passenger Vehicles
  • Commercial Vehicles

By Region:

  • North America
  • Latin America
  • Western Europe
  • Eastern Europe
  • East Asia
  • South Asia and Pacific
  • Middle East and Africa

Frequently Asked Questions

How big is the automotive manufacturing equipment market?

The global market value is estimated to total US$ 6.8 billion in 2024.

What is the expected market size in 2034?

The global automotive manufacturing equipment market size is set to reach US$ 19.4 billion by 2034.

What is the demand outlook for automotive manufacturing equipment?

Global demand is projected to rise at 11.1% CAGR through 2034.

What equipment is used in the automotive industry?

Conveyor belts, robots, CNC machines, and jig welders, among others

What was the historical CAGR of the global market?

The global market registered a CAGR of 13.8% from 2019 to 2023.

What is the market size of the automotive manufacturing industry in China?

China's market size is expected to reach US$ 3.2 billion in 2034.

Table of Content

1. Executive Summary

    1.1. Global Market Outlook

    1.2. Demand-side Trends

    1.3. Supply-side Trends

    1.4. Technology Roadmap Analysis

    1.5. Analysis and Recommendations

2. Market Overview

    2.1. Market Coverage / Taxonomy

    2.2. Market Definition / Scope / Limitations

3. Market Background

    3.1. Market Dynamics

        3.1.1. Drivers

        3.1.2. Restraints

        3.1.3. Opportunity

        3.1.4. Trends

    3.2. Scenario Forecast

        3.2.1. Demand in Optimistic Scenario

        3.2.2. Demand in Likely Scenario

        3.2.3. Demand in Conservative Scenario

    3.3. Opportunity Map Analysis

    3.4. Product Life Cycle Analysis

    3.5. Supply Chain Analysis

        3.5.1. Supply Side Participants and their Roles

            3.5.1.1. Producers

            3.5.1.2. Mid-Level Participants (Traders/ Agents/ Brokers)

            3.5.1.3. Wholesalers and Distributors

        3.5.2. Value Added and Value Created at Node in the Supply Chain

        3.5.3. List of Raw Material Suppliers

        3.5.4. List of Existing and Potential Buyer’s

    3.6. Investment Feasibility Matrix

    3.7. Value Chain Analysis

        3.7.1. Profit Margin Analysis

        3.7.2. Wholesalers and Distributors

        3.7.3. Retailers

    3.8. PESTLE and Porter’s Analysis

    3.9. Regulatory Landscape

        3.9.1. By Key Regions

        3.9.2. By Key Countries

    3.10. Regional Parent Market Outlook

    3.11. Production and Consumption Statistics

    3.12. Import and Export Statistics

4. Global Market Analysis 2019 to 2023 and Forecast, 2024 to 2034

    4.1. Historical Market Size Value (US$ billion) & Volume (Units) Analysis, 2019 to 2023

    4.2. Current and Future Market Size Value (US$ billion) & Volume (Units) Projections, 2024 to 2034

        4.2.1. Y-o-Y Growth Trend Analysis

        4.2.2. Absolute $ Opportunity Analysis

5. Global Market Analysis 2019 to 2023 and Forecast 2024 to 2034, By Equipment Type

    5.1. Introduction / Key Findings

    5.2. Historical Market Size Value (US$ billion) & Volume (Units) Analysis By Equipment Type, 2019 to 2023

    5.3. Current and Future Market Size Value (US$ billion) & Volume (Units) Analysis and Forecast By Equipment Type, 2024 to 2034

        5.3.1. Conveyor Belt

        5.3.2. CNC Machine

        5.3.3. Robot

        5.3.4. Injection Molding Machine

    5.4. Y-o-Y Growth Trend Analysis By Equipment Type, 2019 to 2023

    5.5. Absolute $ Opportunity Analysis By Equipment Type, 2024 to 2034

6. Global Market Analysis 2019 to 2023 and Forecast 2024 to 2034, By Vehicle Type

    6.1. Introduction / Key Findings

    6.2. Historical Market Size Value (US$ billion) & Volume (Units) Analysis By Vehicle Type, 2019 to 2023

    6.3. Current and Future Market Size Value (US$ billion) & Volume (Units) Analysis and Forecast By Vehicle Type, 2024 to 2034

        6.3.1. Passenger Vehicles

        6.3.2. Commercial Vehicles

    6.4. Y-o-Y Growth Trend Analysis By Vehicle Type, 2019 to 2023

    6.5. Absolute $ Opportunity Analysis By Vehicle Type, 2024 to 2034

7. Global Market Analysis 2019 to 2023 and Forecast 2024 to 2034, By Region

    7.1. Introduction

    7.2. Historical Market Size Value (US$ billion) & Volume (Units) Analysis By Region, 2019 to 2023

    7.3. Current Market Size Value (US$ billion) & Volume (Units) Analysis and Forecast By Region, 2024 to 2034

        7.3.1. North America

        7.3.2. Latin America

        7.3.3. Western Europe

        7.3.4. Eastern Europe

        7.3.5. South Asia and Pacific

        7.3.6. East Asia

        7.3.7. Middle East and Africa

    7.4. Market Attractiveness Analysis By Region

8. North America Market Analysis 2019 to 2023 and Forecast 2024 to 2034, By Country

    8.1. Historical Market Size Value (US$ billion) & Volume (Units) Trend Analysis By Market Taxonomy, 2019 to 2023

    8.2. Market Size Value (US$ billion) & Volume (Units) Forecast By Market Taxonomy, 2024 to 2034

        8.2.1. By Country

            8.2.1.1. United States

            8.2.1.2. Canada

        8.2.2. By Equipment Type

        8.2.3. By Vehicle Type

    8.3. Market Attractiveness Analysis

        8.3.1. By Country

        8.3.2. By Equipment Type

        8.3.3. By Vehicle Type

    8.4. Key Takeaways

9. Latin America Market Analysis 2019 to 2023 and Forecast 2024 to 2034, By Country

    9.1. Historical Market Size Value (US$ billion) & Volume (Units) Trend Analysis By Market Taxonomy, 2019 to 2023

    9.2. Market Size Value (US$ billion) & Volume (Units) Forecast By Market Taxonomy, 2024 to 2034

        9.2.1. By Country

            9.2.1.1. Brazil

            9.2.1.2. Mexico

            9.2.1.3. Rest of Latin America

        9.2.2. By Equipment Type

        9.2.3. By Vehicle Type

    9.3. Market Attractiveness Analysis

        9.3.1. By Country

        9.3.2. By Equipment Type

        9.3.3. By Vehicle Type

    9.4. Key Takeaways

10. Western Europe Market Analysis 2019 to 2023 and Forecast 2024 to 2034, By Country

    10.1. Historical Market Size Value (US$ billion) & Volume (Units) Trend Analysis By Market Taxonomy, 2019 to 2023

    10.2. Market Size Value (US$ billion) & Volume (Units) Forecast By Market Taxonomy, 2024 to 2034

        10.2.1. By Country

            10.2.1.1. Germany

            10.2.1.2. United Kingdom

            10.2.1.3. France

            10.2.1.4. Spain

            10.2.1.5. Italy

            10.2.1.6. Rest of Western Europe

        10.2.2. By Equipment Type

        10.2.3. By Vehicle Type

    10.3. Market Attractiveness Analysis

        10.3.1. By Country

        10.3.2. By Equipment Type

        10.3.3. By Vehicle Type

    10.4. Key Takeaways

11. Eastern Europe Market Analysis 2019 to 2023 and Forecast 2024 to 2034, By Country

    11.1. Historical Market Size Value (US$ billion) & Volume (Units) Trend Analysis By Market Taxonomy, 2019 to 2023

    11.2. Market Size Value (US$ billion) & Volume (Units) Forecast By Market Taxonomy, 2024 to 2034

        11.2.1. By Country

            11.2.1.1. Poland

            11.2.1.2. Russia

            11.2.1.3. Czech Republic

            11.2.1.4. Romania

            11.2.1.5. Rest of Eastern Europe

        11.2.2. By Equipment Type

        11.2.3. By Vehicle Type

    11.3. Market Attractiveness Analysis

        11.3.1. By Country

        11.3.2. By Equipment Type

        11.3.3. By Vehicle Type

    11.4. Key Takeaways

12. South Asia and Pacific Market Analysis 2019 to 2023 and Forecast 2024 to 2034, By Country

    12.1. Historical Market Size Value (US$ billion) & Volume (Units) Trend Analysis By Market Taxonomy, 2019 to 2023

    12.2. Market Size Value (US$ billion) & Volume (Units) Forecast By Market Taxonomy, 2024 to 2034

        12.2.1. By Country

            12.2.1.1. India

            12.2.1.2. Bangladesh

            12.2.1.3. Australia

            12.2.1.4. New Zealand

            12.2.1.5. Rest of South Asia and Pacific

        12.2.2. By Equipment Type

        12.2.3. By Vehicle Type

    12.3. Market Attractiveness Analysis

        12.3.1. By Country

        12.3.2. By Equipment Type

        12.3.3. By Vehicle Type

    12.4. Key Takeaways

13. East Asia Market Analysis 2019 to 2023 and Forecast 2024 to 2034, By Country

    13.1. Historical Market Size Value (US$ billion) & Volume (Units) Trend Analysis By Market Taxonomy, 2019 to 2023

    13.2. Market Size Value (US$ billion) & Volume (Units) Forecast By Market Taxonomy, 2024 to 2034

        13.2.1. By Country

            13.2.1.1. China

            13.2.1.2. Japan

            13.2.1.3. South Korea

        13.2.2. By Equipment Type

        13.2.3. By Vehicle Type

    13.3. Market Attractiveness Analysis

        13.3.1. By Country

        13.3.2. By Equipment Type

        13.3.3. By Vehicle Type

    13.4. Key Takeaways

14. Middle East and Africa Market Analysis 2019 to 2023 and Forecast 2024 to 2034, By Country

    14.1. Historical Market Size Value (US$ billion) & Volume (Units) Trend Analysis By Market Taxonomy, 2019 to 2023

    14.2. Market Size Value (US$ billion) & Volume (Units) Forecast By Market Taxonomy, 2024 to 2034

        14.2.1. By Country

            14.2.1.1. GCC Countries

            14.2.1.2. South Africa

            14.2.1.3. Israel

            14.2.1.4. Rest of Middle East & Africa

        14.2.2. By Equipment Type

        14.2.3. By Vehicle Type

    14.3. Market Attractiveness Analysis

        14.3.1. By Country

        14.3.2. By Equipment Type

        14.3.3. By Vehicle Type

    14.4. Key Takeaways

15. Key Countries Market Analysis

    15.1. United States

        15.1.1. Pricing Analysis

        15.1.2. Market Share Analysis, 2024

            15.1.2.1. By Equipment Type

            15.1.2.2. By Vehicle Type

    15.2. Canada

        15.2.1. Pricing Analysis

        15.2.2. Market Share Analysis, 2024

            15.2.2.1. By Equipment Type

            15.2.2.2. By Vehicle Type

    15.3. Brazil

        15.3.1. Pricing Analysis

        15.3.2. Market Share Analysis, 2024

            15.3.2.1. By Equipment Type

            15.3.2.2. By Vehicle Type

    15.4. Mexico

        15.4.1. Pricing Analysis

        15.4.2. Market Share Analysis, 2024

            15.4.2.1. By Equipment Type

            15.4.2.2. By Vehicle Type

    15.5. Germany

        15.5.1. Pricing Analysis

        15.5.2. Market Share Analysis, 2024

            15.5.2.1. By Equipment Type

            15.5.2.2. By Vehicle Type

    15.6. United Kingdom

        15.6.1. Pricing Analysis

        15.6.2. Market Share Analysis, 2024

            15.6.2.1. By Equipment Type

            15.6.2.2. By Vehicle Type

    15.7. France

        15.7.1. Pricing Analysis

        15.7.2. Market Share Analysis, 2024

            15.7.2.1. By Equipment Type

            15.7.2.2. By Vehicle Type

    15.8. Spain

        15.8.1. Pricing Analysis

        15.8.2. Market Share Analysis, 2024

            15.8.2.1. By Equipment Type

            15.8.2.2. By Vehicle Type

    15.9. Italy

        15.9.1. Pricing Analysis

        15.9.2. Market Share Analysis, 2024

            15.9.2.1. By Equipment Type

            15.9.2.2. By Vehicle Type

    15.10. Poland

        15.10.1. Pricing Analysis

        15.10.2. Market Share Analysis, 2024

            15.10.2.1. By Equipment Type

            15.10.2.2. By Vehicle Type

    15.11. Russia

        15.11.1. Pricing Analysis

        15.11.2. Market Share Analysis, 2024

            15.11.2.1. By Equipment Type

            15.11.2.2. By Vehicle Type

    15.12. Czech Republic

        15.12.1. Pricing Analysis

        15.12.2. Market Share Analysis, 2024

            15.12.2.1. By Equipment Type

            15.12.2.2. By Vehicle Type

    15.13. Romania

        15.13.1. Pricing Analysis

        15.13.2. Market Share Analysis, 2024

            15.13.2.1. By Equipment Type

            15.13.2.2. By Vehicle Type

    15.14. India

        15.14.1. Pricing Analysis

        15.14.2. Market Share Analysis, 2024

            15.14.2.1. By Equipment Type

            15.14.2.2. By Vehicle Type

    15.15. Bangladesh

        15.15.1. Pricing Analysis

        15.15.2. Market Share Analysis, 2024

            15.15.2.1. By Equipment Type

            15.15.2.2. By Vehicle Type

    15.16. Australia

        15.16.1. Pricing Analysis

        15.16.2. Market Share Analysis, 2024

            15.16.2.1. By Equipment Type

            15.16.2.2. By Vehicle Type

    15.17. New Zealand

        15.17.1. Pricing Analysis

        15.17.2. Market Share Analysis, 2024

            15.17.2.1. By Equipment Type

            15.17.2.2. By Vehicle Type

    15.18. China

        15.18.1. Pricing Analysis

        15.18.2. Market Share Analysis, 2024

            15.18.2.1. By Equipment Type

            15.18.2.2. By Vehicle Type

    15.19. Japan

        15.19.1. Pricing Analysis

        15.19.2. Market Share Analysis, 2024

            15.19.2.1. By Equipment Type

            15.19.2.2. By Vehicle Type

    15.20. South Korea

        15.20.1. Pricing Analysis

        15.20.2. Market Share Analysis, 2024

            15.20.2.1. By Equipment Type

            15.20.2.2. By Vehicle Type

    15.21. GCC Countries

        15.21.1. Pricing Analysis

        15.21.2. Market Share Analysis, 2024

            15.21.2.1. By Equipment Type

            15.21.2.2. By Vehicle Type

    15.22. South Africa

        15.22.1. Pricing Analysis

        15.22.2. Market Share Analysis, 2024

            15.22.2.1. By Equipment Type

            15.22.2.2. By Vehicle Type

    15.23. Israel

        15.23.1. Pricing Analysis

        15.23.2. Market Share Analysis, 2024

            15.23.2.1. By Equipment Type

            15.23.2.2. By Vehicle Type

16. Market Structure Analysis

    16.1. Competition Dashboard

    16.2. Competition Benchmarking

    16.3. Market Share Analysis of Top Players

        16.3.1. By Regional

        16.3.2. By Equipment Type

        16.3.3. By Vehicle Type

17. Competition Analysis

    17.1. Competition Deep Dive

        17.1.1. ABB

            17.1.1.1. Overview

            17.1.1.2. Product Portfolio

            17.1.1.3. Profitability by Market Segments

            17.1.1.4. Sales Footprint

            17.1.1.5. Strategy Overview

                17.1.1.5.1. Marketing Strategy

                17.1.1.5.2. Product Strategy

                17.1.1.5.3. Channel Strategy

        17.1.2. FANUC CORPORATION

            17.1.2.1. Overview

            17.1.2.2. Product Portfolio

            17.1.2.3. Profitability by Market Segments

            17.1.2.4. Sales Footprint

            17.1.2.5. Strategy Overview

                17.1.2.5.1. Marketing Strategy

                17.1.2.5.2. Product Strategy

                17.1.2.5.3. Channel Strategy

        17.1.3. Dürr Group

            17.1.3.1. Overview

            17.1.3.2. Product Portfolio

            17.1.3.3. Profitability by Market Segments

            17.1.3.4. Sales Footprint

            17.1.3.5. Strategy Overview

                17.1.3.5.1. Marketing Strategy

                17.1.3.5.2. Product Strategy

                17.1.3.5.3. Channel Strategy

        17.1.4. KUKA AG

            17.1.4.1. Overview

            17.1.4.2. Product Portfolio

            17.1.4.3. Profitability by Market Segments

            17.1.4.4. Sales Footprint

            17.1.4.5. Strategy Overview

                17.1.4.5.1. Marketing Strategy

                17.1.4.5.2. Product Strategy

                17.1.4.5.3. Channel Strategy

        17.1.5. AMADA CO

            17.1.5.1. Overview

            17.1.5.2. Product Portfolio

            17.1.5.3. Profitability by Market Segments

            17.1.5.4. Sales Footprint

            17.1.5.5. Strategy Overview

                17.1.5.5.1. Marketing Strategy

                17.1.5.5.2. Product Strategy

                17.1.5.5.3. Channel Strategy

        17.1.6. Yaskawa Electric Corporation

            17.1.6.1. Overview

            17.1.6.2. Product Portfolio

            17.1.6.3. Profitability by Market Segments

            17.1.6.4. Sales Footprint

            17.1.6.5. Strategy Overview

                17.1.6.5.1. Marketing Strategy

                17.1.6.5.2. Product Strategy

                17.1.6.5.3. Channel Strategy

        17.1.7. Kawasaki Heavy Industries

            17.1.7.1. Overview

            17.1.7.2. Product Portfolio

            17.1.7.3. Profitability by Market Segments

            17.1.7.4. Sales Footprint

            17.1.7.5. Strategy Overview

                17.1.7.5.1. Marketing Strategy

                17.1.7.5.2. Product Strategy

                17.1.7.5.3. Channel Strategy

        17.1.8. Schuler Group.

            17.1.8.1. Overview

            17.1.8.2. Product Portfolio

            17.1.8.3. Profitability by Market Segments

            17.1.8.4. Sales Footprint

            17.1.8.5. Strategy Overview

                17.1.8.5.1. Marketing Strategy

                17.1.8.5.2. Product Strategy

                17.1.8.5.3. Channel Strategy

18. Assumptions & Acronyms Used

19. Research Methodology

List of Tables

Table 1: Global Market Value (US$ billion) Forecast by Region, 2019 to 2034

Table 2: Global Market Volume (Units) Forecast by Region, 2019 to 2034

Table 3: Global Market Value (US$ billion) Forecast by Equipment Type, 2019 to 2034

Table 4: Global Market Volume (Units) Forecast by Equipment Type, 2019 to 2034

Table 5: Global Market Value (US$ billion) Forecast by Vehicle Type, 2019 to 2034

Table 6: Global Market Volume (Units) Forecast by Vehicle Type, 2019 to 2034

Table 7: North America Market Value (US$ billion) Forecast by Country, 2019 to 2034

Table 8: North America Market Volume (Units) Forecast by Country, 2019 to 2034

Table 9: North America Market Value (US$ billion) Forecast by Equipment Type, 2019 to 2034

Table 10: North America Market Volume (Units) Forecast by Equipment Type, 2019 to 2034

Table 11: North America Market Value (US$ billion) Forecast by Vehicle Type, 2019 to 2034

Table 12: North America Market Volume (Units) Forecast by Vehicle Type, 2019 to 2034

Table 13: Latin America Market Value (US$ billion) Forecast by Country, 2019 to 2034

Table 14: Latin America Market Volume (Units) Forecast by Country, 2019 to 2034

Table 15: Latin America Market Value (US$ billion) Forecast by Equipment Type, 2019 to 2034

Table 16: Latin America Market Volume (Units) Forecast by Equipment Type, 2019 to 2034

Table 17: Latin America Market Value (US$ billion) Forecast by Vehicle Type, 2019 to 2034

Table 18: Latin America Market Volume (Units) Forecast by Vehicle Type, 2019 to 2034

Table 19: Western Europe Market Value (US$ billion) Forecast by Country, 2019 to 2034

Table 20: Western Europe Market Volume (Units) Forecast by Country, 2019 to 2034

Table 21: Western Europe Market Value (US$ billion) Forecast by Equipment Type, 2019 to 2034

Table 22: Western Europe Market Volume (Units) Forecast by Equipment Type, 2019 to 2034

Table 23: Western Europe Market Value (US$ billion) Forecast by Vehicle Type, 2019 to 2034

Table 24: Western Europe Market Volume (Units) Forecast by Vehicle Type, 2019 to 2034

Table 25: Eastern Europe Market Value (US$ billion) Forecast by Country, 2019 to 2034

Table 26: Eastern Europe Market Volume (Units) Forecast by Country, 2019 to 2034

Table 27: Eastern Europe Market Value (US$ billion) Forecast by Equipment Type, 2019 to 2034

Table 28: Eastern Europe Market Volume (Units) Forecast by Equipment Type, 2019 to 2034

Table 29: Eastern Europe Market Value (US$ billion) Forecast by Vehicle Type, 2019 to 2034

Table 30: Eastern Europe Market Volume (Units) Forecast by Vehicle Type, 2019 to 2034

Table 31: South Asia and Pacific Market Value (US$ billion) Forecast by Country, 2019 to 2034

Table 32: South Asia and Pacific Market Volume (Units) Forecast by Country, 2019 to 2034

Table 33: South Asia and Pacific Market Value (US$ billion) Forecast by Equipment Type, 2019 to 2034

Table 34: South Asia and Pacific Market Volume (Units) Forecast by Equipment Type, 2019 to 2034

Table 35: South Asia and Pacific Market Value (US$ billion) Forecast by Vehicle Type, 2019 to 2034

Table 36: South Asia and Pacific Market Volume (Units) Forecast by Vehicle Type, 2019 to 2034

Table 37: East Asia Market Value (US$ billion) Forecast by Country, 2019 to 2034

Table 38: East Asia Market Volume (Units) Forecast by Country, 2019 to 2034

Table 39: East Asia Market Value (US$ billion) Forecast by Equipment Type, 2019 to 2034

Table 40: East Asia Market Volume (Units) Forecast by Equipment Type, 2019 to 2034

Table 41: East Asia Market Value (US$ billion) Forecast by Vehicle Type, 2019 to 2034

Table 42: East Asia Market Volume (Units) Forecast by Vehicle Type, 2019 to 2034

Table 43: Middle East and Africa Market Value (US$ billion) Forecast by Country, 2019 to 2034

Table 44: Middle East and Africa Market Volume (Units) Forecast by Country, 2019 to 2034

Table 45: Middle East and Africa Market Value (US$ billion) Forecast by Equipment Type, 2019 to 2034

Table 46: Middle East and Africa Market Volume (Units) Forecast by Equipment Type, 2019 to 2034

Table 47: Middle East and Africa Market Value (US$ billion) Forecast by Vehicle Type, 2019 to 2034

Table 48: Middle East and Africa Market Volume (Units) Forecast by Vehicle Type, 2019 to 2034

List of Charts

Figure 1: Global Market Value (US$ billion) by Equipment Type, 2024 to 2034

Figure 2: Global Market Value (US$ billion) by Vehicle Type, 2024 to 2034

Figure 3: Global Market Value (US$ billion) by Region, 2024 to 2034

Figure 4: Global Market Value (US$ billion) Analysis by Region, 2019 to 2034

Figure 5: Global Market Volume (Units) Analysis by Region, 2019 to 2034

Figure 6: Global Market Value Share (%) and BPS Analysis by Region, 2024 to 2034

Figure 7: Global Market Y-o-Y Growth (%) Projections by Region, 2024 to 2034

Figure 8: Global Market Value (US$ billion) Analysis by Equipment Type, 2019 to 2034

Figure 9: Global Market Volume (Units) Analysis by Equipment Type, 2019 to 2034

Figure 10: Global Market Value Share (%) and BPS Analysis by Equipment Type, 2024 to 2034

Figure 11: Global Market Y-o-Y Growth (%) Projections by Equipment Type, 2024 to 2034

Figure 12: Global Market Value (US$ billion) Analysis by Vehicle Type, 2019 to 2034

Figure 13: Global Market Volume (Units) Analysis by Vehicle Type, 2019 to 2034

Figure 14: Global Market Value Share (%) and BPS Analysis by Vehicle Type, 2024 to 2034

Figure 15: Global Market Y-o-Y Growth (%) Projections by Vehicle Type, 2024 to 2034

Figure 16: Global Market Attractiveness by Equipment Type, 2024 to 2034

Figure 17: Global Market Attractiveness by Vehicle Type, 2024 to 2034

Figure 18: Global Market Attractiveness by Region, 2024 to 2034

Figure 19: North America Market Value (US$ billion) by Equipment Type, 2024 to 2034

Figure 20: North America Market Value (US$ billion) by Vehicle Type, 2024 to 2034

Figure 21: North America Market Value (US$ billion) by Country, 2024 to 2034

Figure 22: North America Market Value (US$ billion) Analysis by Country, 2019 to 2034

Figure 23: North America Market Volume (Units) Analysis by Country, 2019 to 2034

Figure 24: North America Market Value Share (%) and BPS Analysis by Country, 2024 to 2034

Figure 25: North America Market Y-o-Y Growth (%) Projections by Country, 2024 to 2034

Figure 26: North America Market Value (US$ billion) Analysis by Equipment Type, 2019 to 2034

Figure 27: North America Market Volume (Units) Analysis by Equipment Type, 2019 to 2034

Figure 28: North America Market Value Share (%) and BPS Analysis by Equipment Type, 2024 to 2034

Figure 29: North America Market Y-o-Y Growth (%) Projections by Equipment Type, 2024 to 2034

Figure 30: North America Market Value (US$ billion) Analysis by Vehicle Type, 2019 to 2034

Figure 31: North America Market Volume (Units) Analysis by Vehicle Type, 2019 to 2034

Figure 32: North America Market Value Share (%) and BPS Analysis by Vehicle Type, 2024 to 2034

Figure 33: North America Market Y-o-Y Growth (%) Projections by Vehicle Type, 2024 to 2034

Figure 34: North America Market Attractiveness by Equipment Type, 2024 to 2034

Figure 35: North America Market Attractiveness by Vehicle Type, 2024 to 2034

Figure 36: North America Market Attractiveness by Country, 2024 to 2034

Figure 37: Latin America Market Value (US$ billion) by Equipment Type, 2024 to 2034

Figure 38: Latin America Market Value (US$ billion) by Vehicle Type, 2024 to 2034

Figure 39: Latin America Market Value (US$ billion) by Country, 2024 to 2034

Figure 40: Latin America Market Value (US$ billion) Analysis by Country, 2019 to 2034

Figure 41: Latin America Market Volume (Units) Analysis by Country, 2019 to 2034

Figure 42: Latin America Market Value Share (%) and BPS Analysis by Country, 2024 to 2034

Figure 43: Latin America Market Y-o-Y Growth (%) Projections by Country, 2024 to 2034

Figure 44: Latin America Market Value (US$ billion) Analysis by Equipment Type, 2019 to 2034

Figure 45: Latin America Market Volume (Units) Analysis by Equipment Type, 2019 to 2034

Figure 46: Latin America Market Value Share (%) and BPS Analysis by Equipment Type, 2024 to 2034

Figure 47: Latin America Market Y-o-Y Growth (%) Projections by Equipment Type, 2024 to 2034

Figure 48: Latin America Market Value (US$ billion) Analysis by Vehicle Type, 2019 to 2034

Figure 49: Latin America Market Volume (Units) Analysis by Vehicle Type, 2019 to 2034

Figure 50: Latin America Market Value Share (%) and BPS Analysis by Vehicle Type, 2024 to 2034

Figure 51: Latin America Market Y-o-Y Growth (%) Projections by Vehicle Type, 2024 to 2034

Figure 52: Latin America Market Attractiveness by Equipment Type, 2024 to 2034

Figure 53: Latin America Market Attractiveness by Vehicle Type, 2024 to 2034

Figure 54: Latin America Market Attractiveness by Country, 2024 to 2034

Figure 55: Western Europe Market Value (US$ billion) by Equipment Type, 2024 to 2034

Figure 56: Western Europe Market Value (US$ billion) by Vehicle Type, 2024 to 2034

Figure 57: Western Europe Market Value (US$ billion) by Country, 2024 to 2034

Figure 58: Western Europe Market Value (US$ billion) Analysis by Country, 2019 to 2034

Figure 59: Western Europe Market Volume (Units) Analysis by Country, 2019 to 2034

Figure 60: Western Europe Market Value Share (%) and BPS Analysis by Country, 2024 to 2034

Figure 61: Western Europe Market Y-o-Y Growth (%) Projections by Country, 2024 to 2034

Figure 62: Western Europe Market Value (US$ billion) Analysis by Equipment Type, 2019 to 2034

Figure 63: Western Europe Market Volume (Units) Analysis by Equipment Type, 2019 to 2034

Figure 64: Western Europe Market Value Share (%) and BPS Analysis by Equipment Type, 2024 to 2034

Figure 65: Western Europe Market Y-o-Y Growth (%) Projections by Equipment Type, 2024 to 2034

Figure 66: Western Europe Market Value (US$ billion) Analysis by Vehicle Type, 2019 to 2034

Figure 67: Western Europe Market Volume (Units) Analysis by Vehicle Type, 2019 to 2034

Figure 68: Western Europe Market Value Share (%) and BPS Analysis by Vehicle Type, 2024 to 2034

Figure 69: Western Europe Market Y-o-Y Growth (%) Projections by Vehicle Type, 2024 to 2034

Figure 70: Western Europe Market Attractiveness by Equipment Type, 2024 to 2034

Figure 71: Western Europe Market Attractiveness by Vehicle Type, 2024 to 2034

Figure 72: Western Europe Market Attractiveness by Country, 2024 to 2034

Figure 73: Eastern Europe Market Value (US$ billion) by Equipment Type, 2024 to 2034

Figure 74: Eastern Europe Market Value (US$ billion) by Vehicle Type, 2024 to 2034

Figure 75: Eastern Europe Market Value (US$ billion) by Country, 2024 to 2034

Figure 76: Eastern Europe Market Value (US$ billion) Analysis by Country, 2019 to 2034

Figure 77: Eastern Europe Market Volume (Units) Analysis by Country, 2019 to 2034

Figure 78: Eastern Europe Market Value Share (%) and BPS Analysis by Country, 2024 to 2034

Figure 79: Eastern Europe Market Y-o-Y Growth (%) Projections by Country, 2024 to 2034

Figure 80: Eastern Europe Market Value (US$ billion) Analysis by Equipment Type, 2019 to 2034

Figure 81: Eastern Europe Market Volume (Units) Analysis by Equipment Type, 2019 to 2034

Figure 82: Eastern Europe Market Value Share (%) and BPS Analysis by Equipment Type, 2024 to 2034

Figure 83: Eastern Europe Market Y-o-Y Growth (%) Projections by Equipment Type, 2024 to 2034

Figure 84: Eastern Europe Market Value (US$ billion) Analysis by Vehicle Type, 2019 to 2034

Figure 85: Eastern Europe Market Volume (Units) Analysis by Vehicle Type, 2019 to 2034

Figure 86: Eastern Europe Market Value Share (%) and BPS Analysis by Vehicle Type, 2024 to 2034

Figure 87: Eastern Europe Market Y-o-Y Growth (%) Projections by Vehicle Type, 2024 to 2034

Figure 88: Eastern Europe Market Attractiveness by Equipment Type, 2024 to 2034

Figure 89: Eastern Europe Market Attractiveness by Vehicle Type, 2024 to 2034

Figure 90: Eastern Europe Market Attractiveness by Country, 2024 to 2034

Figure 91: South Asia and Pacific Market Value (US$ billion) by Equipment Type, 2024 to 2034

Figure 92: South Asia and Pacific Market Value (US$ billion) by Vehicle Type, 2024 to 2034

Figure 93: South Asia and Pacific Market Value (US$ billion) by Country, 2024 to 2034

Figure 94: South Asia and Pacific Market Value (US$ billion) Analysis by Country, 2019 to 2034

Figure 95: South Asia and Pacific Market Volume (Units) Analysis by Country, 2019 to 2034

Figure 96: South Asia and Pacific Market Value Share (%) and BPS Analysis by Country, 2024 to 2034

Figure 97: South Asia and Pacific Market Y-o-Y Growth (%) Projections by Country, 2024 to 2034

Figure 98: South Asia and Pacific Market Value (US$ billion) Analysis by Equipment Type, 2019 to 2034

Figure 99: South Asia and Pacific Market Volume (Units) Analysis by Equipment Type, 2019 to 2034

Figure 100: South Asia and Pacific Market Value Share (%) and BPS Analysis by Equipment Type, 2024 to 2034

Figure 101: South Asia and Pacific Market Y-o-Y Growth (%) Projections by Equipment Type, 2024 to 2034

Figure 102: South Asia and Pacific Market Value (US$ billion) Analysis by Vehicle Type, 2019 to 2034

Figure 103: South Asia and Pacific Market Volume (Units) Analysis by Vehicle Type, 2019 to 2034

Figure 104: South Asia and Pacific Market Value Share (%) and BPS Analysis by Vehicle Type, 2024 to 2034

Figure 105: South Asia and Pacific Market Y-o-Y Growth (%) Projections by Vehicle Type, 2024 to 2034

Figure 106: South Asia and Pacific Market Attractiveness by Equipment Type, 2024 to 2034

Figure 107: South Asia and Pacific Market Attractiveness by Vehicle Type, 2024 to 2034

Figure 108: South Asia and Pacific Market Attractiveness by Country, 2024 to 2034

Figure 109: East Asia Market Value (US$ billion) by Equipment Type, 2024 to 2034

Figure 110: East Asia Market Value (US$ billion) by Vehicle Type, 2024 to 2034

Figure 111: East Asia Market Value (US$ billion) by Country, 2024 to 2034

Figure 112: East Asia Market Value (US$ billion) Analysis by Country, 2019 to 2034

Figure 113: East Asia Market Volume (Units) Analysis by Country, 2019 to 2034

Figure 114: East Asia Market Value Share (%) and BPS Analysis by Country, 2024 to 2034

Figure 115: East Asia Market Y-o-Y Growth (%) Projections by Country, 2024 to 2034

Figure 116: East Asia Market Value (US$ billion) Analysis by Equipment Type, 2019 to 2034

Figure 117: East Asia Market Volume (Units) Analysis by Equipment Type, 2019 to 2034

Figure 118: East Asia Market Value Share (%) and BPS Analysis by Equipment Type, 2024 to 2034

Figure 119: East Asia Market Y-o-Y Growth (%) Projections by Equipment Type, 2024 to 2034

Figure 120: East Asia Market Value (US$ billion) Analysis by Vehicle Type, 2019 to 2034

Figure 121: East Asia Market Volume (Units) Analysis by Vehicle Type, 2019 to 2034

Figure 122: East Asia Market Value Share (%) and BPS Analysis by Vehicle Type, 2024 to 2034

Figure 123: East Asia Market Y-o-Y Growth (%) Projections by Vehicle Type, 2024 to 2034

Figure 124: East Asia Market Attractiveness by Equipment Type, 2024 to 2034

Figure 125: East Asia Market Attractiveness by Vehicle Type, 2024 to 2034

Figure 126: East Asia Market Attractiveness by Country, 2024 to 2034

Figure 127: Middle East and Africa Market Value (US$ billion) by Equipment Type, 2024 to 2034

Figure 128: Middle East and Africa Market Value (US$ billion) by Vehicle Type, 2024 to 2034

Figure 129: Middle East and Africa Market Value (US$ billion) by Country, 2024 to 2034

Figure 130: Middle East and Africa Market Value (US$ billion) Analysis by Country, 2019 to 2034

Figure 131: Middle East and Africa Market Volume (Units) Analysis by Country, 2019 to 2034

Figure 132: Middle East and Africa Market Value Share (%) and BPS Analysis by Country, 2024 to 2034

Figure 133: Middle East and Africa Market Y-o-Y Growth (%) Projections by Country, 2024 to 2034

Figure 134: Middle East and Africa Market Value (US$ billion) Analysis by Equipment Type, 2019 to 2034

Figure 135: Middle East and Africa Market Volume (Units) Analysis by Equipment Type, 2019 to 2034

Figure 136: Middle East and Africa Market Value Share (%) and BPS Analysis by Equipment Type, 2024 to 2034

Figure 137: Middle East and Africa Market Y-o-Y Growth (%) Projections by Equipment Type, 2024 to 2034

Figure 138: Middle East and Africa Market Value (US$ billion) Analysis by Vehicle Type, 2019 to 2034

Figure 139: Middle East and Africa Market Volume (Units) Analysis by Vehicle Type, 2019 to 2034

Figure 140: Middle East and Africa Market Value Share (%) and BPS Analysis by Vehicle Type, 2024 to 2034

Figure 141: Middle East and Africa Market Y-o-Y Growth (%) Projections by Vehicle Type, 2024 to 2034

Figure 142: Middle East and Africa Market Attractiveness by Equipment Type, 2024 to 2034

Figure 143: Middle East and Africa Market Attractiveness by Vehicle Type, 2024 to 2034

Figure 144: Middle East and Africa Market Attractiveness by Country, 2024 to 2034

Recommendations

Automotive

Non OEM EV MRO Market

Published : January 2023

Automotive

Automotive OEM Market

Published : December 2022

Automotive

Automotive Test Equipment Market

Published : October 2022

Explore Automotive Insights

View Reports

Automotive Manufacturing Equipment Market