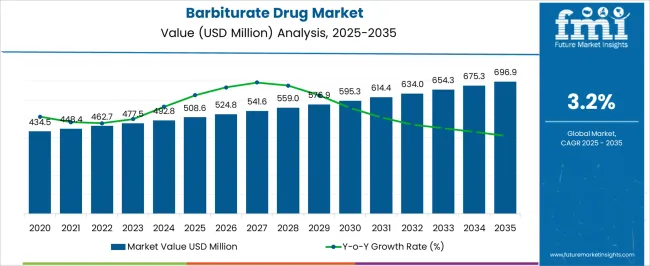
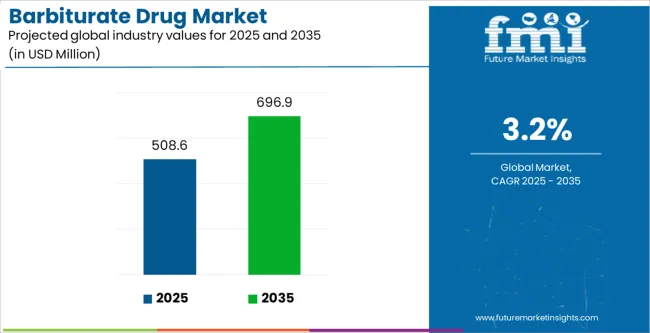
The Barbiturate Drug Market is estimated to be valued at USD 508.6 million in 2025 and is projected to reach USD 696.9 million by 2035, registering a compound annual growth rate (CAGR) of 3.2% over the forecast period.
| Metric | Value |
|---|---|
| Barbiturate Drug Market Estimated Value in (2025 E) | USD 508.6 million |
| Barbiturate Drug Market Forecast Value in (2035 F) | USD 696.9 million |
| Forecast CAGR (2025 to 2035) | 3.2% |
The barbiturate drug market is expanding steadily, driven by their continued therapeutic use in neurological and psychiatric disorders despite the growing presence of alternative treatments. Industry updates and clinical literature have indicated that barbiturates maintain a role in certain therapeutic areas, particularly for sedation, seizure management, and insomnia, where their efficacy and rapid onset remain valuable.
Regulatory filings and pharmaceutical press releases have shown that product formulations and dosage innovations are aimed at improving safety profiles and minimizing risks associated with dependency. Additionally, hospitals and specialty care centers have sustained demand for barbiturates in controlled environments where patient monitoring is rigorous.
Global prescription trends suggest that while usage has declined in some markets due to safety concerns, barbiturates continue to be integrated into treatment protocols where alternatives are less effective or contraindicated. Looking forward, growth is expected to be supported by ongoing clinical reliance in specific conditions, expanding hospital pharmacy distribution, and heightened demand for long-acting formulations that provide consistent therapeutic outcomes.
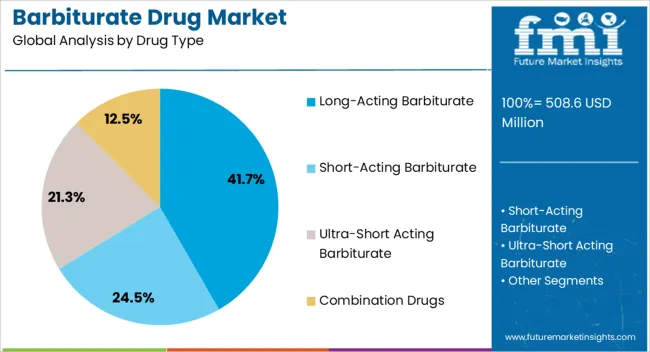
The Long-Acting Barbiturate segment is projected to account for 41.7% of the barbiturate drug market revenue in 2025, reflecting its importance in sustained therapeutic applications. Growth in this segment has been supported by the demand for longer duration sedative and hypnotic effects in conditions such as chronic insomnia and seizure disorders.
Clinical reports have highlighted the preference for long-acting agents where steady plasma concentrations provide extended relief without frequent dosing. Hospital protocols have also integrated long-acting barbiturates in cases where stable sedation is required for intensive care or preoperative management.
Pharmaceutical manufacturers have emphasized consistent quality control and regulatory compliance to address safety concerns, thereby reinforcing physician confidence in prescribing long-acting options. Despite regulatory caution over misuse potential, the clinical utility of long-acting barbiturates in carefully monitored environments has secured their significant share within the market.
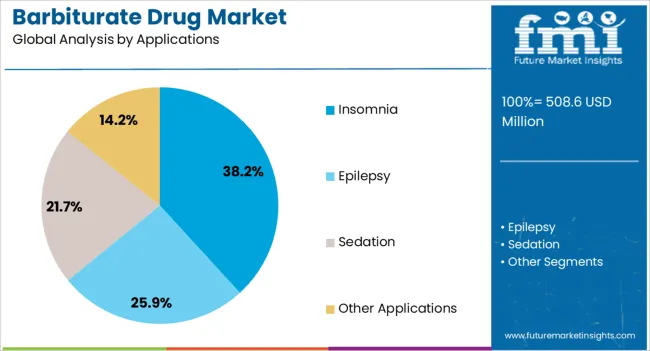
The Insomnia segment is expected to contribute 38.2% of the barbiturate drug market revenue in 2025, sustaining its position as a leading therapeutic application. This growth has been attributed to the rising global prevalence of sleep disorders linked to stress, lifestyle changes, and aging populations.
Clinical data and healthcare surveys have documented continued prescription of barbiturates in cases where alternative hypnotics are ineffective or contraindicated. Barbiturates have remained effective in inducing sleep rapidly and maintaining sleep continuity, which has preserved their demand in specific patient groups.
Hospitals and clinics have also noted that barbiturates are utilized in controlled doses to reduce risks associated with long-term dependency. As awareness of sleep health increases and diagnosis rates of chronic insomnia rise, barbiturate prescriptions for this indication are expected to remain stable, particularly within specialist care settings.
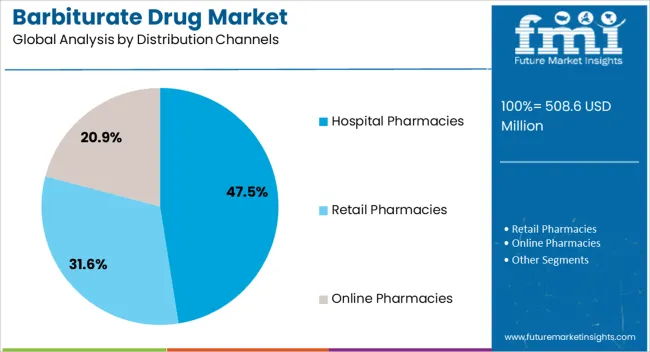
The Hospital Pharmacies segment is projected to account for 47.5% of the barbiturate drug market revenue in 2025, maintaining its dominance as the primary distribution channel. This segment’s growth has been supported by the stringent regulatory frameworks that govern barbiturate dispensing, making hospital pharmacies the most secure and monitored distribution route.
Hospitals have prioritized dispensing barbiturates under controlled settings to minimize risks of misuse and ensure compliance with treatment protocols. Clinical administrators have emphasized the need for centralized pharmacy oversight in managing stock, dosage accuracy, and patient safety.
Additionally, hospital pharmacies provide healthcare professionals with direct access to barbiturates for urgent therapeutic needs in critical care and surgical environments. The integration of electronic prescribing systems and compliance monitoring has further strengthened hospital pharmacy-led distribution. With barbiturates continuing to be closely regulated substances, hospital pharmacies are expected to remain the leading distribution channel, ensuring safe and effective patient access.
In the section below, find out brimming opportunities in the barbiturate drug market, barbituric acid market, and nitric acid market. This section gives a brief comparison between associated industries and the barbiturate drug market.
Core Market:
| Attributes | Barbiturate Drug Industry |
|---|---|
| CAGR (2025 to 2035) | 3.20% |
| Growth Factor | Rising demand for long-acting barbiturates |
| Opportunity | Emerging opportunities for novel barbiturate-based analgesics |
| Key Trend | Research advancements and innovations in barbiturate discovery |
Barbituric Acid Industry:
| Attributes | Barbituric Acid Industry |
|---|---|
| CAGR (2025 to 2035) | 4.60% |
| Growth Factor | Increasing sleeping disorders, especially in countries like China and India, contribute to market expansion of barbituric acid |
| Opportunity | Expansion of pharmaceutical sector presents extensive opportunities for barbituric acid providers |
| Key Trend | Rising demand for barbituric acid in health supplements |
Nitric Acid Industry:
| Attributes | Nitric Acid Industry |
|---|---|
| CAGR (2025 to 2035) | 3.3% |
| Growth Factor | Fertilizer manufacturers are increasing their use of nitric acid |
| Opportunity | Increasing competition, propelled by many players manufacturing nitric acids, is fueling innovations |
| Key Trends | Rising use of nitric acid to meet vehicle weight reduction regulations brought by surging environmental concerns |
| Leading Drug Type | Long-acting Barbiturate |
|---|---|
| Growth Rate (From 2025 to 2035) | 3.0% |
According to FMI analysts, the long-acting barbiturate has been analyzed to attain a share of 38% in 2025. Throughout the historical period, this segment portrayed an average growth of 5%. Now in the forecast period, the segment is projected to proceed at a CAGR of 3%.
Long-acting barbiturates are finding extensive use, higher than their counterparts, to treat patients with a history of experiencing seizures and anxiety. The drug is primarily used for daytime sedation.
| Leading Application | Epilepsy |
|---|---|
| Growth Rate (From 2025 to 2035) | 2.80% |
The use of barbiturates to treat epilepsy is projected to rise at a CAGR of 2.80% over the forecast period. Comparing this to the previous recorded rate of 4.8%, the industry growth rate is slowly declining. Key reasons for this shift in preference could be the common side effects that have surfaced in the medical community regarding the use of barbiturates. As a result, new drugs are explored, or innovations are being made to substitute the use of barbiturates.
Despite recent explorations for new drugs, barbiturates are still widely used to curb episodes of epilepsy. Analysts at FMI have registered that epilepsy is in line to account for 48.8% of the industry share in 2025.
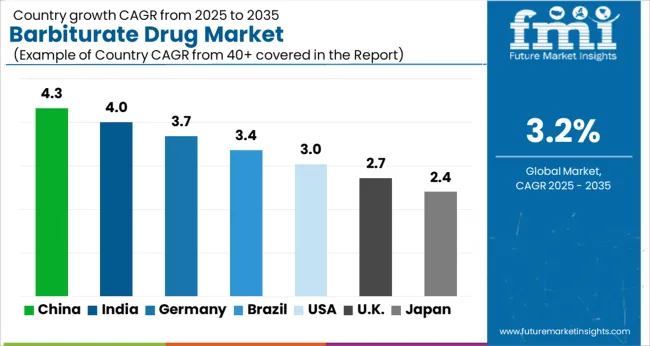
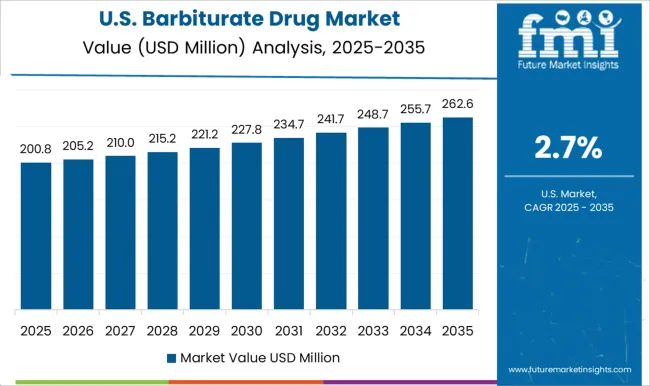
The United States leads the barbiturate drug industry. By 2035, the industry is estimated to attain USD 120.1 million, expanding at a CAGR of 3.5% over the forecast period. Key factors propelling growth are as follows:
The consumption of barbiturates is inclined to increase at a CAGR of 4.40% over the next decade in the United Kingdom. By the end of the forecast period, the demand is expected to attain a valuation of USD 27.5 million. Some factors inflecting growth are:
The barbiturate industry in China is projected to attain USD 696.9 million by 2035. Over the next decade, sales are expected to expand at a CAGR of 3.9%. Key factors supporting the industry's growth are as follows:
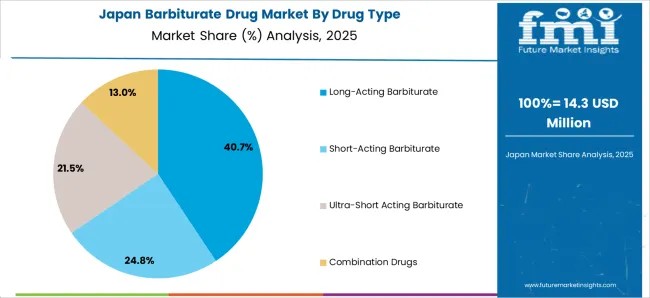
The Japanese barbiturate drug market is expected to register a remuneration of USD 75.0 million by 2035. For the next ten years, the sector is projected to expand at 4.9% CAGR. The industry is driven by the following elements:
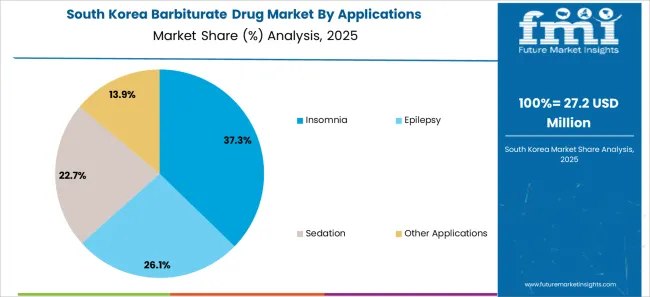
The South Korean barbiturate drug market is expected to account for a revenue of USD 43.8 million by 2035. Over the projected period, the industry is estimated to expand at a CAGR of 5.3%. Key factors that have an impact on the market dynamics of barbiturates in South Korea are as follows:
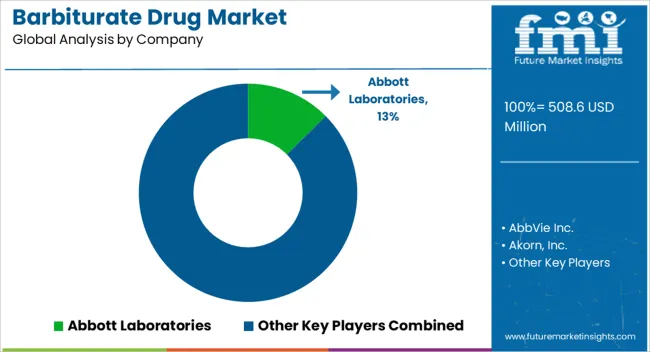
Leading players are devising clear strategies to achieve significant growth ambition. They are on a consistent lookout for opportunities to create a wide product portfolio. Additionally, players are selectively enlarging their geographical coverage and refining their development pipeline to reach more customers with their enhanced portfolio.
Industry participants are further increasing their capacity to expand their bandwidth for the annual production of barbiturates. Companies are showcasing their openness to discuss potential partnerships for future expansion.
Leading contenders are focusing on research and development projects to get ahead of their competition with innovative solutions. Players are also focusing on business development teams to develop compelling strategies for growth.
Par Pharmaceutical
Par Pharmaceutical is a highly focused generic pharmaceutical firm, that is completely owned by Endo business. The company provides patients with quality medicines. In line with this, the company develops, innovates, manufactures, and commercializes its product line.
Samarth Life Science Pvt. Ltd.
Samarth Life Science Pvt. Ltd. is an acclaimed life science firm that explores, manufactures and advertises an extensive range of life-saving critical care drugs. The company is committed to offering improved results via superior products. The unique approach undertaken by Samarth is to offer innovative proprietary pharmaceuticals while catering to the unmet medical needs of patients, which is the ultimate customer.
Ethypharm
Ethypharm, a specialty pharmaceutical firm with roots in Europe, focuses on certain Central Nervous System (CNS) conditions and diseases as well as hospital injectables. Several products made by Ethypharm are indicated for sensitive products in which patients are either in a critical state or suffer from debilitating conditions like addiction or chronic pain.
The global barbiturate drug market is estimated to be valued at USD 508.6 million in 2025.
The market size for the barbiturate drug market is projected to reach USD 696.9 million by 2035.
The barbiturate drug market is expected to grow at a 3.2% CAGR between 2025 and 2035.
The key product types in barbiturate drug market are long-acting barbiturate, short-acting barbiturate, ultra-short acting barbiturate and combination drugs.
In terms of applications, insomnia segment to command 38.2% share in the barbiturate drug market in 2025.


Our Research Products

The "Full Research Suite" delivers actionable market intel, deep dives on markets or technologies, so clients act faster, cut risk, and unlock growth.

The Leaderboard benchmarks and ranks top vendors, classifying them as Established Leaders, Leading Challengers, or Disruptors & Challengers.

Locates where complements amplify value and substitutes erode it, forecasting net impact by horizon

We deliver granular, decision-grade intel: market sizing, 5-year forecasts, pricing, adoption, usage, revenue, and operational KPIs—plus competitor tracking, regulation, and value chains—across 60 countries broadly.

Spot the shifts before they hit your P&L. We track inflection points, adoption curves, pricing moves, and ecosystem plays to show where demand is heading, why it is changing, and what to do next across high-growth markets and disruptive tech

Real-time reads of user behavior. We track shifting priorities, perceptions of today’s and next-gen services, and provider experience, then pace how fast tech moves from trial to adoption, blending buyer, consumer, and channel inputs with social signals (#WhySwitch, #UX).

Partner with our analyst team to build a custom report designed around your business priorities. From analysing market trends to assessing competitors or crafting bespoke datasets, we tailor insights to your needs.
Supplier Intelligence
Discovery & Profiling
Capacity & Footprint
Performance & Risk
Compliance & Governance
Commercial Readiness
Who Supplies Whom
Scorecards & Shortlists
Playbooks & Docs
Category Intelligence
Definition & Scope
Demand & Use Cases
Cost Drivers
Market Structure
Supply Chain Map
Trade & Policy
Operating Norms
Deliverables
Buyer Intelligence
Account Basics
Spend & Scope
Procurement Model
Vendor Requirements
Terms & Policies
Entry Strategy
Pain Points & Triggers
Outputs
Pricing Analysis
Benchmarks
Trends
Should-Cost
Indexation
Landed Cost
Commercial Terms
Deliverables
Brand Analysis
Positioning & Value Prop
Share & Presence
Customer Evidence
Go-to-Market
Digital & Reputation
Compliance & Trust
KPIs & Gaps
Outputs
Full Research Suite comprises of:
Market outlook & trends analysis
Interviews & case studies
Strategic recommendations
Vendor profiles & capabilities analysis
5-year forecasts
8 regions and 60+ country-level data splits
Market segment data splits
12 months of continuous data updates
DELIVERED AS:
PDF EXCEL ONLINE
Drug Taste Masking Technologies Market Forecast and Outlook 2025 to 2035
Drug-Gene Interaction Panels Market Size and Share Forecast Outlook 2025 to 2035
Drug Testing Systems Market Size and Share Forecast Outlook 2025 to 2035
Drug Tester Market Size and Share Forecast Outlook 2025 to 2035
Drug Device Combination Products Market Size and Share Forecast Outlook 2025 to 2035
Drug Discovery Enzymes Market Size and Share Forecast Outlook 2025 to 2035
Drug Integrated Polymer Fibers Market Size and Share Forecast Outlook 2025 to 2035
Drug Discovery Outsourcing Market Size and Share Forecast Outlook 2025 to 2035
Drug Formulation Market Analysis - Size, Growth, & Forecast Outlook 2025 to 2035
Drug-Induced Dyskinesia Market Size and Share Forecast Outlook 2025 to 2035
Drug Free Depression Treatment Market Size and Share Forecast Outlook 2025 to 2035
Drug Delivery Technology Market is segmented by route of administration, and end user from 2025 to 2035
Drugs Glass Packaging Market Analysis - Size, Share, and Forecast Outlook 2025 to 2035
Drug Delivery Solutions Market Insights - Growth & Forecast 2025 to 2035
Drug Designing Tools Market Growth – Trends & Forecast 2025 to 2035
Drug of Abuse Testing Market Growth – Trends & Forecast 2025-2035
Drug-Induced Immune Hemolytic Anemia Market - Demand & Forecast 2025 to 2035
Drug Discovery Services Market Insights - Trends & Growth 2025 to 2035
Drug Screening Market Overview - Trends, Demand & Forecast 2025 to 2035
Drug Eruptions Treatment Market - Innovations & Future Outlook 2025 to 2035

Thank you!
You will receive an email from our Business Development Manager. Please be sure to check your SPAM/JUNK folder too.
Chat With
MaRIA