
- Market Size (2026)
- USD 214.6 Mn
- Forecast (2036)
- USD 434.1 Mn
- CAGR (2026 to 2036)
- 7.3%
How big is Chronic Pancreatitis Nutrition Market in 2026?
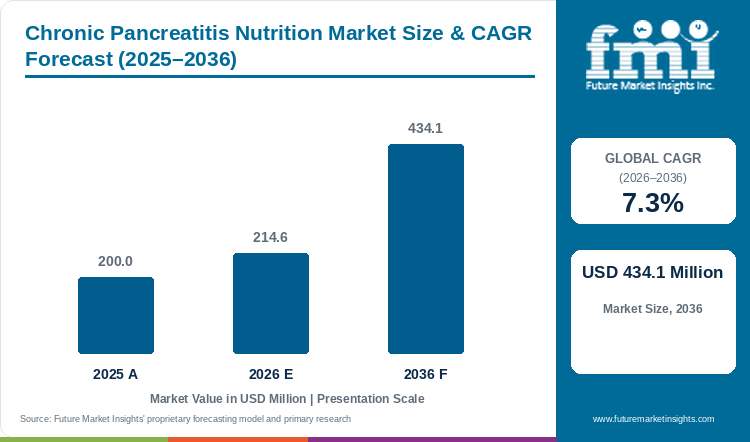
Sales in the chronic pancreatitis nutrition market are projected to grow at 7.3% CAGR through 2036. Market size rises from USD 200.0 million in 2025 to USD 214.6 million in 2026 and is expected to reach USD 434.1 million by 2036.
The global chronic pancreatitis nutrition market was valued at USD 200.0 million in 2025 and is expected to increase from USD 214.6 million in 2026 to USD 434.1 million by 2036, registering a CAGR of 7.3% during the forecast period. Chronic pancreatitis nutrition market is expected to witness nearly two times growth over the decade, with addition of USD 219.5 million in revenue. Increasing incidences of malnutrition along with continuing fat malabsorption among chronic pancreatitis patients is one of the key factors that is boosting the demand for specialized nutrition products.
A 2025 review reported malnutrition in 43.4% of patients, including 38.3% under GLIM criteria. Due to increasing occurrence of nutritional decline among these patients, products supporting concentrated calorie intake and easier fat absorption are facing very high demand in the market. MCT-rich oral nutritional supplements are one of the highly used product types and is anticipated to hold 47.7% share in 2026, as it provides concentrated calories and has lower dependence on ordinary fat digestion. Mild malnutrition is expected to account for 50.3% by nutritional status, owing to a larger number of patients continuing ordinary food along with additional oral nutrition before reaching severe nutritional decline. South Korea is anticipated to witness relatively higher growth at 7.6% CAGR through 2036, followed by the UK at 7.0%, the USA at 6.7% and Germany at 6.2%. At last, Japan is expected to register relatively lower growth at 5.2% during the forecast period.
Key Market Trends & Insights
- By product type: MCT-rich ONS led with 47.7% share in 2026, owing to concentrated calorie delivery where fat malabsorption continues.
- By nutritional status: Mild malnutrition accounted for 50.3% in 2026, reflecting the larger patient group using ordinary food with added oral nutrition.
- By product form: Powders led with 48.0% share in 2026, enabled by adjustable serving volume and calorie density.
- By end user: Homecare represented 50.8% in 2026, linked to recurring use after hospital or GI-clinic initiation.
- By sales channel: Hospital pharmacy held 37.6% in 2026, underpinned by clinician selection and formulary access during regimen initiation.
Regional Highlights
- Fastest-growing profiled country: South Korea, at 7.6% CAGR from 2026 to 2036.
- By country: The UK, at 7.0%, and the USA, at 6.7%, follow, while Japan records the lowest profiled CAGR at 5.2%.
Market Size & Forecast
Table 1: Market Size and Forecast for the Chronic Pancreatitis Nutrition Market (USD million and CAGR percentage), 2025 to 2036
| Metric | Value |
|---|---|
| 2025 Market Size | USD 200.0 million |
| Estimated Market Size in 2026 | USD 214.6 million |
| Projected Market Size by 2036 | USD 434.1 million |
| CAGR, 2026 to 2036 | 7.3% |
| Added Revenue, 2026 to 2036 | USD 219.5 million |
Homecare will account for 50.8% of chronic pancreatitis nutrition use in 2026, according to FMI, with hospitals and GI clinics placing most remaining demand. Sales of oral supplements are limited to a selected patient group, as European clinical guidelines indicate that more than 80% of patients can be managed with normal food plus pancreatic enzymes, 10% to 15% need oral supplements and around 5% need tube feeding. Hospital-to-home supply is also widening, as Danone completed its majority acquisition of Kate Farms in July 2025, a brand available in more than 1,400 U.S. hospitals . Key trends point to clinically eligible patients and continued home supply creating most repeat orders through 2036.
Patient-Pool and Treatment Eligibility
Table 2: Patient-Pool and Treatment Eligibility for the Chronic Pancreatitis Nutrition Market (patients, percentages, and USD), mixed historical and forecast years from 2025 to 2036
| Metric | 2025 | 2026 | 2036 |
|---|---|---|---|
| Market size (USD million) | 200.0 | 214.6 | 434.1 |
| Estimated patients (million) | 3.3 to 4.1 | 3.3 to 4.2 | 3.6 to 4.5 |
| Patients needing oral supplements (thousand) | 329 to 617 | 332 to 623 | 358 to 671 |
| Spend per patient (USD) | 49 to 61 | 52 to 65 | 97 to 121 |
| Spend per patient needing supplements (USD) | 324 to 607 | 345 to 646 | 647 to 1,213 |
| Homecare revenue (USD million) | 101.6 | 109.0 | 220.5 |
| Homecare spend per eligible patient (USD) | 165 to 309 | 175 to 328 | 329 to 616 |
Per Capita & Household Analysis
At population level, chronic pancreatitis nutrition represents a very small spending category. Global spend is calculated at USD 0.026 per person in 2026 and reaches USD 0.049 by 2036, equal to USD 25.85 and USD 48.53 per 1,000 people, based on United Nations demographic projections. The patient measure is more important than population spending, as global epidemiological studies record a prevalence range of 40 to 50 cases per 100,000, giving around 3.3 to 4.2 million patients in 2026 . This places market spend at USD 52 to 65 per patient. Among the 10% to 15% requiring oral supplements, the value reaches around USD 345 to 646 per eligible patient, which shows why diagnosed need carries more commercial value than broad population growth.
Table 3: Per Capita and Eligible-Patient Spending for the Chronic Pancreatitis Nutrition Market (population, patients, and USD), mixed historical and forecast years from 2025 to 2036
| Metric | 2025 | 2026 | 2036 |
|---|---|---|---|
| World population (billion) | 8.23 | 8.30 | 8.95 |
| Spend per capita (USD) | 0.024 | 0.026 | 0.049 |
| Spend per 1,000 people (USD) | 24.30 | 25.85 | 48.53 |
| Estimated patients (million) | 3.3 to 4.1 | 3.3 to 4.2 | 3.6 to 4.5 |
| Spend per patient (USD) | 49 to 61 | 52 to 65 | 97 to 121 |
| Patients needing supplements (thousand) | 329 to 617 | 332 to 623 | 358 to 671 |
| Spend per eligible patient (USD) | 324 to 607 | 345 to 646 | 647 to 1,213 |
Homecare carries the more practical household burden because this is where repeated use continues after discharge. The 50.8% end-user share gives homecare revenue of around USD 109.0 million in 2026, or USD 175 to 328 per patient needing supplements. Against worldwide household consumption reported by the World Bank, the complete category remains at only 0.00034%, while the affected household can face a much larger yearly requirement. Reimbursement can reduce the amount paid directly by the household, due to which these figures should be treated as product-use intensity rather than confirmed out-of-pocket spending. Apart from this, mixed reporting years make the household comparison a benchmark and not a direct measure of affordability.
Table 4: Household and Homecare Spending Indicators for the Chronic Pancreatitis Nutrition Market (USD, percentages, and households), mixed reporting years from 2023 to 2026
| Metric | Value | Basis |
|---|---|---|
| Market size, 2026 | USD 214.6 million | Report value |
| Households worldwide | 2.17 billion | 2024 secondary estimate |
| Market spend per household | USD 0.099 | Calculated |
| Household consumption per household | USD 29,068 | World Bank, 2024 |
| Market share of household consumption | 0.00034% | Calculated |
| Out-of-pocket health spend per household | USD 859 | World Bank, 2023 |
| Homecare revenue, 2026 | USD 109.0 million | 50.8% share |
| Homecare spend per affected household | USD 175 to 328 | Eligible-patient range |
Analyst Perspective
“I see demand moving towards formulas that can correct documented deficiencies without adding further digestive burden. Products that remain practical after discharge will gain preference as nutrition management shifts from the clinic into the home.”
- Nandini Roy Choudhury, Principal Consultant, Future Market Insights.
How is the Chronic Pancreatitis Nutrition Market segmented?
Chronic pancreatitis nutrition is segmented by five primary commercial axes and region: product type, nutritional status, product form, end user, sales channel, and region. In 2026, MCT-rich ONS is projected at 47.7%, mild malnutrition at 50.3%, powders at 48.0%, homecare at 50.8%, and hospital pharmacy at 37.6%.
Product type covers MCT-rich ONS, semi-elemental formulas, fat-soluble vitamin blends (ADEK), low-fat meal products, and others.
Nutritional status covers mild malnutrition, moderate-severe malnutrition, and diabetic (type 3c) overlay.
Product form covers powders, RTD, enteral tube feeds, and others.
End user covers homecare, hospitals and GI clinics, and others.
Sales channel covers hospital pharmacy, retail pharmacy, online, institutional tender, and others.
Why does MCT-rich ONS account for notable product type demand?
MCT-rich ONS is projected to capture 47.7% of product type revenue in 2026, supported by efficient lipid absorption without lipase.
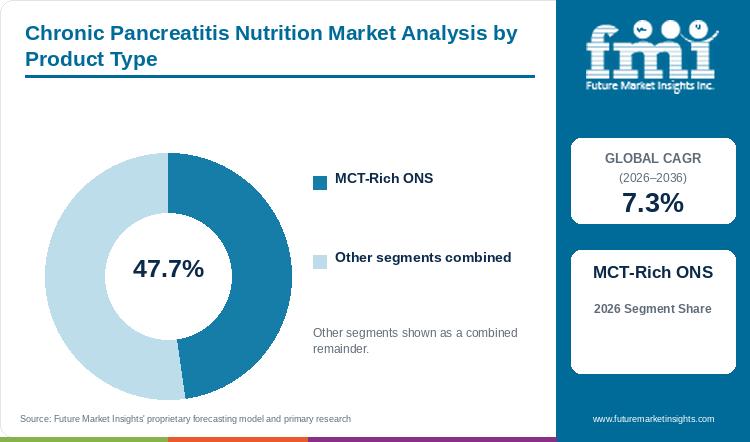
Table 5: Product Type Share for the Chronic Pancreatitis Nutrition Market (percentage share), 2026
| Product Type | Share (2026) |
|---|---|
| MCT-Rich ONS | 47.7% |
| Other Segments Combined | 52.3%* |
| Total | 100.0% |
*Calculated as the balance remaining after deducting the leading segment's reported share from 100.0%.
Table 6: Product Type Leadership and Market Growth for the Chronic Pancreatitis Nutrition Market (segment and CAGR percentage), 2026 to 2036
| Metric | Value |
|---|---|
| Global CAGR (2026 to 2036) | 7.3% |
| Leading Segment | MCT-Rich ONS |
MCT-rich oral nutrition is selected when ordinary fats remain difficult to absorb after pancreatic enzyme therapy is adjusted. MCT delivers concentrated calories with lower dependence on pancreatic lipase, due to which smaller servings can help selected patients maintain calorie intake. Semi-elemental formulas serve patients needing a different protein and digestion profile, while vitamin blends correct a narrower deficiency. The 47.7% share is therefore supported by wider calorie use rather than one micronutrient requirement. However, poor taste or gastrointestinal effects can hamper regular consumption. Products having easier digestion, practical serving size and clear dietitian guidance are likely to receive preference through 2036.
- MCT-Rich ONS accounts for 47.7% share in 2026, supported by its role in delivering concentrated energy when malabsorption remains clinically relevant.
What supports mild malnutrition as the main nutritional status?
By nutritional status, mild malnutrition is estimated to represent 50.3% of category demand in 2026, owing to timely clinical intervention.
Mild malnutrition provides a wider stage for oral nutrition because the patient can continue ordinary food while measured deficiencies are being corrected. Dietitians can add calorie, protein or micronutrient support before tube feeding formulas become necessary, which keeps the addressable group wider than severe cases. The 50.3% share is therefore connected with earlier screening and longer oral-use periods, rather than stronger product intensity for each patient. Continued follow-up is expected to support this segment as weight loss and deficiency becomes visible at an earlier stage.
- Mild Malnutrition accounts for 50.3% share in 2026, reflecting the larger pool of patients who can still use oral nutrition while nutritional decline is being corrected.
- In July 2025, Danone completed its majority-stake acquisition of Kate Farms. Danone said the combined specialized-nutrition business would improve access in hospitals and at home as well as online and on shelf.
How do powders meet changing product form requirements?
In 2026, powders are expected to lead product form with 48.0% share, enabled by flexible serving volume and caloric adjustment.
Powdered nutrition allows the preparation volume and calorie density to change with appetite, glucose management and digestive tolerance. A patient can divide the prepared amount across smaller servings instead of completing one fixed bottle, which is useful when intake remains low. This flexibility supports the 48.0% share as type 3c diabetes and malabsorption sometimes needs to be managed together. Demand is also developing for diabetic food alternatives and condition-specific powders that can adjust around the existing diet without making the complete regimen difficult to continue.
- Powders account for 48.0% share in 2026, supported by flexible preparation and the ability to adjust serving density around individual intake tolerance.
- In November 2025, Abbott launched an advanced Ensure Diabetes Care formulation with higher myo-inositol, high protein, high fiber, and a low-glycemic carbohydrate blend.
Why does homecare retain notable end user demand?
Homecare is set to command 50.8% of end user revenue in 2026, reinforced by recurring outpatient regimen continuation after discharge.
Chronic pancreatitis needs nutrition management over a longer period, due to which a regimen started in hospital or GI clinic often continues at home. Homecare allows patients to follow calorie and protein recommendations without returning to the hospital for every serving or purchase. The 50.8% share is supported by repeated use after discharge, but only when preparation remains easy and the same product is continuously available. Smaller serving formats, clear instructions and reliable therapeutic food delivery are expected to keep homecare as the main end user during the forecast period.
- Homecare accounts for 50.8% share in 2026, reflecting the recurring nature of nutrition support after a hospital or clinic establishes the regimen.
- In July 2025, Danone described hospital and home access as part of the route-to-market rationale for combining Kate Farms with its specialized-nutrition portfolio. It also cited online and shelf availability.
Which factors support hospital pharmacy in the sales channel?
With an estimated 37.6% share in 2026, hospital pharmacy leads the sales channel category, underpinned by clinician-directed formulary initiation.
Hospital pharmacy remains close to the point where gastroenterologists and dietitians first identify weight loss, malnutrition or persistent malabsorption. Products are selected according to feeding route, whether oral, enteral, or parenteral nutrition, which gives this channel an important role during initiation. Its 37.6% share is therefore connected with clinician-led selection rather than the full period of product use. Once the regimen becomes stable, part of the demand moves towards homecare, retail or online supply depending upon reimbursement and local availability.
- Hospital Pharmacy accounts for 37.6% share in 2026, supported by clinician-led initiation and formulary access for medically supervised nutrition products.
- In summer 2025, Fresenius Kabi introduced Fresubin Plant-Based Drink as a nutritionally complete oral supplement for disease-related malnutrition.
What are the drivers, restraints, and opportunities in the Chronic Pancreatitis Nutrition Market?
Earlier recognition of malnutrition and malabsorption supports demand, while diet-plus-enzyme therapy limits unnecessary specialized nutrition and hospital-to-home regimen design opens the clear commercial opportunity.
- Driver: Structured screening for exocrine insufficiency, weight loss, and micronutrient deficits moves nutrition support into routine chronic pancreatitis management.
- Restraint: Most patients are managed first with a normal diet plus adequate pancreatic enzymes, and MCT taste or gastrointestinal side effects can limit persistent use.
- Opportunity: Suppliers can combine peptide or MCT energy delivery with modular vitamins and diabetes-sensitive formats in practical hospital-to-home pathways.
Clinical Screening Makes Deficits Visible
Screening for weight loss, reduced food intake and micronutrient deficiency is making the nutrition requirement more visible in chronic pancreatitis. The 2025 Nutrients review links the condition with calorie-protein depletion and fat-soluble vitamin deficiencies through more than one disease route. This has increased the role of oral or enteral nutrition after ordinary diet and pancreatic enzyme therapy are properly assessed. According to FMI, earlier identification is expected to widen the patient group that receives targeted support before nutritional decline becomes difficult to correct.
Eligibility Limits Routine Product Use
Specialized nutrition is not generally used before ordinary diet and pancreatic enzyme therapy are adjusted according to the patient requirement. In 2025, European clinical guidelines confirmed that enzyme titration and dietary fat moderation must be verified before prescribing specialized medical nutrition formulas. Such measurement shows why documented need remains important before a medical nutrition product is added. Apart from this, poor taste, gastrointestinal effects and repeated preparation can reduce continued use, which in turn restricts adoption even among clinically suitable patients.
Hospital-to-Home Regimens Extend Use
Hospital-to-home nutrition is creating an opportunity for products that can remain usable after the patient is discharged. In March 2026, Fresenius Kabi introduced Fresubin Plant-Based Tube Feed with 1.5 kcal/ml energy density to support patient transition from hospital wards into home-based enteral regimens. This wider route is important because specialized dietary supplements, peptide, MCT, plant-based and modular formats are not selected for the same feeding or tolerance requirement. Easier preparation and continued supply can therefore extend prescribed use, while a break in availability can disturb a regimen already established by the dietitian.
Which country CAGRs are profiled in the Chronic Pancreatitis Nutrition Market?
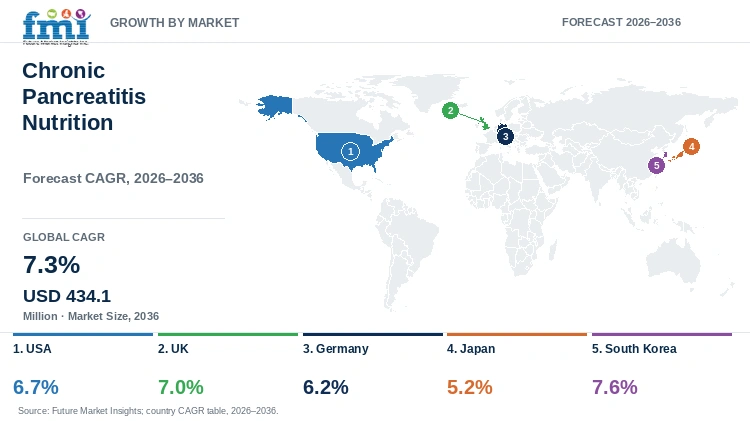
Table 7: Country CAGR Comparison for the Chronic Pancreatitis Nutrition Market (CAGR percentage), 2026 to 2036
| Country | CAGR |
|---|---|
| USA | 6.7% |
| UK | 7.0% |
| Germany | 6.2% |
| Japan | 5.2% |
| South Korea | 7.6% |
How do country-level CAGRs compare in the chronic pancreatitis nutrition market?
Regional expansion rates diverge because clinical dietitian access, reimbursement thresholds, and outpatient continuation vary across healthcare systems. In the FMI report, South Korea and the UK show comparatively stronger expansion, while the USA, Germany and Japan develop through different monitoring, prescribing and supply conditions. Full report country CAGRs cover: North America; Latin America; Western Europe; Eastern Europe; East Asia; South Asia and Pacific; Middle East and Africa.
Country-wise Analysis
- Chronic pancreatitis nutrition demand in USA is forecast to rise at 6.7% CAGR through 2036, supported by hospital, homecare and retail supply routes. In September 2026, CDC reported that 69.9% of adults consumed fruit and 93.3% consumed vegetables on a given day. These figures show the scale at which food intake is monitored; however, they cannot establish nutrition adequacy among patients having pancreatic insufficiency. While general wellness and sports nutrition channels expand rapidly across the country, specialized medical products are used when weight loss, malabsorption or deficiency remains after food changes and enzyme therapy. FMI research indicates that better continuity between specialist assessment and home supply will remain important for converting an identified requirement into continued use.
- The UK chronic pancreatitis nutrition market is anticipated to advance at 7.0% CAGR over the assessment period, owing to specialist pathways and national diet monitoring. The National Diet and Nutrition Survey published in June 2025 covers food intake, biomarkers and nutritional status for people aged 18 months and above across all four UK countries. This provides a wider setting for identifying nutrition gaps, while patient-level assessment is still required before medical nutrition is prescribed. Products having clear preparation instructions and formulary access are likely to witness better continuation after specialist initiation, especially when discharge supply is decided before the patient moves home.
- Adoption of chronic pancreatitis nutrition in Germany is estimated to expand at 6.2% CAGR through 2036, influenced by measured need and reimbursement controls. Germany started a national nutrition examination in April 2026 covering more than 3,000 adults from 120 municipalities. Food intake, supplement use, body measurements and nutrient biomarkers are recorded, which supports an evidence-led nutrition setting. Specialized formulas enter after dietary measures and pancreatic enzymes remain insufficient, due to which documentation carries more importance in product access. Products that fit dietitian-led escalation and can be prepared at home are expected to witness relatively better adoption.
- In Japan, demand for chronic pancreatitis nutrition is predicted to advance at 5.2% CAGR through 2036, supported by adequate-energy guidance and measured dietary intake. A Ministry of Health resource updated in May 2025 reported average vegetable intake of 256 g per adult per day against the national target of 350 g. This indicates a population nutrition gap, although chronic pancreatitis requires a separate clinical assessment. Smaller servings and digestible formulations can find use when diet and enzyme therapy does not maintain calorie or micronutrient status. The slower CAGR also reflects careful product escalation rather than absence of the underlying nutrition requirement.
- South Korea is estimated to post 7.6% CAGR over the forecast period, backed by broad insurance and longitudinal claims infrastructure. In July 2026, the National Health Insurance Service published its 2024 statistical yearbook and confirmed the 2025 edition for November 2026. The system covers almost the entire resident population through employee, self-employed and medical-aid categories, enabling long-term care use to be followed. FMI data suggests the higher growth outlook will depend on converting hospital assessment into affordable home nutrition, as claims coverage alone does not ensure that a selected product remains available after discharge.
Who are the notable companies in the Chronic Pancreatitis Nutrition Market?
Nestle Health Science (Peptamen), Abbott, Danone Nutricia, Fresenius Kabi, Vitaflo / Nestle Health Science, Kate Farms, Medtrition, and Victus are the notable companies profiled in this market.
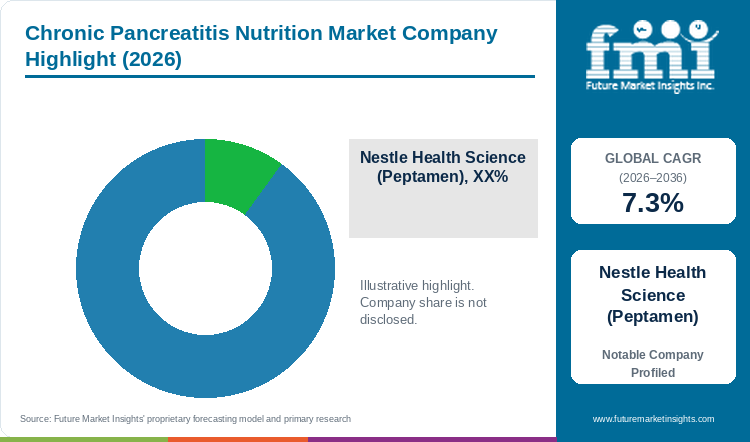
The chronic pancreatitis nutrition market includes global medical nutrition companies, plant-based formula providers and modular nutrition specialists. Nestle Health Science, Danone Nutricia and Fresenius Kabi participate through oral or enteral products for maldigestion and disease-related malnutrition. Abbott offers wider condition-specific nutrition, while Kate Farms, Medtrition and Victus provides plant-based or targeted options. Buyers do not select these products only by brand name as digestive tolerance, feeding route, nutrient density, preparation, reimbursement and home availability changes the suitable choice. Public information does not establish one global share leader within this defined product boundary.
- Peptide-Based Digestive Nutrition Platforms: Nestle Health Science (Peptamen), Danone Nutricia, and Fresenius Kabi compete through peptide-based oral or enteral formulas that address maldigestion and tolerance needs.
- Broad Specialty and Plant-Based Medical Nutrition: Abbott, Kate Farms, and Vitaflo / Nestle Health Science span broader specialty nutrition, plant-based formulas, or modular nutrition support that can fit different care pathways.
- Modular and Targeted Nutrition Providers: Medtrition and Victus provide focused protein or condition-oriented nutrition options that can complement a complete chronic pancreatitis regimen when the dietitian needs a narrower intervention.
Competitive Benchmarking: Chronic Pancreatitis Nutrition Market
Table 8: Competitive Benchmarking for the Chronic Pancreatitis Nutrition Market (qualitative capability ratings), 2026
| Company | Peptide/MCT Formula Depth | Hospital-to-Home Access | Modular/Metabolic Nutrition Fit | Geographic Reach |
|---|---|---|---|---|
| Nestle Health Science (Peptamen) | High | High | Medium | Medium |
| Abbott | High | High | High | Medium |
| Danone Nutricia | High | High | High | Medium |
| Fresenius Kabi | High | High | Medium | Medium |
| Vitaflo / Nestle Health Science | Medium | Medium | High | Medium |
| Kate Farms | Medium | High | Medium | Medium |
| Medtrition | Medium | Medium | High | Medium |
| Victus | Medium | Medium | High | Medium |
Key Developments in the Chronic Pancreatitis Nutrition Market
- In July 2025, Danone completed its majority acquisition of Kate Farms. The combined North American medical-nutrition business joined Kate Farms, Nutricia, Real Food Blends, and Functional Formularies with routes spanning hospitals, homes, online channels, and retail shelves.
- In November 2025, Abbott launched an advanced Ensure Diabetes Care formulation with higher myo-inositol, high protein, high fiber, and a low-glycemic carbohydrate blend.
- In November 2025, Nestlé Health Science announced collaborations with universities in the USA and Australia to advance nutrition science and product innovation.
- In summer 2025, Fresenius Kabi introduced Fresubin Plant-Based Drink as a nutritionally complete oral supplement for people with or at risk of disease-related malnutrition.
Key Players in the Chronic Pancreatitis Nutrition Market
Peptide-Based Digestive Nutrition Platforms
- Nestle Health Science (Peptamen)
- Danone Nutricia
- Fresenius Kabi
Broad Specialty and Plant-Based Medical Nutrition
- Abbott
- Kate Farms
- Vitaflo / Nestle Health Science
Modular and Targeted Nutrition Providers
- Medtrition
- Victus
Chronic Pancreatitis Nutrition Market - Report Scope
Table 9: Report Scope for the Chronic Pancreatitis Nutrition Market (coverage fields and definitions), 2026 to 2036
| Coverage field | Report scope |
|---|---|
| Market breakdown | Product Type; Nutritional Status; Product Form; End User; Sales Channel |
| Quantitative Units | USD Million |
| Market Definition | Revenue from specialized oral and enteral nutrition, targeted micronutrient blends, and low-fat meal products sold for chronic pancreatitis nutrition management within the stated segmentation universe. Excludes pancreatic enzyme drugs, diabetes medicines, clinical-service fees, feeding equipment, ordinary foods, general supplements not tied to chronic pancreatitis care, and adjacent substitute products. |
| Regions Covered | North America; Latin America; Western Europe; Eastern Europe; East Asia; South Asia and Pacific; Middle East and Africa |
| Countries Covered | USA, UK, Germany, Japan, South Korea, and more than twenty-five additional countries in the full report |
| Key Companies Profiled | Nestle Health Science (Peptamen), Abbott, Danone Nutricia, Fresenius Kabi, Vitaflo / Nestle Health Science, Kate Farms, Medtrition, Victus |
| Forecast Period | 2026 to 2036 |
| Approach | Hybrid bottom-up and top-down sizing that reconciles disease-relevant product demand, care-setting use, channel access, company participation, and country-level adoption conditions within the defined revenue boundary. |
Chronic Pancreatitis Nutrition Market - Research Methodology
Table 10: Research Methodology for the Chronic Pancreatitis Nutrition Market (research methods and approach), 2026 edition
| Method | Approach |
|---|---|
| Primary Research | Analysts gathered input from manufacturers, service providers, technology developers, distributors, end users, procurement teams, and subject-matter experts. Interviews examined purchasing decisions, product or service evaluation, adoption barriers, approval requirements, pricing considerations, and expectations for technical or commercial support. Respondents were also asked what evidence is required before a trial, pilot, or initial order develops into regular purchasing. |
| Desk Research | Desk research covered government statistics, regulatory publications, trade data, industry associations, technical literature, standards, company filings, product information, and official corporate announcements. Sources were reviewed for relevance, publication date, geographic coverage, and consistency with the defined market scope. Claims relating to performance, applications, approvals, capacity, investment, and commercial activity were retained only when supported by credible public evidence. |
| Market Sizing and Forecasting | The market model combined the baseline value with historical performance, segment structure, pricing and volume indicators, adoption levels, company participation, and country-level demand conditions. Forecast assumptions considered economic activity, investment trends, regulatory developments, technology adoption, purchasing cycles, supply availability, and barriers to wider market use. Segment and regional estimates were reconciled before the final market total was calculated. |
| Data Validation | Estimates were checked against multiple independent indicators, including public data, company activity, trade patterns, industry developments, and findings from primary interviews. Validation also tested whether products, services, applications, and company revenues fell within the defined market boundaries. Adjacent categories, unsupported claims, overlapping revenues, and activities without direct market relevance were excluded to reduce double counting and maintain consistency across segments and countries. |
Chronic Pancreatitis Nutrition Market by Segments
Chronic Pancreatitis Nutrition Market segmented by Product Type:
- MCT-Rich ONS
- Semi-Elemental Formulas
- Fat-Soluble Vitamin Blends (ADEK)
- Low-Fat Meal Products
- Others
Chronic Pancreatitis Nutrition Market segmented by Nutritional Status:
- Mild Malnutrition
- Moderate-Severe Malnutrition
- Diabetic (Type 3c) Overlay
Chronic Pancreatitis Nutrition Market segmented by Product Form:
- Powders
- RTD
- Enteral Tube Feeds
- Others
Chronic Pancreatitis Nutrition Market segmented by End User:
- Homecare
- Hospitals & GI Clinics
- Others
Chronic Pancreatitis Nutrition Market segmented by Sales Channel:
- Hospital Pharmacy
- Retail Pharmacy
- Online
- Institutional Tender
- Others
Chronic Pancreatitis Nutrition Market by Region
- North America
- United States
- Canada
- Latin America
- Brazil
- Mexico
- Argentina
- Chile
- Western Europe
- Germany
- France
- United Kingdom
- Italy
- Spain
- Benelux
- Nordics
- Eastern Europe
- Poland
- Czech Republic
- Romania
- Hungary
- East Asia
- China
- Japan
- South Korea
- South Asia and Pacific
- India
- ASEAN
- Australia and New Zealand
- Middle East and Africa
- GCC Countries
- South Africa
- Türkiye
- Israel
Research Sources and Bibliography
- [1] Bruni, A., et al. (2025, August 22). Nutritional management in chronic pancreatitis: From exocrine pancreatic insufficiency to precision therapy. Nutrients, 17(17), 2720.
- [2] United European Gastroenterology. (2025). European guidelines for the diagnosis and treatment of pancreatic exocrine insufficiency. United European Gastroenterology Journal, 13(1), 125-172.
- [3] Fresenius Kabi. (2026, March 18). Fresubin Plant-Based Tube Feed launched with 1.5 kcal/ml energy density for disease-related malnutrition.
- [4] National Center for Health Statistics. (2026, September). Fruit and vegetable consumption among adults: United States, August 2021-August 2023.
- [5] Office for Health Improvement and Disparities. (2025, June 11). National Diet and Nutrition Survey 2019 to 2023: Report.
- [6] Max Rubner-Institut. (2026). Nutrition survey of the adult population in Germany.
- [7] Ministry of Health, Labour and Welfare, Japan. (2025, May 1). Vegetables: 350 g per day for health promotion.
- [8] National Health Insurance Service, Republic of Korea. (2026, July 7). National Health Insurance Statistical Yearbook (2024).
- [9] Danone. (2025, July 1). Danone completes the acquisition of Kate Farms, enhancing its U.S. specialized nutrition offerings.
- [10] Abbott. (2025, November). Advanced Ensure Diabetes Care formulation release.
- [11] Nestlé Health Science. (2025, November). Academic research collaborations for clinical nutrition science.
- [12] Fresenius Kabi. (2025). Fresubin Plant-Based Drink introduction for disease-related malnutrition.
This bibliography is provided for reader reference. The full report contains the complete reference list and detailed citations.
This Report Answers
- What is the Chronic Pancreatitis Nutrition Market size in 2026 and what value is forecast for 2036?
- Which clinical pressures related to malabsorption, malnutrition, and pancreatic exocrine insufficiency support demand?
- Why does MCT-Rich ONS hold the leading position in Product Type?
- How does Mild Malnutrition influence the timing and intensity of nutrition support?
- Why do Powders hold the leading position in Product Form?
- How do growth rates differ across USA, UK, Germany, Japan, and South Korea?
- Which companies provide peptide formulas or broader specialty nutrition, and which focus on plant-based or modular support?
- How do diet-plus-enzyme therapy, formulation tolerance, and reimbursement thresholds limit adoption?
- What should gastroenterology and dietitian teams evaluate before purchase, and how should procurement and homecare teams assess continuity?
Table of Content
- Key Takeaways
- Market Size and CAGR
- Top Growth Driver
- Fastest Growing Segment
- Leading Region
- Key Companies
- Emerging Opportunities
- Executive Summary
- Global Market Outlook
- Demand-side Trends
- Supply-side Trends
- Technology Roadmap Analysis
- Analysis and Recommendations
- Analyst Perspective (What is happening? Why now? What should investors know?)
- Key Questions Answered
- How large is the market?
- What is the CAGR?
- What are key trends?
- Which region dominates?
- Who are the leaders?
Read More...
- Market Overview
- Market Coverage / Taxonomy
- Market Definition / Scope / Limitations
- Research Methodology
- Chapter Orientation
- Analytical Lens and Working Hypotheses
- Market Structure, Signals, and Trend Drivers
- Benchmarking and Cross-market Comparability
- Market Sizing, Forecasting, and Opportunity Mapping
- Research Design and Evidence Framework
- Desk Research Programme (Secondary Evidence)
- Expert Input and Fieldwork (Primary Evidence)
- Tooling, Models, and Reference Databases
- Data Engineering and Model Build
- Quality Assurance and Audit Trail
- Market Background
- Market Dynamics (Drivers, Restraints, Opportunity, Trends)
- Scenario Forecast (Optimistic, Likely, Conservative)
- Impact Analysis
- AI Impact
- Sustainability Impact
- Regulatory Impact
- Technology Impact
- Consumer / Buyer Analysis
- Purchase Drivers
- Adoption Barriers
- Buyer Journey
- Opportunity Map Analysis
- Product Life Cycle Analysis
- Supply Chain Analysis
- Investment Feasibility Matrix
- Value Chain Analysis
- PESTLE and Porter's Analysis
- Regulatory Landscape
- Regional Parent Market Outlook
- Production and Consumption Statistics
- Import and Export Statistics
- Global Market Analysis and Forecast, 2021 to 2036
- Historical Market Size Value (USD Million) Analysis, 2021 to 2025
- Current and Future Market Size Value (USD Million) Projections, 2026 to 2036
- Y-o-Y Growth Trend Analysis
- Absolute $ Opportunity Analysis
- Global Market Pricing Analysis, 2021 to 2036
- Global Market Analysis and Forecast, By Product Type, 2021 to 2036
- Introduction / Key Findings
- Historical Market Size Value (USD Million) Analysis By Product Type, 2021 to 2025
- Current and Future Market Size Value (USD Million) Analysis and Forecast By Product Type, 2026 to 2036
- MCT-Rich ONS
- Semi-Elemental Formulas
- Fat-Soluble Vitamin Blends (ADEK)
- Low-Fat Meal Products
- Others
- Y-o-Y Growth Trend Analysis By Product Type, 2021 to 2025
- Absolute $ Opportunity Analysis By Product Type, 2026 to 2036
- Global Market Analysis and Forecast, By Nutritional Status, 2021 to 2036
- Introduction / Key Findings
- Historical Market Size Value (USD Million) Analysis By Nutritional Status, 2021 to 2025
- Current and Future Market Size Value (USD Million) Analysis and Forecast By Nutritional Status, 2026 to 2036
- Mild Malnutrition
- Moderate-Severe Malnutrition
- Diabetic (Type 3c) Overlay
- Y-o-Y Growth Trend Analysis By Nutritional Status, 2021 to 2025
- Absolute $ Opportunity Analysis By Nutritional Status, 2026 to 2036
- Global Market Analysis and Forecast, By Product Form, 2021 to 2036
- Introduction / Key Findings
- Historical Market Size Value (USD Million) Analysis By Product Form, 2021 to 2025
- Current and Future Market Size Value (USD Million) Analysis and Forecast By Product Form, 2026 to 2036
- Powders
- RTD
- Enteral Tube Feeds
- Others
- Y-o-Y Growth Trend Analysis By Product Form, 2021 to 2025
- Absolute $ Opportunity Analysis By Product Form, 2026 to 2036
- Global Market Analysis and Forecast, By End User, 2021 to 2036
- Introduction / Key Findings
- Historical Market Size Value (USD Million) Analysis By End User, 2021 to 2025
- Current and Future Market Size Value (USD Million) Analysis and Forecast By End User, 2026 to 2036
- Homecare
- Hospitals & GI Clinics
- Others
- Y-o-Y Growth Trend Analysis By End User, 2021 to 2025
- Absolute $ Opportunity Analysis By End User, 2026 to 2036
- Global Market Analysis and Forecast, By Sales Channel, 2021 to 2036
- Introduction / Key Findings
- Historical Market Size Value (USD Million) Analysis By Sales Channel, 2021 to 2025
- Current and Future Market Size Value (USD Million) Analysis and Forecast By Sales Channel, 2026 to 2036
- Hospital Pharmacy
- Retail Pharmacy
- Online
- Institutional Tender
- Others
- Y-o-Y Growth Trend Analysis By Sales Channel, 2021 to 2025
- Absolute $ Opportunity Analysis By Sales Channel, 2026 to 2036
- Global Market Analysis and Forecast, By Region, 2021 to 2036
- Introduction
- Historical Market Size Value (USD Million) Analysis By Region, 2021 to 2025
- Current Market Size Value (USD Million) Analysis and Forecast By Region, 2026 to 2036
- North America
- Latin America
- Western Europe
- Eastern Europe
- East Asia
- South Asia and Pacific
- Middle East and Africa
- Market Attractiveness Analysis By Region
- North America Market Analysis and Forecast, By Country, 2021 to 2036
- Historical Market Size Value (USD Million) Trend Analysis By Market Taxonomy, 2021 to 2025
- Market Size Value (USD Million) Forecast By Market Taxonomy, 2026 to 2036
- By Country
- United States
- Canada
- By Product Type
- By Nutritional Status
- By Product Form
- By End User
- By Sales Channel
- By Country
- Market Attractiveness Analysis
- By Country
- By Product Type
- By Nutritional Status
- By Product Form
- By End User
- By Sales Channel
- Key Takeaways
- Latin America Market Analysis and Forecast, By Country
- Historical Market Size Value (USD Million) Trend Analysis By Market Taxonomy, 2021 to 2025
- Market Size Value (USD Million) Forecast By Market Taxonomy, 2026 to 2036
- By Country
- Brazil
- Mexico
- Argentina
- Chile
- By Product Type
- By Nutritional Status
- By Product Form
- By End User
- By Sales Channel
- By Country
- Market Attractiveness Analysis
- By Country
- By Product Type
- By Nutritional Status
- By Product Form
- By End User
- By Sales Channel
- Key Takeaways
- Western Europe Market Analysis and Forecast, By Country
- Historical Market Size Value (USD Million) Trend Analysis By Market Taxonomy, 2021 to 2025
- Market Size Value (USD Million) Forecast By Market Taxonomy, 2026 to 2036
- By Country
- Germany
- France
- United Kingdom
- Italy
- Spain
- Benelux
- Nordics
- By Product Type
- By Nutritional Status
- By Product Form
- By End User
- By Sales Channel
- By Country
- Market Attractiveness Analysis
- By Country
- By Product Type
- By Nutritional Status
- By Product Form
- By End User
- By Sales Channel
- Key Takeaways
- Eastern Europe Market Analysis and Forecast, By Country
- Historical Market Size Value (USD Million) Trend Analysis By Market Taxonomy, 2021 to 2025
- Market Size Value (USD Million) Forecast By Market Taxonomy, 2026 to 2036
- By Country
- Poland
- Czech Republic
- Romania
- Hungary
- By Product Type
- By Nutritional Status
- By Product Form
- By End User
- By Sales Channel
- By Country
- Market Attractiveness Analysis
- By Country
- By Product Type
- By Nutritional Status
- By Product Form
- By End User
- By Sales Channel
- Key Takeaways
- East Asia Market Analysis and Forecast, By Country
- Historical Market Size Value (USD Million) Trend Analysis By Market Taxonomy, 2021 to 2025
- Market Size Value (USD Million) Forecast By Market Taxonomy, 2026 to 2036
- By Country
- China
- Japan
- South Korea
- By Product Type
- By Nutritional Status
- By Product Form
- By End User
- By Sales Channel
- By Country
- Market Attractiveness Analysis
- By Country
- By Product Type
- By Nutritional Status
- By Product Form
- By End User
- By Sales Channel
- Key Takeaways
- South Asia and Pacific Market Analysis and Forecast, By Country
- Historical Market Size Value (USD Million) Trend Analysis By Market Taxonomy, 2021 to 2025
- Market Size Value (USD Million) Forecast By Market Taxonomy, 2026 to 2036
- By Country
- India
- ASEAN
- Australia and New Zealand
- By Product Type
- By Nutritional Status
- By Product Form
- By End User
- By Sales Channel
- By Country
- Market Attractiveness Analysis
- By Country
- By Product Type
- By Nutritional Status
- By Product Form
- By End User
- By Sales Channel
- Key Takeaways
- Middle East and Africa Market Analysis and Forecast, By Country
- Historical Market Size Value (USD Million) Trend Analysis By Market Taxonomy, 2021 to 2025
- Market Size Value (USD Million) Forecast By Market Taxonomy, 2026 to 2036
- By Country
- GCC Countries
- South Africa
- Türkiye
- Israel
- By Product Type
- By Nutritional Status
- By Product Form
- By End User
- By Sales Channel
- By Country
- Market Attractiveness Analysis
- By Country
- By Product Type
- By Nutritional Status
- By Product Form
- By End User
- By Sales Channel
- Key Takeaways
- Key Countries Market Analysis
- United States
- Pricing Analysis
- Market Share Analysis, 2025
- By Product Type
- By Nutritional Status
- By Product Form
- By End User
- By Sales Channel
- Canada
- Pricing Analysis
- Market Share Analysis, 2025
- By Product Type
- By Nutritional Status
- By Product Form
- By End User
- By Sales Channel
- Mexico
- Pricing Analysis
- Market Share Analysis, 2025
- By Product Type
- By Nutritional Status
- By Product Form
- By End User
- By Sales Channel
- Brazil
- Pricing Analysis
- Market Share Analysis, 2025
- By Product Type
- By Nutritional Status
- By Product Form
- By End User
- By Sales Channel
- Chile
- Pricing Analysis
- Market Share Analysis, 2025
- By Product Type
- By Nutritional Status
- By Product Form
- By End User
- By Sales Channel
- Germany
- Pricing Analysis
- Market Share Analysis, 2025
- By Product Type
- By Nutritional Status
- By Product Form
- By End User
- By Sales Channel
- United Kingdom
- Pricing Analysis
- Market Share Analysis, 2025
- By Product Type
- By Nutritional Status
- By Product Form
- By End User
- By Sales Channel
- Italy
- Pricing Analysis
- Market Share Analysis, 2025
- By Product Type
- By Nutritional Status
- By Product Form
- By End User
- By Sales Channel
- Spain
- Pricing Analysis
- Market Share Analysis, 2025
- By Product Type
- By Nutritional Status
- By Product Form
- By End User
- By Sales Channel
- France
- Pricing Analysis
- Market Share Analysis, 2025
- By Product Type
- By Nutritional Status
- By Product Form
- By End User
- By Sales Channel
- India
- Pricing Analysis
- Market Share Analysis, 2025
- By Product Type
- By Nutritional Status
- By Product Form
- By End User
- By Sales Channel
- ASEAN
- Pricing Analysis
- Market Share Analysis, 2025
- By Product Type
- By Nutritional Status
- By Product Form
- By End User
- By Sales Channel
- Australia and New Zealand
- Pricing Analysis
- Market Share Analysis, 2025
- By Product Type
- By Nutritional Status
- By Product Form
- By End User
- By Sales Channel
- China
- Pricing Analysis
- Market Share Analysis, 2025
- By Product Type
- By Nutritional Status
- By Product Form
- By End User
- By Sales Channel
- Japan
- Pricing Analysis
- Market Share Analysis, 2025
- By Product Type
- By Nutritional Status
- By Product Form
- By End User
- By Sales Channel
- South Korea
- Pricing Analysis
- Market Share Analysis, 2025
- By Product Type
- By Nutritional Status
- By Product Form
- By End User
- By Sales Channel
- Poland
- Pricing Analysis
- Market Share Analysis, 2025
- By Product Type
- By Nutritional Status
- By Product Form
- By End User
- By Sales Channel
- Hungary
- Pricing Analysis
- Market Share Analysis, 2025
- By Product Type
- By Nutritional Status
- By Product Form
- By End User
- By Sales Channel
- Türkiye
- Pricing Analysis
- Market Share Analysis, 2025
- By Product Type
- By Nutritional Status
- By Product Form
- By End User
- By Sales Channel
- South Africa
- Pricing Analysis
- Market Share Analysis, 2025
- By Product Type
- By Nutritional Status
- By Product Form
- By End User
- By Sales Channel
- United States
- Market Structure Analysis
- Competition Dashboard
- Competition Benchmarking
- Market Share Analysis of Top Players
- By Regional
- By Product Type
- By Nutritional Status
- By Product Form
- By End User
- By Sales Channel
- Emerging Startups
- Innovation Benchmarking
- Competition Analysis
- Competition Deep Dive
- Nestle Health Science (Peptamen)
- Overview
- Product Portfolio
- Profitability by Market Segments
- Sales Footprint
- Strategy Overview
- Marketing Strategy
- Product Strategy
- Channel Strategy
- Abbott
- Danone Nutricia
- Fresenius Kabi
- Vitaflo / Nestle Health Science
- Kate Farms
- Medtrition
- Victus
- Nestle Health Science (Peptamen)
- Case Studies
- Success Stories
- Recent Developments
- Competition Deep Dive
- Assumptions & Acronyms Used
List of Tables
- Table 1: Global Market Value (USD Million) Forecast by Region, 2021 to 2036
- Table 2: Global Market Value (USD Million) Forecast by Product Type, 2021 to 2036
- Table 3: Global Market Value (USD Million) Forecast by Nutritional Status, 2021 to 2036
- Table 4: Global Market Value (USD Million) Forecast by Product Form, 2021 to 2036
- Table 5: Global Market Value (USD Million) Forecast by End User, 2021 to 2036
- Table 6: Global Market Value (USD Million) Forecast by Sales Channel, 2021 to 2036
- Table 7: North America Market Value (USD Million) Forecast by Country, 2021 to 2036
- Table 8: North America Market Value (USD Million) Forecast by Product Type, 2021 to 2036
- Table 9: North America Market Value (USD Million) Forecast by Nutritional Status, 2021 to 2036
- Table 10: North America Market Value (USD Million) Forecast by Product Form, 2021 to 2036
- Table 11: North America Market Value (USD Million) Forecast by End User, 2021 to 2036
- Table 12: North America Market Value (USD Million) Forecast by Sales Channel, 2021 to 2036
- Table 13: Latin America Market Value (USD Million) Forecast by Country, 2021 to 2036
- Table 14: Latin America Market Value (USD Million) Forecast by Product Type, 2021 to 2036
- Table 15: Latin America Market Value (USD Million) Forecast by Nutritional Status, 2021 to 2036
- Table 16: Latin America Market Value (USD Million) Forecast by Product Form, 2021 to 2036
- Table 17: Latin America Market Value (USD Million) Forecast by End User, 2021 to 2036
- Table 18: Latin America Market Value (USD Million) Forecast by Sales Channel, 2021 to 2036
- Table 19: Western Europe Market Value (USD Million) Forecast by Country, 2021 to 2036
- Table 20: Western Europe Market Value (USD Million) Forecast by Product Type, 2021 to 2036
- Table 21: Western Europe Market Value (USD Million) Forecast by Nutritional Status, 2021 to 2036
- Table 22: Western Europe Market Value (USD Million) Forecast by Product Form, 2021 to 2036
- Table 23: Western Europe Market Value (USD Million) Forecast by End User, 2021 to 2036
- Table 24: Western Europe Market Value (USD Million) Forecast by Sales Channel, 2021 to 2036
- Table 25: Eastern Europe Market Value (USD Million) Forecast by Country, 2021 to 2036
- Table 26: Eastern Europe Market Value (USD Million) Forecast by Product Type, 2021 to 2036
- Table 27: Eastern Europe Market Value (USD Million) Forecast by Nutritional Status, 2021 to 2036
- Table 28: Eastern Europe Market Value (USD Million) Forecast by Product Form, 2021 to 2036
- Table 29: Eastern Europe Market Value (USD Million) Forecast by End User, 2021 to 2036
- Table 30: Eastern Europe Market Value (USD Million) Forecast by Sales Channel, 2021 to 2036
- Table 31: East Asia Market Value (USD Million) Forecast by Country, 2021 to 2036
- Table 32: East Asia Market Value (USD Million) Forecast by Product Type, 2021 to 2036
- Table 33: East Asia Market Value (USD Million) Forecast by Nutritional Status, 2021 to 2036
- Table 34: East Asia Market Value (USD Million) Forecast by Product Form, 2021 to 2036
- Table 35: East Asia Market Value (USD Million) Forecast by End User, 2021 to 2036
- Table 36: East Asia Market Value (USD Million) Forecast by Sales Channel, 2021 to 2036
- Table 37: South Asia and Pacific Market Value (USD Million) Forecast by Country, 2021 to 2036
- Table 38: South Asia and Pacific Market Value (USD Million) Forecast by Product Type, 2021 to 2036
- Table 39: South Asia and Pacific Market Value (USD Million) Forecast by Nutritional Status, 2021 to 2036
- Table 40: South Asia and Pacific Market Value (USD Million) Forecast by Product Form, 2021 to 2036
- Table 41: South Asia and Pacific Market Value (USD Million) Forecast by End User, 2021 to 2036
- Table 42: South Asia and Pacific Market Value (USD Million) Forecast by Sales Channel, 2021 to 2036
- Table 43: Middle East and Africa Market Value (USD Million) Forecast by Country, 2021 to 2036
- Table 44: Middle East and Africa Market Value (USD Million) Forecast by Product Type, 2021 to 2036
- Table 45: Middle East and Africa Market Value (USD Million) Forecast by Nutritional Status, 2021 to 2036
- Table 46: Middle East and Africa Market Value (USD Million) Forecast by Product Form, 2021 to 2036
- Table 47: Middle East and Africa Market Value (USD Million) Forecast by End User, 2021 to 2036
- Table 48: Middle East and Africa Market Value (USD Million) Forecast by Sales Channel, 2021 to 2036
List of Figures
- Figure 1: Global Market Pricing Analysis
- Figure 2: Global Market Value (USD Million) Forecast 2021-2036
- Figure 3: Global Market Value Share and BPS Analysis by Product Type, 2026 and 2036
- Figure 4: Global Market Y-o-Y Growth Comparison by Product Type, 2026-2036
- Figure 5: Global Market Attractiveness Analysis by Product Type
- Figure 6: Global Market Value Share and BPS Analysis by Nutritional Status, 2026 and 2036
- Figure 7: Global Market Y-o-Y Growth Comparison by Nutritional Status, 2026-2036
- Figure 8: Global Market Attractiveness Analysis by Nutritional Status
- Figure 9: Global Market Value Share and BPS Analysis by Product Form, 2026 and 2036
- Figure 10: Global Market Y-o-Y Growth Comparison by Product Form, 2026-2036
- Figure 11: Global Market Attractiveness Analysis by Product Form
- Figure 12: Global Market Value Share and BPS Analysis by End User, 2026 and 2036
- Figure 13: Global Market Y-o-Y Growth Comparison by End User, 2026-2036
- Figure 14: Global Market Attractiveness Analysis by End User
- Figure 15: Global Market Value Share and BPS Analysis by Sales Channel, 2026 and 2036
- Figure 16: Global Market Y-o-Y Growth Comparison by Sales Channel, 2026-2036
- Figure 17: Global Market Attractiveness Analysis by Sales Channel
- Figure 18: Global Market Value (USD Million) Share and BPS Analysis by Region, 2026 and 2036
- Figure 19: Global Market Y-o-Y Growth Comparison by Region, 2026-2036
- Figure 20: Global Market Attractiveness Analysis by Region
- Figure 21: North America Market Incremental Dollar Opportunity, 2026-2036
- Figure 22: Latin America Market Incremental Dollar Opportunity, 2026-2036
- Figure 23: Western Europe Market Incremental Dollar Opportunity, 2026-2036
- Figure 24: Eastern Europe Market Incremental Dollar Opportunity, 2026-2036
- Figure 25: East Asia Market Incremental Dollar Opportunity, 2026-2036
- Figure 26: South Asia and Pacific Market Incremental Dollar Opportunity, 2026-2036
- Figure 27: Middle East and Africa Market Incremental Dollar Opportunity, 2026-2036
- Figure 28: North America Market Value Share and BPS Analysis by Country, 2026 and 2036
- Figure 29: North America Market Value Share and BPS Analysis by Product Type, 2026 and 2036
- Figure 30: North America Market Y-o-Y Growth Comparison by Product Type, 2026-2036
- Figure 31: North America Market Attractiveness Analysis by Product Type
- Figure 32: North America Market Value Share and BPS Analysis by Nutritional Status, 2026 and 2036
- Figure 33: North America Market Y-o-Y Growth Comparison by Nutritional Status, 2026-2036
- Figure 34: North America Market Attractiveness Analysis by Nutritional Status
- Figure 35: North America Market Value Share and BPS Analysis by Product Form, 2026 and 2036
- Figure 36: North America Market Y-o-Y Growth Comparison by Product Form, 2026-2036
- Figure 37: North America Market Attractiveness Analysis by Product Form
- Figure 38: North America Market Value Share and BPS Analysis by End User, 2026 and 2036
- Figure 39: North America Market Y-o-Y Growth Comparison by End User, 2026-2036
- Figure 40: North America Market Attractiveness Analysis by End User
- Figure 41: North America Market Value Share and BPS Analysis by Sales Channel, 2026 and 2036
- Figure 42: North America Market Y-o-Y Growth Comparison by Sales Channel, 2026-2036
- Figure 43: North America Market Attractiveness Analysis by Sales Channel
- Figure 44: Latin America Market Value Share and BPS Analysis by Country, 2026 and 2036
- Figure 45: Latin America Market Value Share and BPS Analysis by Product Type, 2026 and 2036
- Figure 46: Latin America Market Y-o-Y Growth Comparison by Product Type, 2026-2036
- Figure 47: Latin America Market Attractiveness Analysis by Product Type
- Figure 48: Latin America Market Value Share and BPS Analysis by Nutritional Status, 2026 and 2036
- Figure 49: Latin America Market Y-o-Y Growth Comparison by Nutritional Status, 2026-2036
- Figure 50: Latin America Market Attractiveness Analysis by Nutritional Status
- Figure 51: Latin America Market Value Share and BPS Analysis by Product Form, 2026 and 2036
- Figure 52: Latin America Market Y-o-Y Growth Comparison by Product Form, 2026-2036
- Figure 53: Latin America Market Attractiveness Analysis by Product Form
- Figure 54: Latin America Market Value Share and BPS Analysis by End User, 2026 and 2036
- Figure 55: Latin America Market Y-o-Y Growth Comparison by End User, 2026-2036
- Figure 56: Latin America Market Attractiveness Analysis by End User
- Figure 57: Latin America Market Value Share and BPS Analysis by Sales Channel, 2026 and 2036
- Figure 58: Latin America Market Y-o-Y Growth Comparison by Sales Channel, 2026-2036
- Figure 59: Latin America Market Attractiveness Analysis by Sales Channel
- Figure 60: Western Europe Market Value Share and BPS Analysis by Country, 2026 and 2036
- Figure 61: Western Europe Market Value Share and BPS Analysis by Product Type, 2026 and 2036
- Figure 62: Western Europe Market Y-o-Y Growth Comparison by Product Type, 2026-2036
- Figure 63: Western Europe Market Attractiveness Analysis by Product Type
- Figure 64: Western Europe Market Value Share and BPS Analysis by Nutritional Status, 2026 and 2036
- Figure 65: Western Europe Market Y-o-Y Growth Comparison by Nutritional Status, 2026-2036
- Figure 66: Western Europe Market Attractiveness Analysis by Nutritional Status
- Figure 67: Western Europe Market Value Share and BPS Analysis by Product Form, 2026 and 2036
- Figure 68: Western Europe Market Y-o-Y Growth Comparison by Product Form, 2026-2036
- Figure 69: Western Europe Market Attractiveness Analysis by Product Form
- Figure 70: Western Europe Market Value Share and BPS Analysis by End User, 2026 and 2036
- Figure 71: Western Europe Market Y-o-Y Growth Comparison by End User, 2026-2036
- Figure 72: Western Europe Market Attractiveness Analysis by End User
- Figure 73: Western Europe Market Value Share and BPS Analysis by Sales Channel, 2026 and 2036
- Figure 74: Western Europe Market Y-o-Y Growth Comparison by Sales Channel, 2026-2036
- Figure 75: Western Europe Market Attractiveness Analysis by Sales Channel
- Figure 76: Eastern Europe Market Value Share and BPS Analysis by Country, 2026 and 2036
- Figure 77: Eastern Europe Market Value Share and BPS Analysis by Product Type, 2026 and 2036
- Figure 78: Eastern Europe Market Y-o-Y Growth Comparison by Product Type, 2026-2036
- Figure 79: Eastern Europe Market Attractiveness Analysis by Product Type
- Figure 80: Eastern Europe Market Value Share and BPS Analysis by Nutritional Status, 2026 and 2036
- Figure 81: Eastern Europe Market Y-o-Y Growth Comparison by Nutritional Status, 2026-2036
- Figure 82: Eastern Europe Market Attractiveness Analysis by Nutritional Status
- Figure 83: Eastern Europe Market Value Share and BPS Analysis by Product Form, 2026 and 2036
- Figure 84: Eastern Europe Market Y-o-Y Growth Comparison by Product Form, 2026-2036
- Figure 85: Eastern Europe Market Attractiveness Analysis by Product Form
- Figure 86: Eastern Europe Market Value Share and BPS Analysis by End User, 2026 and 2036
- Figure 87: Eastern Europe Market Y-o-Y Growth Comparison by End User, 2026-2036
- Figure 88: Eastern Europe Market Attractiveness Analysis by End User
- Figure 89: Eastern Europe Market Value Share and BPS Analysis by Sales Channel, 2026 and 2036
- Figure 90: Eastern Europe Market Y-o-Y Growth Comparison by Sales Channel, 2026-2036
- Figure 91: Eastern Europe Market Attractiveness Analysis by Sales Channel
- Figure 92: East Asia Market Value Share and BPS Analysis by Country, 2026 and 2036
- Figure 93: East Asia Market Value Share and BPS Analysis by Product Type, 2026 and 2036
- Figure 94: East Asia Market Y-o-Y Growth Comparison by Product Type, 2026-2036
- Figure 95: East Asia Market Attractiveness Analysis by Product Type
- Figure 96: East Asia Market Value Share and BPS Analysis by Nutritional Status, 2026 and 2036
- Figure 97: East Asia Market Y-o-Y Growth Comparison by Nutritional Status, 2026-2036
- Figure 98: East Asia Market Attractiveness Analysis by Nutritional Status
- Figure 99: East Asia Market Value Share and BPS Analysis by Product Form, 2026 and 2036
- Figure 100: East Asia Market Y-o-Y Growth Comparison by Product Form, 2026-2036
- Figure 101: East Asia Market Attractiveness Analysis by Product Form
- Figure 102: East Asia Market Value Share and BPS Analysis by End User, 2026 and 2036
- Figure 103: East Asia Market Y-o-Y Growth Comparison by End User, 2026-2036
- Figure 104: East Asia Market Attractiveness Analysis by End User
- Figure 105: East Asia Market Value Share and BPS Analysis by Sales Channel, 2026 and 2036
- Figure 106: East Asia Market Y-o-Y Growth Comparison by Sales Channel, 2026-2036
- Figure 107: East Asia Market Attractiveness Analysis by Sales Channel
- Figure 108: South Asia and Pacific Market Value Share and BPS Analysis by Country, 2026 and 2036
- Figure 109: South Asia and Pacific Market Value Share and BPS Analysis by Product Type, 2026 and 2036
- Figure 110: South Asia and Pacific Market Y-o-Y Growth Comparison by Product Type, 2026-2036
- Figure 111: South Asia and Pacific Market Attractiveness Analysis by Product Type
- Figure 112: South Asia and Pacific Market Value Share and BPS Analysis by Nutritional Status, 2026 and 2036
- Figure 113: South Asia and Pacific Market Y-o-Y Growth Comparison by Nutritional Status, 2026-2036
- Figure 114: South Asia and Pacific Market Attractiveness Analysis by Nutritional Status
- Figure 115: South Asia and Pacific Market Value Share and BPS Analysis by Product Form, 2026 and 2036
- Figure 116: South Asia and Pacific Market Y-o-Y Growth Comparison by Product Form, 2026-2036
- Figure 117: South Asia and Pacific Market Attractiveness Analysis by Product Form
- Figure 118: South Asia and Pacific Market Value Share and BPS Analysis by End User, 2026 and 2036
- Figure 119: South Asia and Pacific Market Y-o-Y Growth Comparison by End User, 2026-2036
- Figure 120: South Asia and Pacific Market Attractiveness Analysis by End User
- Figure 121: South Asia and Pacific Market Value Share and BPS Analysis by Sales Channel, 2026 and 2036
- Figure 122: South Asia and Pacific Market Y-o-Y Growth Comparison by Sales Channel, 2026-2036
- Figure 123: South Asia and Pacific Market Attractiveness Analysis by Sales Channel
- Figure 124: Middle East and Africa Market Value Share and BPS Analysis by Country, 2026 and 2036
- Figure 125: Middle East and Africa Market Value Share and BPS Analysis by Product Type, 2026 and 2036
- Figure 126: Middle East and Africa Market Y-o-Y Growth Comparison by Product Type, 2026-2036
- Figure 127: Middle East and Africa Market Attractiveness Analysis by Product Type
- Figure 128: Middle East and Africa Market Value Share and BPS Analysis by Nutritional Status, 2026 and 2036
- Figure 129: Middle East and Africa Market Y-o-Y Growth Comparison by Nutritional Status, 2026-2036
- Figure 130: Middle East and Africa Market Attractiveness Analysis by Nutritional Status
- Figure 131: Middle East and Africa Market Value Share and BPS Analysis by Product Form, 2026 and 2036
- Figure 132: Middle East and Africa Market Y-o-Y Growth Comparison by Product Form, 2026-2036
- Figure 133: Middle East and Africa Market Attractiveness Analysis by Product Form
- Figure 134: Middle East and Africa Market Value Share and BPS Analysis by End User, 2026 and 2036
- Figure 135: Middle East and Africa Market Y-o-Y Growth Comparison by End User, 2026-2036
- Figure 136: Middle East and Africa Market Attractiveness Analysis by End User
- Figure 137: Middle East and Africa Market Value Share and BPS Analysis by Sales Channel, 2026 and 2036
- Figure 138: Middle East and Africa Market Y-o-Y Growth Comparison by Sales Channel, 2026-2036
- Figure 139: Middle East and Africa Market Attractiveness Analysis by Sales Channel
- Figure 140: Global Market - Tier Structure Analysis
- Figure 141: Global Market - Company Share Analysis
Frequently Asked Questions
How large is the Chronic Pancreatitis Nutrition Market expected to be in 2026?
Future Market Insights estimates that the chronic pancreatitis nutrition market will reach USD 214.6 million in 2026. The market is projected to expand further and reach USD 434.1 million by 2036 owing to wider clinical recognition of malabsorption and nutritional deficiencies.
What CAGR is forecast for the Chronic Pancreatitis Nutrition Market through 2036?
The chronic pancreatitis nutrition market is projected to grow at a 7.3% CAGR from 2026 to 2036. Growth is supported by earlier nutrition screening and continuation of prescribed formulas from hospital discharge into homecare.
Which product type holds a notable chronic pancreatitis nutrition demand share in 2026?
Future Market Insights projects MCT-rich ONS to hold 47.7% of product type demand in 2026. The segment benefits from concentrated energy delivery when fat malabsorption persists despite pancreatic enzyme replacement therapy.
Which product form holds a notable chronic pancreatitis nutrition share in 2026?
FMI finds that powders will hold 48.0% of product form demand in 2026. Demand is supported by flexible preparation volume and titration of calorie density around patient digestive tolerance.
Which country has a notable chronic pancreatitis nutrition expansion outlook during the forecast period?
South Korea is anticipated to expand at a 7.6% CAGR during the 2026 to 2036 assessment period. Growth is supported by broad national health insurance coverage and longitudinal claims tracking across outpatient care.
Which companies are active in the Chronic Pancreatitis Nutrition Market during 2026?
Notable companies include Nestlé Health Science, Abbott, Danone Nutricia, Fresenius Kabi, Vitaflo, Kate Farms, Medtrition, and Victus. These companies are focusing on peptide-based formulations, plant-based alternatives, and specialized hospital-to-home delivery platforms.
Preview the report firsthand - request a free sample
Get SampleGet the brochure for pricing and purchase details.
Get PDF
