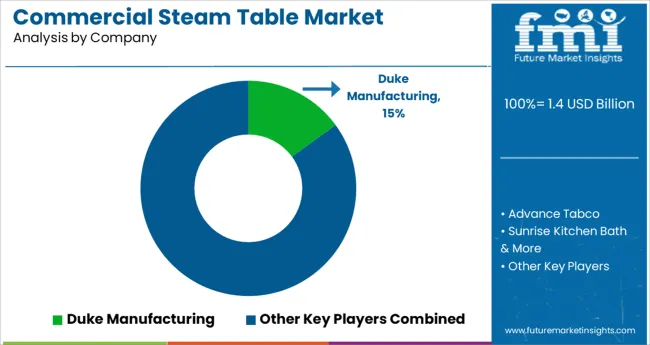
The Commercial Steam Table Market is estimated to be valued at USD 1.4 billion in 2025 and is projected to reach USD 1.9 billion by 2035, registering a compound annual growth rate (CAGR) of 3.3% over the forecast period.
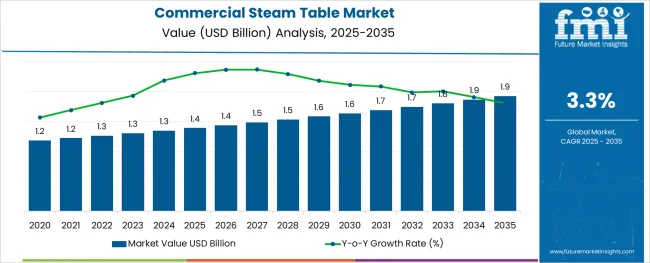
The commercial steam table market is experiencing steady growth as foodservice establishments increasingly prioritize efficiency, food safety, and presentation quality in their operations. Rising consumer expectations for freshly served and properly held food have encouraged widespread adoption of steam tables across diverse dining formats.
The market is being shaped by evolving food safety regulations, growing demand for buffet and self-service models, and the emphasis on energy-efficient equipment in professional kitchens. Manufacturers are focusing on durability, ease of cleaning, and integration with modern kitchen workflows to enhance appeal.
The future outlook remains optimistic as urbanization, expansion of the hospitality sector, and innovation in heating technologies create further opportunities for adoption. Additionally, the need for equipment that supports both operational efficiency and compliance with hygiene standards continues to pave the path for long-term market growth.
The market is segmented by Type, Application, Portability, and Well Type and region. By Type, the market is divided into Stainless Steel, Aluminum, and Other Types. In terms of Application, the market is classified into Restaurants, Hotels, Cafeterias, and Other Applications. Based on Portability, the market is segmented into Stationary and Portable.
By Well Type, the market is divided into 5 Well, 4 Well, 6 Well, and Other Well Types. Regionally, the market is classified into North America, Latin America, Western Europe, Eastern Europe, Balkan & Baltic Countries, Russia & Belarus, Central Asia, East Asia, South Asia & Pacific, and the Middle East & Africa.
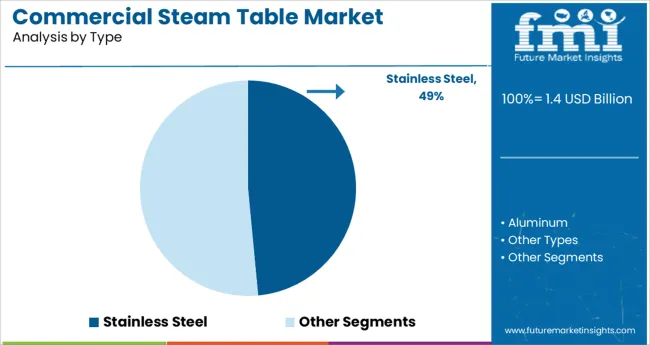
When segmented by type, the stainless steel segment is anticipated to hold 48.5% of the total market revenue in 2025, making it the leading type. This leadership has been attributed to the material’s inherent durability, resistance to corrosion, and ability to maintain hygiene standards in high-volume kitchen environments.
The preference for stainless steel has been reinforced by its ease of cleaning and its capability to withstand constant exposure to heat, moisture, and cleaning agents without degradation. Operators have been observed favoring stainless steel steam tables for their long service life and compatibility with rigorous food safety protocols.
Furthermore, the aesthetic appeal of stainless steel, which aligns with modern commercial kitchen designs, has contributed to its prominence. The combination of functional benefits and compliance with regulatory standards has firmly established stainless steel as the material of choice in this market.
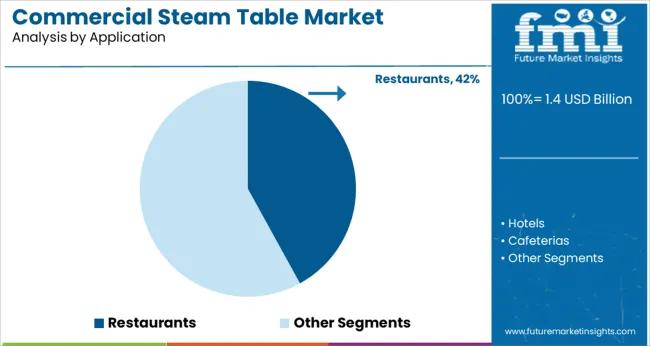
In terms of application, the restaurants segment is expected to command 42.0% of the market revenue in 2025, positioning it as the top application segment. This prominence has been supported by the widespread deployment of steam tables in both quick-service and full-service restaurants to maintain optimal food temperature and quality during service.
The growing prevalence of buffet-style dining and the need to meet stringent health and safety requirements have encouraged restaurant operators to invest in reliable steam table solutions. Operational efficiency has been enhanced as these units reduce food wastage and ensure consistent product presentation, which is critical for customer satisfaction and brand reputation.
The ability to accommodate high customer turnover while maintaining food integrity has reinforced the dominance of the restaurants segment in driving steam table adoption across the commercial foodservice landscape.
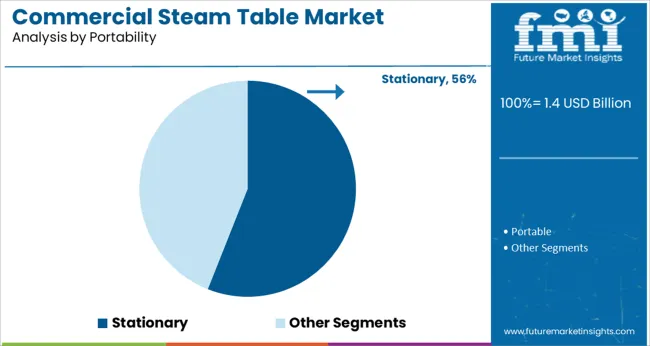
When segmented by portability, the stationary segment is projected to capture 56.0% of the market revenue in 2025, securing its position as the leading portability option. This dominance has been driven by the preference of foodservice operators for fixed installations that integrate seamlessly with kitchen layouts and provide superior stability during heavy use.
Stationary steam tables have been favored for their larger capacity, enhanced durability, and ability to handle continuous operations without the need for frequent repositioning. Their integration with other built-in kitchen equipment and utilities has enabled smoother workflows and reduced downtime, contributing to operational efficiency.
Additionally, stationary units have been perceived as a long-term investment, offering robust performance and aligning with the structured nature of most commercial kitchens, which has solidified their leadership in the market.
The commercial steam table market observed a valuation of USD 1.4 billion in 2025. Over the forecast period, the market is anticipated to reach a valuation of USD 1.9 billion by 2035 end. The market enjoyed healthy growth between 2020 to 2025 owing to the extending food and beverage industry, rising disposable incomes, social gatherings, and the growing inclination of consumers to dine out.
The CAGR of the overall commercial steam table market is estimated to be 3.3% over the forecast period, significantly lower than the CAGR of 5.4% witnessed in the historical period.
This can be attributed to the emerging new technologies that intend to keep the food warm by doing away with the inconveniences witnessed during the usage of commercial steam tables.
One such novel technology is the mica heater which substitutes a steam table with a dry well, developed by Datec Coating Corporation. The usage of these dry wells offers several benefits, such as reduced energy cost, better space utilization, reduced labor cost, and decreased cost of installation.
The provision of these many benefits not offered by traditional steam tables is likely to restrict market development over the coming years.
The manufacturers in the global commercial steam table market are focusing on the development of advanced, new products equipped with features that help shrink the hazard factors and boost their swift and successful operation.
Additionally, the firms providing commercial steam tables are utilizing their resources to grow their creative faculties and obtaining certifications from Underwriter Laboratories (UL) LLC and National Sanitation Foundation (NSF) to meet the rising demand for commercial steam tables. Commercial steam table manufacturers consent to various potency effectiveness prerequisites mandated by regulatory authorities.
Moreover, the companies are adopting cost-decrease techniques, in addition to zeroing in on enhancing the product contributions by distinguishing their end-user applications and concentrating on mergers and acquisitions, thus creating a wide pool of opportunities to profit over the forecast period.
Additionally, the growing demand for effectively operating commercial steam tables by the restaurant, catering, hospitality, and education businesses are anticipated to propel the market over the forecast period.
The emerging technological developments to replace conventional steam tables are posing a significant threat to the growth of the commercial steam table market. In 2025, Datec Coating Corporation, which is a Canada-based manufacturer of heating elements, produced a mica heater to substitute the use of conventional steam tables with dry wells.
These dry wells do not need water to maintain the warm temperature of food. Instead, it heats the air enveloped around the food pan, thus ensuring the warmth and freshness of the food item. The usage of these dry wells results in a thin, low-profile, lightweight, and uniform heating solution.
Furthermore, the market growth is predicted to be adversely affected by a host of inconveniences witnessed during the utilization of commercial steam tables. First and foremost, the high operating costs of these steam tables as a consequence of the continuous requirement for heated water.
Additionally, the potential safety hazard posed by commercial steam tables for employees who risk being harmed by hot water and steam while changing the food pans is likely to hamper its adoption rate.
Moreover, the need for extra labor to replace the water, which evaporates as it heats, is also putting a constraint on the demand for commercial steam tables.
Further, some steam tables need costly plumbing, which might dissuade the end users from investing in this item. Extensive cleaning at day end and difficulty removing limescale are some other drawbacks to the market development in coming years.
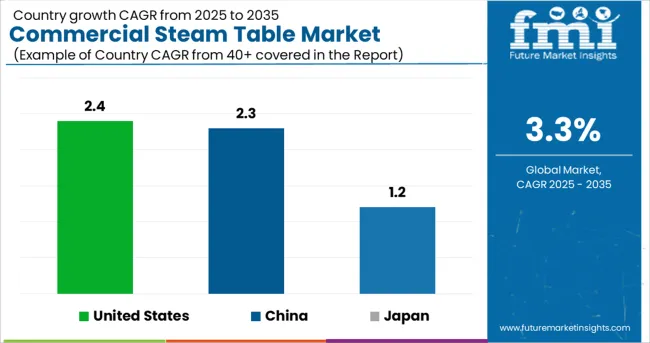
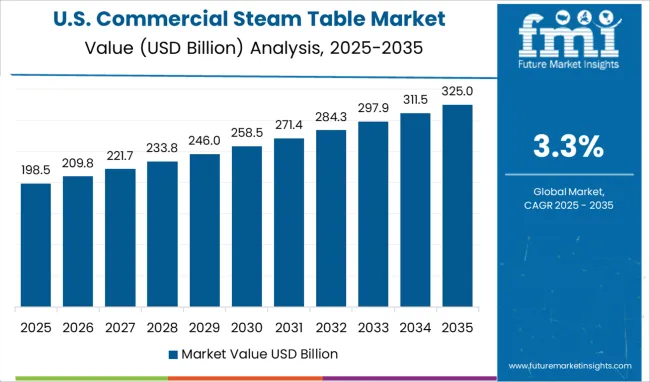
Growing at a CAGR of 2.4% over the forecast period of 2025 to 2035, the United States commercial steam table market is projected to attain a market value of USD 1.9 million by 2035 end. The market is being driven by the presence of major manufacturers in the market.
Further, the rising research and development activities in the market are inciting new product developments in the market equipped with functionalities that support the efficient and quick operation of the steam table for commercial purposes.
The rising demand for healthy modes to warm food provided by the commercial steam table as they heat the food by boiling water instead of butter and oil are, thus bolstering the demand for commercial steam tables.
The China commercial steam table market is predicted to hold the largest market share, in terms of value, after the USA market. The country is estimated to account for a market value of USD 117.8 million by 2035, growing at a CAGR of 2.3% over the forecast period.
Prime factors contributing to market expansion include the large population in the country, rapid urbanization, and robust expansion of the food and beverage industry in China. Further, the growing consciousness around consuming warm food heated at an appropriate temperature at a large gathering or while dining out to ensure the consumption of healthy food is propelling the demand for commercial steam tables in the region.
Japan's commercial steam table market is predicted to attain a market valuation of USD 94.2 million by 2035 end, expanding at a CAGR of 1.2% between 2025 to 2035.
The growth factors for the Japanese market include the thriving food and beverage industry in the region, rising disposable incomes, and a growing number of consumers who prefer to eat out at restaurants, hotels, and cafes. Additionally, the surging demand for the consumption of healthy food, which has its nutrients preserved, is also aiding the market growth in the region.
The United Kingdom commercial steam table market is estimated to attain a value of USD 67.7 million by 2035 end, witnessing a CAGR of 1.5% over the forecast period 2025 to 2035. The rising availability of different types of commercial steam tables in the country is aiding the market growth.
Further, the commercial steam tables have the capacity to hold bulk foods and large quantities of food items, like vegetables, pasta, etc., thus boosting its demand in the HORECA sector. In addition to this, the growing innovations and product launches in the market are catalyzing market development in the region.
The global commercial steam table market is being aided by technological advancement in the industry, mergers and acquisitions, and market competition.
Further, the rising number of domestic sellers providing explicit products for several end-users is creating opportunities for enterprises to extend their footprints in the market. Recent developments in steam equipment industry are aiding the market for a commercial steam table. Following is one such recent development:
| Attribute | Details |
|---|---|
| Growth Rate | CAGR of 3.3% from 2025 to 2035 |
| Base Year of Estimation | 2025 |
| Historical Data | 2020 to 2025 |
| Forecast Period | 2025 to 2035 |
| Quantitative Units | Revenue in million and Volume in Units and F-CAGR from 2025 to 2035 |
| Report Coverage | Revenue Forecast, Volume Forecast, Company Ranking, Competitive Landscape, growth factors, Trends, and Pricing Analysis |
| Key Segments Covered | By Type, By Application, By Portability, By Well Type, By Region |
| Regions Covered | North America; Latin America; Europe; East Asia; South Asia; Middle East & Africa; Oceania |
| Key Countries Profiled | The USA, Canada, Brazil, Mexico, Germany, Italy, France,The United Kingdom, Spain, Russia, China, Japan, India, GCC Countries, Australia |
| Key Companies Profiled | Advance Tabco; Duke Manufacturing; Sunrise Kitchen Bath & More; SYBO; VEVOR; TigerChef; Vollrath Foodservice; Universal Coolers; Winco; Unified Brands |
| Customization & Pricing | Available upon Request |
The global commercial steam table market is estimated to be valued at USD 1.4 billion in 2025.
It is projected to reach USD 1.9 billion by 2035.
The market is expected to grow at a 3.3% CAGR between 2025 and 2035.
The key product types are stainless steel, aluminum and other types.
restaurants segment is expected to dominate with a 42.0% industry share in 2025.


Our Research Products

The "Full Research Suite" delivers actionable market intel, deep dives on markets or technologies, so clients act faster, cut risk, and unlock growth.

The Leaderboard benchmarks and ranks top vendors, classifying them as Established Leaders, Leading Challengers, or Disruptors & Challengers.

Locates where complements amplify value and substitutes erode it, forecasting net impact by horizon

We deliver granular, decision-grade intel: market sizing, 5-year forecasts, pricing, adoption, usage, revenue, and operational KPIs—plus competitor tracking, regulation, and value chains—across 60 countries broadly.

Spot the shifts before they hit your P&L. We track inflection points, adoption curves, pricing moves, and ecosystem plays to show where demand is heading, why it is changing, and what to do next across high-growth markets and disruptive tech

Real-time reads of user behavior. We track shifting priorities, perceptions of today’s and next-gen services, and provider experience, then pace how fast tech moves from trial to adoption, blending buyer, consumer, and channel inputs with social signals (#WhySwitch, #UX).

Partner with our analyst team to build a custom report designed around your business priorities. From analysing market trends to assessing competitors or crafting bespoke datasets, we tailor insights to your needs.
Supplier Intelligence
Discovery & Profiling
Capacity & Footprint
Performance & Risk
Compliance & Governance
Commercial Readiness
Who Supplies Whom
Scorecards & Shortlists
Playbooks & Docs
Category Intelligence
Definition & Scope
Demand & Use Cases
Cost Drivers
Market Structure
Supply Chain Map
Trade & Policy
Operating Norms
Deliverables
Buyer Intelligence
Account Basics
Spend & Scope
Procurement Model
Vendor Requirements
Terms & Policies
Entry Strategy
Pain Points & Triggers
Outputs
Pricing Analysis
Benchmarks
Trends
Should-Cost
Indexation
Landed Cost
Commercial Terms
Deliverables
Brand Analysis
Positioning & Value Prop
Share & Presence
Customer Evidence
Go-to-Market
Digital & Reputation
Compliance & Trust
KPIs & Gaps
Outputs
Full Research Suite comprises of:
Market outlook & trends analysis
Interviews & case studies
Strategic recommendations
Vendor profiles & capabilities analysis
5-year forecasts
8 regions and 60+ country-level data splits
Market segment data splits
12 months of continuous data updates
DELIVERED AS:
PDF EXCEL ONLINE
Commercial and Industrial Rotating Rack Oven Market Size and Share Forecast Outlook 2025 to 2035
Commercial Baking Rack Oven Market Size and Share Forecast Outlook 2025 to 2035
Commercial Blast Freezer Market Size and Share Forecast Outlook 2025 to 2035
Commercial Water Heater Market Size and Share Forecast Outlook 2025 to 2035
Commercial High-Speed Oven Market Size and Share Forecast Outlook 2025 to 2035
Commercial Turboprop Aircrafts Market Size and Share Forecast Outlook 2025 to 2035
Commercial Vehicle Foundation Brakes Market Size and Share Forecast Outlook 2025 to 2035
Commercial Vehicle Brake Chambers Market Size and Share Forecast Outlook 2025 to 2035
Commercial Vehicles LED Bar Lights Market Size and Share Forecast Outlook 2025 to 2035
Commercial Vehicle AMT Transmission Market Size and Share Forecast Outlook 2025 to 2035
Commercial Greenhouse Market Size and Share Forecast Outlook 2025 to 2035
Commercial Vessel Market Size and Share Forecast Outlook 2025 to 2035
Commercial Slush Machine Market Size and Share Forecast Outlook 2025 to 2035
Commercial Medium Voltage Distribution Panel Market Size and Share Forecast Outlook 2025 to 2035
Commercial Earth Observation (CEO) Market Size and Share Forecast Outlook 2025 to 2035
Commercial Ozone Generator Market Size and Share Forecast Outlook 2025 to 2035
Commercial Gas-Fired Boiler Market Size and Share Forecast Outlook 2025 to 2035
Commercial Deep Fryer Parts & Accessories Market Size and Share Forecast Outlook 2025 to 2035
Commercial Gas Restaurant Ranges Market Size and Share Forecast Outlook 2025 to 2035
Commercial Heat Pump Market Size and Share Forecast Outlook 2025 to 2035

Thank you!
You will receive an email from our Business Development Manager. Please be sure to check your SPAM/JUNK folder too.
Chat With
MaRIA