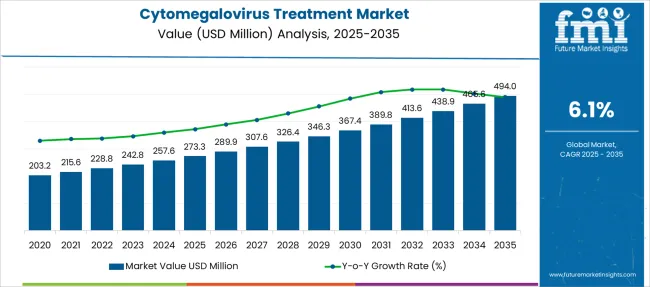
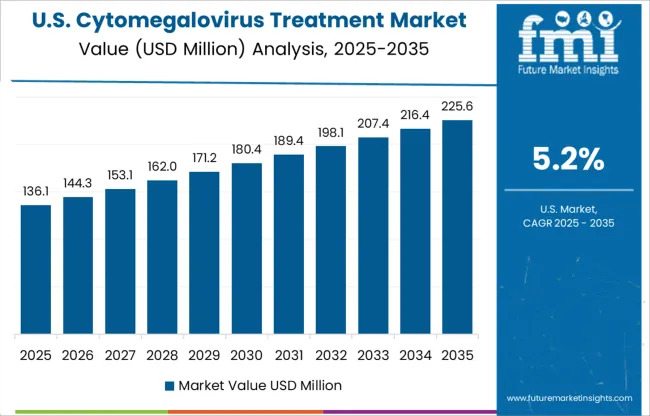
[221 Pages Report] Revenue from the global cytomegalovirus treatment market currently stands at USD 228.8 Million in 2022. Rising at a CAGR of 6.1% (2022 to 2028), demand for cytomegalovirus treatment is predicted to reach a market valuation of USD 326 Million by the end of 2028.
Attribute | Details |
---|---|
Global Cytomegalovirus Treatment Market Size (2022) | USD 228.8 Million |
Net Revenue Estimation (2028) | USD 326 Million |
Global Growth Rate (2022 to 2028) | 6.1% CAGR |
Market Share of Hospital Pharmacies | 47.8% |
Cytomegalovirus treatment contributes 0.8% to the global infectious disease diagnostics market revenue. Increasing instances of viral infections and rising awareness of cytomegalovirus symptoms are expected to propel demand for cytomegalovirus treatment on a global level.
Particulars | Details |
---|---|
H1, 2021 | 6.10% |
H1, 2022 Projected | 6.08% |
H1, 2022 Outlook | 5.48% |
BPS Change - H1, 2022 (O) - H1, 2022 (P) | (-) 60 ↓ |
BPS Change - H1, 2022 (O) - H1, 2021 | (-) 62 ↓ |
The comparative analysis and market growth rate of global cytomegalovirus treatment market as studied by Future Market Insights, will show a negative BPS growth in H1-2022 outlook as compared to H1-2022 projected period by 60 BPS. A decline in BPS growth is expected in H1-2022 over H1- 2021 duration with 62 Basis Point Share (BPS).
The market for cytomegalovirus treatment is subject to changes as per the macro and industrial standards in relevance to stringent regulations in biopharmaceuticals development and production and licensing.
The market observes a decline in the BPS values owed to the inefficacy of the therapy in patients with severe immunosuppression or disseminated disease. With the rising cases of such incidences after the global coronavirus pandemic, the limitations for cytomegalovirus treatment posed a negative impact upon the market growth, thus resulting in the dropped BPS values.
Conversely, with the recent FDA approval of the first drug for adults and paediatric patients with cytomegalovirus infections and diseases which cannot be managed with the current available antiviral treatment methods in 2022, has paved way for the market to observe a positive outlook towards growth over the forecasted years.
The key development in the market includes the adoption of oral antivirals such as ganciclovir for the management of cytomegalovirus in immunocompromised patients.
The world has seen substantial rise in viral infections and other infectious diseases, and this has propelled demand for better diagnostic and treatment solutions. The cytomegalovirus treatment market exhibited expansion at a CAGR of 5.7% from 2013 to 2021.
Increasing prevalence of congenital CMV infections, rising awareness about cytomegalovirus symptoms, increasing spending on research & development activities, rising clinical trials and studies for CMV infections, etc., are major trends that will guide cytomegalovirus treatment demand through 2028.
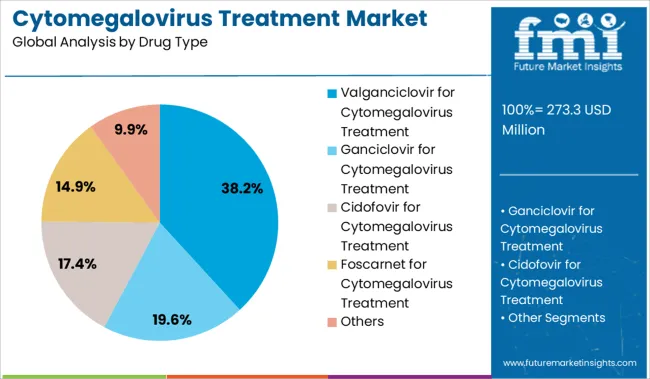
The risk of reactivation of cytomegalovirus infections in multiple individuals has been observed and this is one of the areas of prime focus for many cytomegalovirus treatment providers. The use of antiviral agents that have very low risks associated with them is seeing high demand in the development of antiviral drugs for cytomegalovirus diseases. Antiviral agents such as ganciclovir and valganciclovir are expected to see a rise in popularity over the forecast period.
Risks and side effects associated with antiviral drugs for cytomegalovirus diseases are anticipated to restrain market potential to a certain extent over the forecast period. The cytomegalovirus treatment industry is projected to rise at a steady CAGR of 6.1% from 2022 to 2028.
Increasing Focus on Development of CMV Vaccines
Awareness of cytomegalovirus symptoms is being raised across the world by multiple initiatives taken by governments and non-profit organizations to bolster public safety. Clinical trials are being carried out to boost the development of novel cytomegalovirus treatment.
Risks of Antiviral Drugs for Cytomegalovirus Diseases Could Adversely Impact Market Growth
Very little is known about CMV infections, and this has proven to be a major obstacle to cytomegalovirus diagnosis and cytomegalovirus testing. Increasing demand for cytomegalovirus natural treatment is also expected to constrain the adoption of antiviral drugs for cytomegalovirus diseases.
These factors are expected to have a hindering effect on global cytomegalovirus treatment device demand through 2028.
High R&D Activity in North America to Boost Cytomegalovirus Diagnosis
Detailed assessment of market stance across regions such as North America, Latin America, Europe, East Asia, South Asia & Pacific, and the Middle East & Africa (MEA) has been profiled in this revised FMI market analysis.
Demand for cytomegalovirus treatment products in North America is anticipated to hold a major market share in the global marketplace over the forecast. The presence of major cytomegalovirus treatment providers and rapid advancements in cytomegalovirus diagnosis and cytomegalovirus treatment are expected to shape market potential.
Rising prevalence of congenital CMV infections, increasing use of combinational antiviral therapies, and increasing awareness of cytomegalovirus treatment in stem cell transplants are expected to be major trends in the Europe cytomegalovirus treatment market over the forecast period.
Increasing investments in research & development activities, rising healthcare expenditure, and increasing popularity of cytomegalovirus natural treatment are major factors that influence cytomegalovirus treatment demand in South Asia and East Asia. Rising focus on boosting cytomegalovirus testing in these regions is expected to majorly favour market potential.
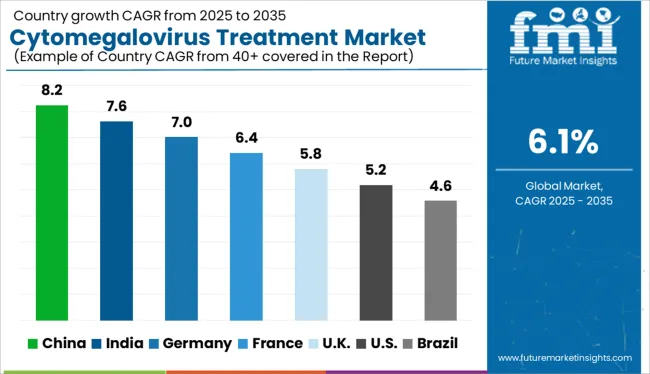
Increasing Focus on Healthcare & Rising Awareness about Cytomegalovirus Symptoms in India
The healthcare infrastructure in India is rapidly changing and the focus on health and hygiene has fostered a new wave of demand for better diagnostic and treatment solutions in the nation. Government initiatives are boosting awareness about viral infections and are further bolstering awareness about cytomegalovirus symptoms in India.
High population, increasing prevalence of HIV infections, high birthrate, etc., are some of the major factors that influence cytomegalovirus treatment market potential in India. Cytomegalovirus diagnosis and cytomegalovirus testing are expected to increase in India as awareness about cytomegalovirus symptoms increases through 2028.
High Research Activity to Explore Cytomegalovirus Pathology to Boost Market Potential
The USA is known for its well-established healthcare infrastructure, and this has made it a highly lucrative market for the healthcare industry. Cytomegalovirus treatment providers are expected to further advance their research & development activities to provide better cytomegalovirus diagnosis and treatment.
Rising research for cytomegalovirus testing, increasing investments from government and non-profit research organizations, and rising availability of cytomegalovirus diagnosis procedures are expected to be major factors influencing cytomegalovirus treatment market potential through 2028.
Hospital Pharmacies to Hold Dominant Market Share
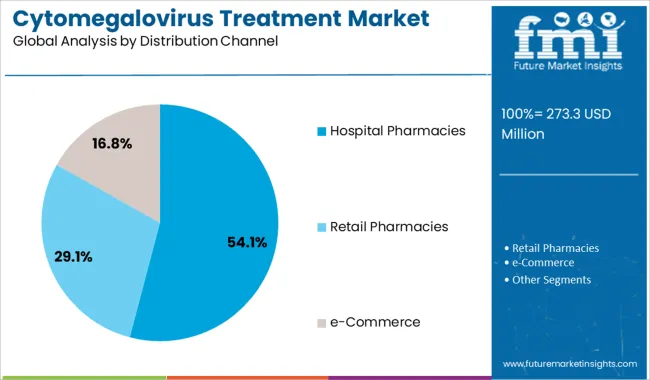
In 2022, hospital pharmacies account for 46.8% of the global cytomegalovirus treatment industry landscape. With most cytomegalovirus diagnosis procedures being accessible only through professional subscriptions, this has boosted their sales via hospital pharmacies, which are more accessible to patients and are recommended by professionals.
Other distribution channels such as retail pharmacies and e-Commerce currently hold market shares of 36.7% and 16.4%, respectively, in 2022, in the global cytomegalovirus treatment space.
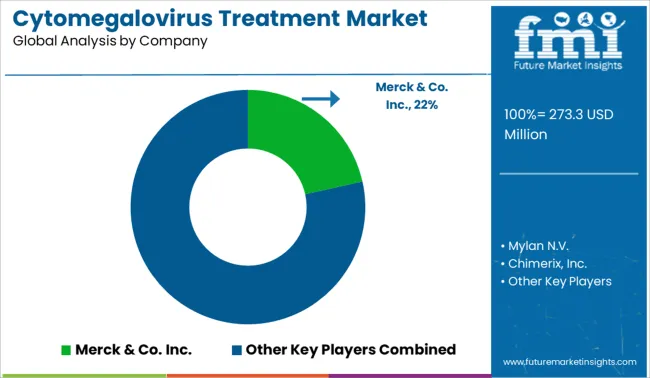
Cytomegalovirus treatment providers are investing in the research & development of innovative and more effective treatments for CMV infections.
Attribute | Details |
---|---|
Forecast Period | 2022 to 2028 |
Historical Data Available for | 2013 to 2021 |
Market Analysis | USD million for Value |
Key Regions Covered | North America; Latin America; Europe; East Asia; South Asia & Pacific; Middle East & Africa (MEA) |
Key Countries Covered | United States, Canada, Brazil, Mexico, Germany, UK, France, Spain, Italy, China, Japan, South Korea, India, Indonesia, Malaysia, Singapore, Australia, New Zealand, Turkey, South Africa, and GCC Countries |
Key Market Segments Covered | Drug Type, Application, Distribution Channel, Region |
Key Companies Profiled | Chimerix Inc.; Thermo Fisher Scientific; Abbot; Becton Dickinson and Company; Pfizer Inc.; Merck & Company Inc.; Mylan N.V.; Johnson & Johnson; Bio-Rad Laboratories Inc.; F. Hoffmann-La Roche Ltd. |
Pricing | Available upon Request |
Table 01: Expenditure on Health, (% of GDP), by Country, 2013 - 2021
Table 02: Expenditure on Health, (% of GDP), by Country, 2013 - 2021
Table 03: Respective codes for Cytomegalovirus Treatment
Table 04: North America Cytomegalovirus Treatment Market Value (US$ Mn) Analysis 2013-2021 and Opportunity Assessment 2022-2028, By Country
Table 05: North America Cytomegalovirus Treatment Market Value (US$ Mn) Analysis 2013-2021 and Opportunity Assessment 2022-2028, By Drug Type
Table 06: North America Cytomegalovirus Treatment Market Value (US$ Mn) Analysis 2013-2021 and Opportunity Assessment 2022-2028, By Application
Table 07: North America Cytomegalovirus Treatment Market Value (US$ Mn) Analysis 2013-2021 and Opportunity Assessment 2022-2028, By Distribution Channel
Table 08: Latin America Cytomegalovirus Treatment Market Value (US$ Mn) Analysis 2013-2021 and Opportunity Assessment 2022-2028, By Country
Table 09: Latin America Cytomegalovirus Treatment Market Value (US$ Mn) Analysis 2013-2021 and Opportunity Assessment 2022-2028, By Drug Type
Table 10: Latin America Cytomegalovirus Treatment Market Value (US$ Mn) Analysis 2013-2021 and Opportunity Assessment 2022-2028, By Application
Table 11: Latin America Cytomegalovirus Treatment Market Value (US$ Mn) Analysis 2013-2021 and Opportunity Assessment 2022-2028, By Distribution Channel
Table 12: Western Europe Cytomegalovirus Treatment Market Value (US$ Mn) Analysis 2013-2021 and Opportunity Assessment 2022-2028, By Country
Table 13: Western Europe Cytomegalovirus Treatment Market Value (US$ Mn) Analysis 2013-2021 and Opportunity Assessment 2022-2028, By Drug Type
Table 14: Western Europe Cytomegalovirus Treatment Market Value (US$ Mn) Analysis 2013-2021 and Opportunity Assessment 2022-2028, By Application
Table 15: Western Europe Cytomegalovirus Treatment Market Value (US$ Mn) Analysis 2013-2021 and Opportunity Assessment 2022-2028, By Distribution Channel
Table 16: Eastern Europe Cytomegalovirus Treatment Market Value (US$ Mn) Analysis 2013-2021 and Opportunity Assessment 2022-2028, By Country
Table 17: Eastern Europe Cytomegalovirus Treatment Market Value (US$ Mn) Analysis 2013-2021 and Opportunity Assessment 2022-2028, By Drug Type
Table 18: Eastern Europe Cytomegalovirus Treatment Market Value (US$ Mn) Analysis 2013-2021 and Opportunity Assessment 2022-2028, By Application
Table 19: Eastern Europe Cytomegalovirus Treatment Market Value (US$ Mn) Analysis 2013-2021 and Opportunity Assessment 2022-2028, By Distribution Channel
Table 20: APEC Cytomegalovirus Treatment Market Value (US$ Mn) Analysis 2013-2021 and Opportunity Assessment 2022-2028, By Country
Table 21: APEC Cytomegalovirus Treatment Market Value (US$ Mn) Analysis 2013-2021 and Opportunity Assessment 2022-2028, By Drug Type
Table 22: APEC Cytomegalovirus Treatment Market Value (US$ Mn) Analysis 2013-2021 and Opportunity Assessment 2022-2028, By Application
Table 23: APEC Cytomegalovirus Treatment Market Value (US$ Mn) Analysis 2013-2021 and Opportunity Assessment 2022-2028, By Distribution Channel
Table 24: China Cytomegalovirus Treatment Market Value (US$ Mn) Analysis 2013-2021 and Opportunity Assessment 2022-2028, By Drug Type
Table 25: China Cytomegalovirus Treatment Market Value (US$ Mn) Analysis 2013-2021 and Opportunity Assessment 2022-2028, By Application
Table 26: China Cytomegalovirus Treatment Market Value (US$ Mn) Analysis 2013-2021 and Opportunity Assessment 2022-2028, By Distribution Channel
Table 27: MEA Cytomegalovirus Treatment Market Value (US$ Mn) Analysis 2013-2021 and Opportunity Assessment 2022-2028, By Country
Table 28: MEA Cytomegalovirus Treatment Market Value (US$ Mn) Analysis 2013-2021 and Opportunity Assessment 2022-2028, By Drug Type
Table 29: MEA Cytomegalovirus Treatment Market Value (US$ Mn) Analysis 2013-2021 and Opportunity Assessment 2022-2028, By Application
Table 30: MEA Cytomegalovirus Treatment Market Value (US$ Mn) Analysis 2013-2021 and Opportunity Assessment 2022-2028, By Distribution Channel
Table 31: Global Cytomegalovirus Treatment Market Value (US$ Mn) Analysis- and Opportunity Assessment 2022–2028, By Region
Table 32: Global Cytomegalovirus Treatment Market Value (US$ Mn) Analysis 2013-2021 and Opportunity Assessment 2022-2028, By Drug Type
Table 33: Global Cytomegalovirus Treatment Market Value (US$ Mn) Analysis 2013-2021 and Opportunity Assessment 2022-2028, By Application
Table 34: Global Cytomegalovirus Treatment Market Value (US$ Mn) Analysis 2013-2021 and Opportunity Assessment 2022-2028, By Distribution Channel
Figure 01: Global Cytomegalovirus Treatment Market Split By Drug Type (2022)
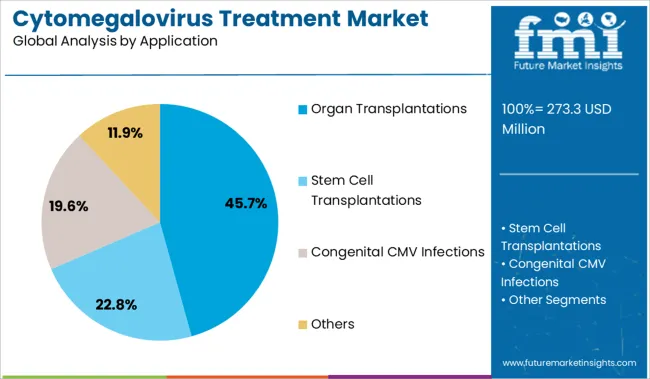
Figure 02: Global Cytomegalovirus Treatment Market Split By Application (2022)
Figure 03: Global Cytomegalovirus Treatment Market Value 2022 & 2028
Figure 04: Global Cytomegalovirus Treatment Market Split By Distribution Channel (2022)
Figure 05: Global Cytomegalovirus Treatment Market Split By Region (2022)
Figure 06: Global Overview of Clinical Trails, by Region
Figure 07: Clinical trials of cytomegalovirus treatments as reported, by Phase
Figure 08: Reported number of study type for each clinical trial
Figure 9: North America Cytomegalovirus Treatment Market Value Share, By Drug Type (2022)
Figure 10: North America Cytomegalovirus Treatment Market Value Share, By Application (2022)
Figure 11: North America Cytomegalovirus treatment market value analysis US$
Figure 12: North America Cytomegalovirus Treatment Market Value Share, By Distribution Channel (2022)
Figure 13: North America Cytomegalovirus Treatment Market Value Share, By Country (2022)
Figure 14: North America Cytomegalovirus Treatment Market Value (US$ Mn) Analysis, 2013–2021
Figure 15 : North America Cytomegalovirus Treatment Market Value (US$ Mn) & Y-o-Y Growth (%), 2022–2028
Figure 16: U.S. Cytomegalovirus Treatment Market Value (US$ Mn) Analysis, 2013–2021
Figure 17 : U.S. Cytomegalovirus Treatment Market Value (US$ Mn) & Y-o-Y Growth (%), 2022–2028
Figure 18: Canada Cytomegalovirus Treatment Market Value (US$ Mn) Analysis, 2013–2021
Figure 19 : Canada Cytomegalovirus Treatment Market Value (US$ Mn) & Y-o-Y Growth (%), 2022–2028
Figure 20 : North America Cytomegalovirus Treatment Market Value (US$ Mn) Analysis, 2013–2021, By Ganciclovir
Figure 21: North America Cytomegalovirus Treatment Market Value (US$ Mn) & Y-o-Y Growth (%), 2022–2028, By Ganciclovir
Figure 22: North America Cytomegalovirus Treatment Market Value (US$ Mn) Analysis, 2013–2021, By Valganciclovir
Figure 23: North America Cytomegalovirus Treatment Market Value (US$ Mn) & Y-o-Y Growth (%), 2022–2028, By Valganciclovir
Figure 24: North America Cytomegalovirus Treatment Market Value (US$ Mn) Analysis, 2013–2021, By Foscarnet
Figure 25: North America Cytomegalovirus Treatment Market Value (US$ Mn) & Y-o-Y Growth (%), 2022–2028, By Foscarnet
Figure 26: North America Cytomegalovirus Treatment Market Value (US$ Mn) Analysis, 2013–2021, By Cidofovir
Figure 27: North America Cytomegalovirus Treatment Market Value (US$ Mn) & Y-o-Y Growth (%), 2022–2028, By Cidofovir
Figure 28: North America Cytomegalovirus Treatment Market Value (US$ Mn) Analysis, 2013–2021, By Others
Figure 29: North America Cytomegalovirus Treatment Market Value (US$ Mn) & Y-o-Y Growth (%), 2022–2028, By Others
Figure 30: North America Cytomegalovirus Treatment Market Attractiveness Analysis, By Drug Type
Figure 31: North America Cytomegalovirus Treatment Market Attractiveness Analysis, By Application
Figure 32: North America Cytomegalovirus Treatment Market Attractiveness Analysis, By Distribution Channel
Figure 33: North America Cytomegalovirus Treatment Market Attractiveness Analysis, By Country
Figure 34: Latin America Cytomegalovirus Treatment Market Value Share, By Drug Type (2022)
Figure 35: Latin America Cytomegalovirus Treatment Market Value Share, By Application (2022)
Figure 36: Latin America Cytomegalovirus treatment market value analysis US$
Figure 37: Latin America Cytomegalovirus Treatment Market Value Share, By Distribution Channel (2022)
Figure 38: Latin America Cytomegalovirus Treatment Market Value Share, By Country (2022)
Figure 39: Latin America Cytomegalovirus Treatment Market Value (US$ Mn) Analysis, 2013–2021
Figure 40 : Latin America Cytomegalovirus Treatment Market Value (US$ Mn) & Y-o-Y Growth (%), 2022–2028
Figure 41: Brazil Cytomegalovirus Treatment Market Value (US$ Mn) Analysis, 2013–2021
Figure 42 : Brazil Cytomegalovirus Treatment Market Value (US$ Mn) & Y-o-Y Growth (%), 2022–2028
Figure 43: Mexico Cytomegalovirus Treatment Market Value (US$ Mn) Analysis, 2013–2021
Figure 44 : Mexico Cytomegalovirus Treatment Market Value (US$ Mn) & Y-o-Y Growth (%), 2022–2028
Figure 45 : Rest Of Latin America Cytomegalovirus Treatment Market Value (US$ Mn) Analysis, 2013–2021
Figure 46: Rest Of Latin America Cytomegalovirus Treatment Market Value (US$ Mn) & Y-o-Y Growth (%), 2022–2028
Figure 47 : Latin America Cytomegalovirus Treatment Market Value (US$ Mn) Analysis, 2013–2021, By Ganciclovir
Figure 48 : Latin America Cytomegalovirus Treatment Market Value (US$ Mn) & Y-o-Y Growth (%), 2022–2028, By Ganciclovir
Figure 49 : Latin America Cytomegalovirus Treatment Market Value (US$ Mn) Analysis, 2013–2021, By Valganciclovir
Figure 50 : Latin America Cytomegalovirus Treatment Market Value (US$ Mn) & Y-o-Y Growth (%), 2022–2028, By Valganciclovir
Figure 51 : Latin America Cytomegalovirus Treatment Market Value (US$ Mn) Analysis, 2013–2021, By Foscarnet
Figure 52: Latin America Cytomegalovirus Treatment Market Value (US$ Mn) & Y-o-Y Growth (%), 2022–2028, By Foscarnet
Figure 53: Latin America Cytomegalovirus Treatment Market Value (US$ Mn) Analysis, 2013–2021, By Cidofovir
Figure 54: Latin America Cytomegalovirus Treatment Market Value (US$ Mn) & Y-o-Y Growth (%), 2022–2028, By Cidofovir
Figure 55: Latin America Cytomegalovirus Treatment Market Value (US$ Mn) Analysis, 2013–2021, By Others
Figure 56: Latin America Cytomegalovirus Treatment Market Value (US$ Mn) & Y-o-Y Growth (%), 2022–2028, By Others
Figure 57: Latin America Cytomegalovirus Treatment Market Attractiveness Analysis, By Drug Type
Figure 58: Latin America Cytomegalovirus Treatment Market Attractiveness Analysis, By Application
Figure 59: Latin America Cytomegalovirus Treatment Market Attractiveness Analysis, By Distribution Channel
Figure 60: Latin America Cytomegalovirus Treatment Market Attractiveness Analysis, By Country
Figure 61: Western Europe Cytomegalovirus Treatment Market Value Share, By Drug Type (2022)
Figure 62: Western Europe Cytomegalovirus Treatment Market Value Share, By Application (2022)
Figure 63: Western Europe Cytomegalovirus treatment market value analysis US$
Figure 64: Western Europe Cytomegalovirus Treatment Market Value Share, By Distribution Channel (2022)
Figure 65: Western Europe Cytomegalovirus Treatment Market Value Share, By Country (2022)
Figure 66: Western Europe Cytomegalovirus Treatment Market Value (US$ Mn) Analysis, 2013–2021
Figure 67 : Western Europe Cytomegalovirus Treatment Market Value (US$ Mn) & Y-o-Y Growth (%), 2022–2028
Figure 68: U.K. Cytomegalovirus Treatment Market Value (US$ Mn) Analysis, 2013–2021
Figure 69 : U.K. Cytomegalovirus Treatment Market Value (US$ Mn) & Y-o-Y Growth (%), 2022–2028
Figure 70 : Germany Cytomegalovirus Treatment Market Value (US$ Mn) Analysis, 2013–2021
Figure 71: Germany Cytomegalovirus Treatment Market Value (US$ Mn) & Y-o-Y Growth (%), 2022–2028
Figure 72: France Cytomegalovirus Treatment Market Value (US$ Mn) Analysis, 2013–2021
Figure 73 : France Cytomegalovirus Treatment Market Value (US$ Mn) & Y-o-Y Growth (%), 2022–2028
Figure 74 : Italy Cytomegalovirus Treatment Market Value (US$ Mn) Analysis, 2013–2021
Figure 75 : Italy Cytomegalovirus Treatment Market Value (US$ Mn) & Y-o-Y Growth (%), 2022–2028
Figure 76: Spain Cytomegalovirus Treatment Market Value (US$ Mn) Analysis, 2013–2021
Figure 77: Spain Cytomegalovirus Treatment Market Value (US$ Mn) & Y-o-Y Growth (%), 2022–2028
Figure 78: Rest of Western Europe Cytomegalovirus Treatment Market Value (US$ Mn) Analysis, 2013–2021
Figure 79: Rest of Western Europe Cytomegalovirus Treatment Market Value (US$ Mn) & Y-o-Y Growth (%), 2022–2028
Figure 80 : Western Europe Cytomegalovirus Treatment Market Value (US$ Mn) Analysis, 2013–2021, By Ganciclovir
Figure 81: Western Europe Cytomegalovirus Treatment Market Value (US$ Mn) & Y-o-Y Growth (%), 2022–2028, By Ganciclovir
Figure 82: Western Europe Cytomegalovirus Treatment Market Value (US$ Mn) Analysis, 2013–2021, By Valganciclovir
Figure 83: Western Europe Cytomegalovirus Treatment Market Value (US$ Mn) & Y-o-Y Growth (%), 2022–2028, By Valganciclovir
Figure 84: Western Europe Cytomegalovirus Treatment Market Value (US$ Mn) Analysis, 2013–2021, By Foscarnet
Figure 85: Western Europe Cytomegalovirus Treatment Market Value (US$ Mn) & Y-o-Y Growth (%), 2022–2028, By Foscarnet
Figure 86: Western Europe Cytomegalovirus Treatment Market Value (US$ Mn) Analysis, 2013–2021, By Cidofovir
Figure 87: Western Europe Cytomegalovirus Treatment Market Value (US$ Mn) & Y-o-Y Growth (%), 2022–2028, By Cidofovir
Figure 88: Western Europe Cytomegalovirus Treatment Market Value (US$ Mn) Analysis, 2013–2021, By Others
Figure 89: Western Europe Cytomegalovirus Treatment Market Value (US$ Mn) & Y-o-Y Growth (%), 2022–2028, By Others
Figure 90: Western Europe Cytomegalovirus Treatment Market Attractiveness Analysis, By Drug Type
Figure 91: Western Europe Cytomegalovirus Treatment Market Attractiveness Analysis, By Application
Figure 92: Western Europe Cytomegalovirus Treatment Market Attractiveness Analysis, By Distribution Channel
Figure 93: Western Europe Cytomegalovirus Treatment Market Attractiveness Analysis, By Country
Figure 94: Eastern Europe Cytomegalovirus Treatment Market Value Share, By Drug Type (2022)
Figure 95: Eastern Europe Cytomegalovirus Treatment Market Value Share, By Application (2022)
Figure 96: Eastern Europe Cytomegalovirus treatment market value analysis US$
Figure 97: Eastern Europe Cytomegalovirus Treatment Market Value Share, By Distribution Channel (2022)
Figure 98: Eastern Europe Cytomegalovirus Treatment Market Value Share, By Country (2022)
Figure 99: Eastern Europe Cytomegalovirus Treatment Market Value (US$ Mn) Analysis, 2013–2021
Figure 100: Eastern Europe Cytomegalovirus Treatment Market Value (US$ Mn) & Y-o-Y Growth (%), 2022–2028
Figure 101: Russia Cytomegalovirus Treatment Market Value (US$ Mn) Analysis, 2013–2021
Figure 102 : Russia Cytomegalovirus Treatment Market Value (US$ Mn) & Y-o-Y Growth (%), 2022–2028
Figure 103 : Poland Cytomegalovirus Treatment Market Value (US$ Mn) Analysis, 2013–2021
Figure 104 : Poland Cytomegalovirus Treatment Market Value (US$ Mn) & Y-o-Y Growth (%), 2022–2028
Figure 105 : Rest of Eastern Europe Cytomegalovirus Treatment Market Value (US$ Mn) Analysis, 2013–2021
Figure 106: Rest of Eastern Europe Cytomegalovirus Treatment Market Value (US$ Mn) & Y-o-Y Growth (%), 2022–2028
Figure 107 : Eastern Europe Cytomegalovirus Treatment Market Value (US$ Mn) Analysis, 2013–2021, By Ganciclovir
Figure 108 : Eastern Europe Cytomegalovirus Treatment Market Value (US$ Mn) & Y-o-Y Growth (%), 2022–2028, By Ganciclovir
Figure 109 : Eastern Europe Cytomegalovirus Treatment Market Value (US$ Mn) Analysis, 2013–2021, By Valganciclovir
Figure 110 : Eastern Europe Cytomegalovirus Treatment Market Value (US$ Mn) & Y-o-Y Growth (%), 2022–2028, By Valganciclovir
Figure 111 : Eastern Europe Cytomegalovirus Treatment Market Value (US$ Mn) Analysis, 2013–2021, By Foscarnet
Figure 112 : Eastern Europe Cytomegalovirus Treatment Market Value (US$ Mn) & Y-o-Y Growth (%), 2022–2028, By Foscarnet
Figure 113 : Eastern Europe Cytomegalovirus Treatment Market Value (US$ Mn) Analysis, 2013–2021, By Cidofovir
Figure 114 : Eastern Europe Cytomegalovirus Treatment Market Value (US$ Mn) & Y-o-Y Growth (%), 2022–2028, By Cidofovir
Figure 115 : Eastern Europe Cytomegalovirus Treatment Market Value (US$ Mn) Analysis, 2013–2021, By Others
Figure 116 : Eastern Europe Cytomegalovirus Treatment Market Value (US$ Mn) & Y-o-Y Growth (%), 2022–2028, By Others
Figure 117: Eastern Europe Cytomegalovirus Treatment Market Attractiveness Analysis, By Drug Type
Figure 118: Eastern Europe Cytomegalovirus Treatment Market Attractiveness Analysis, By Application
Figure 119: Eastern Europe Cytomegalovirus Treatment Market Attractiveness Analysis, By Distribution Channel
Figure 120: Eastern Europe Cytomegalovirus Treatment Market Attractiveness Analysis, By Country
Figure 121: APEC Cytomegalovirus Treatment Market Value Share, By Drug Type (2022)
Figure 122: APEC Cytomegalovirus Treatment Market Value Share, By Application (2022)
Figure 123: APEC Cytomegalovirus treatment market value analysis US$
Figure 124: APEC Cytomegalovirus Treatment Market Value Share, By Distribution Channel (2022)
Figure 125: APEC Cytomegalovirus Treatment Market Value Share, By Country (2022)
Figure 126: APEC Cytomegalovirus Treatment Market Value (US$ Mn) Analysis, 2013–2021
Figure 127 : APEC Cytomegalovirus Treatment Market Value (US$ Mn) & Y-o-Y Growth (%), 2022–2028
Figure 128: India Cytomegalovirus Treatment Market Value (US$ Mn) Analysis, 2013–2021
Figure 129: India Cytomegalovirus Treatment Market Value (US$ Mn) & Y-o-Y Growth (%), 2022–2028
Figure 130 : Australia & NZ Cytomegalovirus Treatment Market Value (US$ Mn) Analysis, 2013–2021
Figure 131 : Australia & NZ Cytomegalovirus Treatment Market Value (US$ Mn) & Y-o-Y Growth (%), 2022–2028
Figure 132: Japan Cytomegalovirus Treatment Market Value (US$ Mn) Analysis, 2013–2021
Figure 133 : Japan Cytomegalovirus Treatment Market Value (US$ Mn) & Y-o-Y Growth (%), 2022–2028
Figure 134 : Rest of APEC Cytomegalovirus Treatment Market Value (US$ Mn) Analysis, 2013–2021
Figure 135 : Rest of APEC Cytomegalovirus Treatment Market Value (US$ Mn) & Y-o-Y Growth (%), 2022–2028
Figure 136 : APEC Cytomegalovirus Treatment Market Value (US$ Mn) Analysis, 2013–2021, By Ganciclovir
Figure 137 : APEC Cytomegalovirus Treatment Market Value (US$ Mn) & Y-o-Y Growth (%), 2022–2028, By Ganciclovir
Figure 138 : APEC Cytomegalovirus Treatment Market Value (US$ Mn) Analysis, 2013–2021, By Valganciclovir
Figure 139 : APEC Cytomegalovirus Treatment Market Value (US$ Mn) & Y-o-Y Growth (%), 2022–2028, By Valganciclovir
Figure 140 : APEC Cytomegalovirus Treatment Market Value (US$ Mn) Analysis, 2013–2021, By Foscarnet
Figure 141 : APEC Cytomegalovirus Treatment Market Value (US$ Mn) & Y-o-Y Growth (%), 2022–2028, By Foscarnet
Figure 142 : APEC Cytomegalovirus Treatment Market Value (US$ Mn) Analysis, 2013–2021, By Cidofovir
Figure 143 : APEC Cytomegalovirus Treatment Market Value (US$ Mn) & Y-o-Y Growth (%), 2022–2028, By Cidofovir
Figure 144 : APEC Cytomegalovirus Treatment Market Value (US$ Mn) Analysis, 2013–2021, By Others
Figure 145 : APEC Cytomegalovirus Treatment Market Value (US$ Mn) & Y-o-Y Growth (%), 2022–2028, By Others
Figure 146: APEC Cytomegalovirus Treatment Market Attractiveness Analysis, By Drug Type
Figure 147: APEC Cytomegalovirus Treatment Market Attractiveness Analysis, By Application
Figure 148: APEC Cytomegalovirus Treatment Market Attractiveness Analysis, By Distribution Channel
Figure 149: APEC Cytomegalovirus Treatment Market Attractiveness Analysis, By Country
Figure 150: China Cytomegalovirus Treatment Market Value Share, By Drug Type (2022)
Figure 151: China Cytomegalovirus Treatment Market Value Share, By Application (2022)
Figure 152: China Cytomegalovirus treatment market value analysis US$
Figure 153: China Cytomegalovirus Treatment Market Value Share, By Distribution Channel (2022)
Figure 154: China Cytomegalovirus Treatment Market Value (US$ Mn) Analysis, 2013–2021
Figure 155: China Cytomegalovirus Treatment Market Value (US$ Mn) & Y-o-Y Growth (%), 2022–2028
Figure 156 : China Cytomegalovirus Treatment Market Value (US$ Mn) Analysis, 2013–2021, By Ganciclovir
Figure 157 : China Cytomegalovirus Treatment Market Value (US$ Mn) & Y-o-Y Growth (%), 2022–2028, By Ganciclovir
Figure 158 : China Cytomegalovirus Treatment Market Value (US$ Mn) Analysis, 2013–2021, By Valganciclovir
Figure 159 : China Cytomegalovirus Treatment Market Value (US$ Mn) & Y-o-Y Growth (%), 2022–2028, By Valganciclovir
Figure 160 : China Cytomegalovirus Treatment Market Value (US$ Mn) Analysis, 2013–2021, By Foscarnet
Figure 161 : China Cytomegalovirus Treatment Market Value (US$ Mn) & Y-o-Y Growth (%), 2022–2028, By Foscarnet
Figure 162 : China Cytomegalovirus Treatment Market Value (US$ Mn) Analysis, 2013–2021, By Cidofovir
Figure 163 : China Cytomegalovirus Treatment Market Value (US$ Mn) & Y-o-Y Growth (%), 2022–2028, By Cidofovir
Figure 164 : China Cytomegalovirus Treatment Market Value (US$ Mn) Analysis, 2013–2021, By Others
Figure 165 : China Cytomegalovirus Treatment Market Value (US$ Mn) & Y-o-Y Growth (%), 2022–2028, By Others
Figure 166: China Cytomegalovirus Treatment Market Attractiveness Analysis, By Distribution Channel
Figure 167: China Cytomegalovirus Treatment Market Attractiveness Analysis, By Application
Figure 168: China Cytomegalovirus Treatment Market Attractiveness Analysis, By Drug Type
Figure 169: MEA Cytomegalovirus Treatment Market Value Share, By Drug Type (2022)
Figure 170: MEA Cytomegalovirus Treatment Market Value Share, By Application (2022)
Figure 171: MEA Cytomegalovirus treatment market value analysis US$
Figure 172: MEA Cytomegalovirus Treatment Market Value Share, By Distribution Channel (2022)
Figure 173: MEA Cytomegalovirus Treatment Market Value Share, By Country (2022)
Figure 174: MEA Cytomegalovirus Treatment Market Value (US$ Mn) Analysis, 2013–2021
Figure 175 : MEA Cytomegalovirus Treatment Market Value (US$ Mn) & Y-o-Y Growth (%), 2022–2028
Figure 176: South Africa Cytomegalovirus Treatment Market Value (US$ Mn) Analysis, 2013–2021
Figure 177 : South Africa Cytomegalovirus Treatment Market Value (US$ Mn) & Y-o-Y Growth (%), 2022–2028
Figure 178 : GCC Countries Cytomegalovirus Treatment Market Value (US$ Mn) Analysis, 2013–2021
Figure 179 : GCC Countries Cytomegalovirus Treatment Market Value (US$ Mn) & Y-o-Y Growth (%), 2022–2028
Figure 180 : Rest of MEA Cytomegalovirus Treatment Market Value (US$ Mn) Analysis, 2013–2021
Figure 181: Rest of MEA Cytomegalovirus Treatment Market Value (US$ Mn) & Y-o-Y Growth (%), 2022–2028
Figure 182 : MEA Cytomegalovirus Treatment Market Value (US$ Mn) Analysis, 2013–2021, By Ganciclovir
Figure 183 : MEA Cytomegalovirus Treatment Market Value (US$ Mn) & Y-o-Y Growth (%), 2022–2028, By Ganciclovir
Figure 184 : MEA Cytomegalovirus Treatment Market Value (US$ Mn) Analysis, 2013–2021, By Valganciclovir
Figure 185 : MEA Cytomegalovirus Treatment Market Value (US$ Mn) & Y-o-Y Growth (%), 2022–2028, By Valganciclovir
Figure 186 : MEA Cytomegalovirus Treatment Market Value (US$ Mn) Analysis, 2013–2021, By Foscarnet
Figure 187 : MEA Cytomegalovirus Treatment Market Value (US$ Mn) & Y-o-Y Growth (%), 2022–2028, By Foscarnet
Figure 188 : MEA Cytomegalovirus Treatment Market Value (US$ Mn) Analysis, 2013–2021, By Cidofovir
Figure 189 : MEA Cytomegalovirus Treatment Market Value (US$ Mn) & Y-o-Y Growth (%), 2022–2028, By Cidofovir
Figure 190 : MEA Cytomegalovirus Treatment Market Value (US$ Mn) Analysis, 2013–2021, By Others
Figure 191 : MEA Cytomegalovirus Treatment Market Value (US$ Mn) & Y-o-Y Growth (%), 2022–2028, By Others
Figure 192: MEA Cytomegalovirus Treatment Market Attractiveness Analysis, By Drug Type
Figure 193: MEA Cytomegalovirus Treatment Market Attractiveness Analysis, By Application
Figure 194: MEA Cytomegalovirus Treatment Market Attractiveness Analysis, By Distribution Channel
Figure 195: MEA Cytomegalovirus Treatment Market Attractiveness Analysis, By Country
Figure 196: Global Cytomegalovirus Treatment Market Share Analysis (%), By Region, 2022 & 2028
Figure 197: Global Cytomegalovirus Treatment Market Y-o-Y Analysis (%), By Region, 2022-2028
Figure 198: Global Cytomegalovirus Treatment Market Attractiveness Analysis by Region, 2022-2028
Figure 199: Global Cytomegalovirus Treatment Market Share Analysis (%), By Drug Type, 2022 & 2028
Figure 200: Global Cytomegalovirus Treatment Market Y-o-Y Analysis (%), By Drug Type, 2022-2028
Figure 201: MEA Cytomegalovirus Treatment Market Value (US$ Mn) Analysis, 2013–2021, By Ganciclovir
Figure 202: MEA Cytomegalovirus Treatment Market Value (US$ Mn) & Y-o-Y Growth (%), 2022–2028, By Ganciclovir
Figure 203: MEA Cytomegalovirus Treatment Market Value (US$ Mn) Analysis, 2013–2021, By Valganciclovir
Figure 204: MEA Cytomegalovirus Treatment Market Value (US$ Mn) & Y-o-Y Growth (%), 2022–2028, By Valganciclovir
Figure 205: MEA Cytomegalovirus Treatment Market Value (US$ Mn) Analysis, 2013–2021, By Foscarnet
Figure 206: MEA Cytomegalovirus Treatment Market Value (US$ Mn) & Y-o-Y Growth (%), 2022–2028, By Foscarnet
Figure 207: MEA Cytomegalovirus Treatment Market Value (US$ Mn) Analysis, 2013–2021, By Cidofovir
Figure 208: MEA Cytomegalovirus Treatment Market Value (US$ Mn) & Y-o-Y Growth (%), 2022–2028, By Cidofovir
Figure 209: MEA Cytomegalovirus Treatment Market Value (US$ Mn) Analysis, 2013–2021, By Others
Figure 210: MEA Cytomegalovirus Treatment Market Value (US$ Mn) & Y-o-Y Growth (%), 2022–2028, By Others
Figure 211: Global Cytomegalovirus Treatment Market Attractiveness Analysis by Drug Type, 2022-2028
Figure 212: Global Cytomegalovirus Treatment Market Share Analysis (%), By Application, 2022 & 2028
Figure 213: Global Cytomegalovirus Treatment Market Y-o-Y Analysis (%), By Application, 2022-2028
Figure 214: Global Cytomegalovirus Treatment Market Attractiveness Analysis by Application, 2022-2028
Figure 215: Global Cytomegalovirus Treatment Market Share Analysis (%), By Distribution Channel, 2022 & 2028
Figure 216: Global Cytomegalovirus Treatment Market Y-o-Y Analysis (%), By Distribution Channel, 2022-2028
Figure 217: Global Cytomegalovirus Treatment Market Attractiveness Analysis by Distribution Channel, 2022-2028
Figure 218: Global Cytomegalovirus Treatment Market Size (US$ Mn) Analysis, 2013-2021
Figure 219: Global Cytomegalovirus Treatment Market Size (US$ Mn) Opportunity Assessment & Y-o-Y Growth (%), 2022-2028
Figure 220: Global Cytomegalovirus Treatment Market Absolute $ Opportunity, 2022–2028
Demand for cytomegalovirus treatment is predicted to increase at a CAGR of 6.1% from 2022 to 2028.
The global cytomegalovirus treatment market stands at a net worth USD 228.8 million in 2022.
By 2028, the global cytomegalovirus treatment market is anticipated to attain a valuation of USD 326 million.
Prime market players such as Chimerix Inc., Thermo Fisher Scientific, Abbot, Becton Dickinson and Company, Pfizer Inc., Merck & Company Inc., Mylan N.V., Johnson & Johnson, and Bio-Rad Laboratories Inc. have been profiled in this market survey.
At present, hospital pharmacies account for a dominant share of 46.8% in the global cytomegalovirus treatment industry.
Explore Similar Insights
Thank you!
You will receive an email from our Business Development Manager. Please be sure to check your SPAM/JUNK folder too.