Delinting Machine Market Size and Share Forecast Outlook (2024 to 2034)

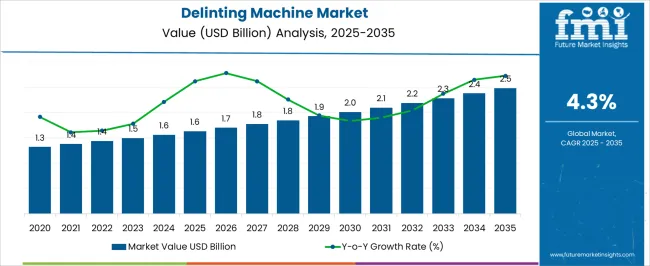
The global delinting machine market size reached USD 1,499.6 million in 2023. Over the forecast period, global delinting machine demand is anticipated to rise at 4.3% CAGR. The market value is predicted to increase from USD 1,562.6 million in 2024 to USD 2,380.6 million in 2034.

Attributes Key Insights
Delinting Machine Market Revenue in 2023 USD 1,499.6 million
Global Delinting Machine Market Size (2024) USD 1,562.6 million
Delinting Machine Market Value (2034) USD 2,380.6 million
Value-based CAGR (2024 to 2034) 4.3%

Key Highlights and Strategic Developments in the Delinting Machine Market

Market to Rise Over 1.5x through 2034

The global delinting machinery market is predicted to rise over 1.5x through 2034, amid a 0.8% increase in expected CAGR compared to the historical one. This is due to the increasing demand for efficient, reliable, and economical devices in agricultural sector.

The market is further projected to grow due to technological innovations, agricultural expansion, resurgence of the textile industry, and focus on sustainable practices. By 2034, the total market revenue is set to reach USD 2,380.6 million.

South Asia and Pacific to Remain a Promising Market

As per the latest analysis, South Asia & Pacific are expected to dominate the global delinting machine market during the forecast period. It is set to hold around 26% of the worldwide market share in 2024.

South Asia & Pacific region comprises countries like India, Australia, and New Zealand, which have significant agricultural sectors. Increasing demand for cotton and other crops that need a delinting process pushes the country's need for delinting machines.

Several countries in South Asia & Pacific are undergoing agricultural modernization. They are adopting advanced technologies and machinery to improve productivity and efficiency. Delinting machines play an important role in optimizing the process for delinting of seeds.

Government support and initiatives for promoting agricultural mechanization and enhancing crop yields contribute to growth of the delinting machine market in the region. Subsidies with favorable policies encourage farmers to invest in advanced machinery like delinting machines.

Cotton is a key crop in South Asia & Pacific. Increasing demand for cotton and related applications enhances cotton production and is expected to push the adoption of delinting machines to process cotton seeds efficiently.

Comparison of Historical Growth (2019 to 2023) vs Forecast Outlook (2024 to 2034)

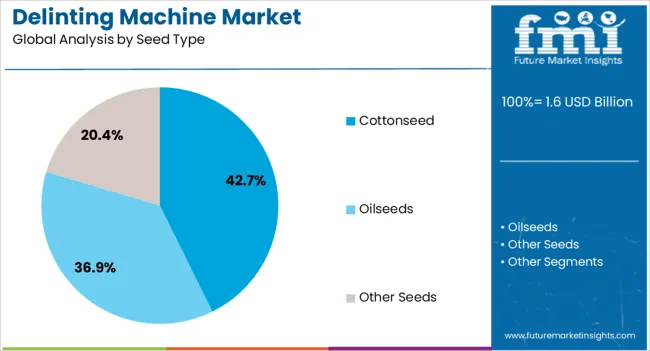
Growing demand for cottonseed oil, a key component in cooking, cosmetics, and biofuels, is propelling the need for efficient cutting consumption machinery such as delinting machines. Cottonseed oil is a promising renewable energy source and increasing emphasis on agri-food safety necessitates delinting machinery for processing several crops, including cottonseed.

Integration of sensors and real-time monitoring systems ensures maximum machine efficiency and minimal yield waste, further highlighting the machine's importance. Significant growth is expected across Asia Pacific due to growing textile industry in countries such as China, India, and Bangladesh.

In North America, growth of the cottonseed oil industry and government initiatives promoting domestic agriculture & food processing are set to boost the market. There has been an increasing emphasis on sustainable practices, which further boosts demand for delinting machines to optimize cottonseed processing and reduce waste.

Market Dynamics Driving the Delinting Machine Industry

Global sales of delinting machines grew at a CAGR of 3.5% between 2019 and 2023. The market revenue reached USD 1,499.6 million in 2023. In the forecast period, the worldwide delinting machine industry is set to thrive at a CAGR of 4.3%.

Historical CAGR (2019 to 2023) 3.5%
Forecast CAGR (2024 to 2034) 4.3%

The global delinting machine market witnessed moderate growth between 2019 and 2023. The worldwide cotton output was boosted by development of unique delinting machines, which maximize and raise the efficiency of processing huge quantities of cotton seeds.

The pandemic underscored the importance of a robust and efficient supply chain network for the textile sector. This further led to significant investments in delinting machines for the cotton processing pipeline.

Over the forecast period, the global delinting machine market is anticipated to reach USD 2,380.6 million by 2034. This growth is augmented by increased government focus on agriculture and food processing to ensure food security. Innovations in delinting machine technology that offer automation and improved production efficiency would also aid demand.

The delinting machine market holds immense promise for the future of agriculture and food production sector. Delinting machines are set to substantially contribute to cottonseed processing by providing effective and eco-friendly solutions.

Innovative delinting technology has the potential to minimize seed damage and optimize cottonseed processing, ultimately leading to reduced waste and enhanced resource utilization. Cottonseed oil is a valuable food source for several regions, and its efficient processing is set to pave the way for a more dependable and sustainable supply.

Challenges Hindering the Expansion of the Delinting Machine Market

Interconnection between Delinting Machines and the Textile Industry

Increasing demand for delinting machines is directly linked to the textile industry, as cotton is the primary raw material. As the textile sector experiences a boost worldwide, especially with growing economies, demand for delinting machines is surging.

The textile industry's expansion creates a ripple effect, intensifying the demand for delinting machines by playing an important role in preparing cotton for further processing. This surging demand boosts the need for standardization of operations to meet the required demand from the textile market. Manufacturers seek advanced and robust solutions like delinting machines to increase production capacity and maintain competitiveness in the evolving textile landscape.

Increasing cotton production due to favorable agriculture conditions and government incentives are set to accelerate the dependency on delinting machines. These machines ensure the removal of lint and impurities from cotton fibers, increasing production and maintaining quality. This interdependence between the delinting machine and the textile sector highlights the important role played by delinting machine in increasing demand for cotton-based textiles.

High Demand for Delinting Machines Amid Increased Cotton Production

The textile industry relies on cotton, the most important raw material, emphasizing the need for improved delinting techniques for the cotton process to increase production. Introduction of genetically modified cotton, advanced agricultural practices, and favorable weather conditions are increasing cotton yield, leading to a surge in demand for delinting machines.

As technological innovations continue to rise across the delinting machinery sector, manufacturers are developing more advanced solutions that fulfill the required demand and are following sustainability standards & regulatory requirements.

Innovations in Delinting Machine Technology Fueling Growth

Continued improvement of delinting machines, with automation and increased efficiency, catalyzes market expansion. Companies are investing heavily in research & development to create innovative delinting machines that promise high production speed, reduced energy consumption, and superior output quality.

Integrating automation into delinting machinery makes processes easy & productive and minimizes human intervention. Precision engineering techniques make the function of delinting machines optimized and consistent in delinting operations.

Innovations in delinting machine technology address existing challenges and unlock new possibilities in the delinting industry. This empowers manufacturers to meet evolving demands for higher productivity, cost-effectiveness, and superior product quality. As innovation continues to push the sector, the trajectory of delinting machine technology promises sustained growth and a competitive edge in the market.

Delinting Machinery in Agriculture to Enhance Seed Quality and Germination Rates

In the agricultural domain, delinting machines play an important role in seed processing, especially for cotton seeds, which aim to improve seed quality and boost germination rates. As the agricultural sector grows for the fulfillment of global food requirements, there will always be a surging demand for delinting machines. Delinting machines are essential in modern agriculture for maintaining seed quality and enhancing productivity & sustainability.

Analysis of Top Countries Manufacturing and Operating Delinting Machines

Lack of Awareness in Underdeveloped Countries

Acquiring delinting machines entails a substantial upfront financial commitment. Initial costs include procurement and installation of these machine and establishing infrastructure like storage units and transportation systems. These expenses pose formidable barriers, especially for smaller companies or farmers constrained by their capital.

The financial burden of delinting machines is set to be worrisome for enterprises aiming to integrate such technology into their operations. Along with the initial purchase, maintenance, repairs, and operational overhead expenses further increase the challenge for investment. This leads to low adoption of delinting machines by smaller-scale companies or agricultural ventures.

High Maintenance Cost

In addition to the initial capital cost, farmers and stakeholders must go through the operating costs associated with delinting equipment. Investing in delinting equipment requires a comprehensive analysis beyond the subsequent investment. It involves an analysis of the entire economic situation, weighing not only the initial capital outlay but also the long-term effects of operating costs.

Maintenance requirements necessary for the product to operate smoothly require regular distribution of resources. Energy consumption, a perennial need, adds to the financial burden while purchasing raw materials is an important factor affecting cost and efficiency.

Navigating these costs requires foresight and strategic planning, especially for stakeholders aiming for sustainable growth and profitability. While delinting machinery is undeniably appealing, prudent consideration of all operating expenses is necessary to ensure informed decision-making and lasting success in the business.

Delinting Machine Industry Analysis by Top Investment Segments

The table shows the estimated growth rates of the top five countries. India, China, and United States are set to record high CAGRs of 4.9%, 3.8%, and 2.2%, respectively, through 2034.

Countries Value CAGR (2024 to 2034)
India 4.9%
China 3.8%
United States 2.2%
Brazil 3.4%
Australia 2.0%
Turkiye 1.8%

Increasing Demand for Cotton and Cotton-based Products to Surge Demand in China

China's delinting machine market is set to rise at 3.8% CAGR through 2034. Increasing demand for cotton and cotton-based products in China's industrial landscape is expected to fuel the market. Prominent players in the textile and agriculture sector continue to use delinting machines to process raw cotton efficiently.

Delinting machines help to enhance efficiency and productivity and reduce labor costs, stimulating market growth in China. Automation, precision engineering, and sustainability features propel adoption among manufacturers seeking to optimize their production processes. This transformation promises to meet the evolving needs of China's industrial sector and help the country position itself at the top of the delinting machine market.

United States to Create Ample Opportunities for Delinting Machine Manufacturers

Over the forecast period, delinting machine demand in the country is set to increase at a robust CAGR of 2.2%. The flourishing United States cottonseed oil industry, a key application for delinting machines, is anticipated to fuel the market. Furthermore, growing focus on domestic agriculture and food processing in the United States will push the need for efficient delinting technology.

Growing Demand from the Textile Industry to Boost Sales in Brazil

Brazil's delinting machine market is expected to grow at a CAGR of 3.4% during the assessment period. Demand for delinting machines in Brazil is propelled by the textile industry's need to increase cotton production.

Delinting machines facilitate efficient lint removal, allowing manufacturers to process large quantities of cotton quickly and remain profitable among their competitors. Furthermore, delinting machines minimize chemical usage and waste generation, promoting sustainable practices in the cotton industry.

Rising Usage in Industrial Processes Pushing Demand in Australia

By 2034, delinting machine demand in Australia is projected to rise at 2.0% CAGR. Booming agriculture sector in Australia necessitates efficient cotton processing machinery. Delinting machines improve cotton seed quality by removing debris and lint, benefiting the textile industry in Australia.

Growth of delinting machines in Australia leads to increased cotton yield per acre, economic benefits for farmers, and a competitive edge in the market. Delinting machine also contributes to resource efficiency and environmental stewardship across Australia.

Competitive Landscape of the Delinting Machine Market

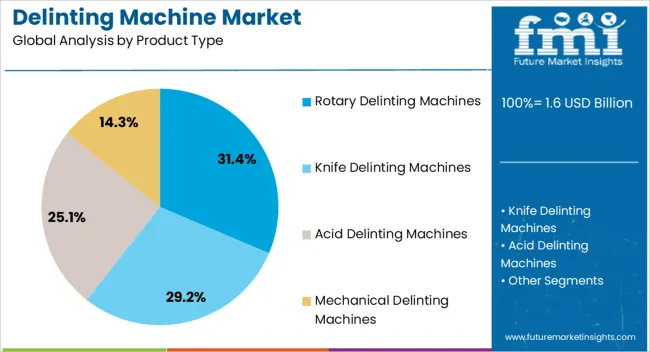
The section below shows rotary delinting machines segment dominating based on product type. It is forecast to thrive at 2.8% CAGR between 2024 and 2034.

Based on end-users, the agricultural sector segment is anticipated to hold a dominant share through 2034. It is set to exhibit a CAGR of 3.0% during the forecast period.

Excellent Delinting Process to Fuel Demand for Rotary Delinting Machines

Top Segment (Product Type) Rotary Delinting Machines
Value CAGR (2024 to 2034) 2.8%

Rotary delinting machines are environmentally friendly, cost-effective, and efficient due to their low chemical usage, automation, and uniform delinting action. They also offer improved delinting processes, including maintenance and downtime, and contribute to growth of the cotton processing industry.

Based on product type, rotary delinting machines are expected to surge at a CAGR of 2.8% by 2034. This dominance stems from their high efficiency and productivity, capable of swiftly processing large volumes of cotton seeds, appealing particularly to commercial-scale delinting operations. Rotary delinting machines are favored by farmers and agricultural companies due to their long-term cost-effectiveness, efficient operation, and low maintenance requirements.

Demand for Delinting Machines to Remain High in Agricultural Sector

Top Segment (End-user) Agricultural Sector
Value CAGR (2024 to 2034) 3.0%

Deliting machines increase efficiency, and help reduce labor costs along with lowering seed wastage and optimizing work. It makes the machine a more attractive investment for the agriculture sector.

Use of delinting machines in the agricultural sector is increasing productivity and profitability for cotton farmers. The automation and streamlined delinting process allows farmers and companies to meet growing demand for cotton and its by-products, enhancing their competitiveness in the market.
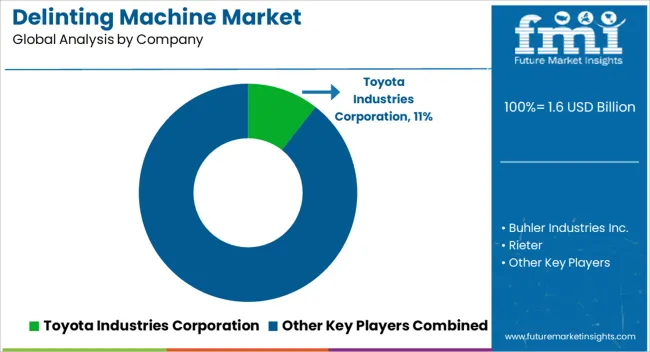
Leading Companies Profiled in the Global Delinting Machine Sector

Bajaj Steel Industries Limited, Continental Eagle Corporation, JSC "Kubanzernoprodukt, Toyota Industries Corporation, Rieter, Lummus Novo, and Buhler Industries Inc. are the leading manufacturers and suppliers of delinting machines listed in the report.

Key delinting machine companies are investing in continuous research for producing new products and increasing their production capacity to meet end-user demand. They are also inclined toward adopting strategies to strengthen their footprint, including acquisitions, partnerships, mergers, and facility expansions.

Leading companies in the market:

  • Bajaj Steel Industries Limited, also known as BSIL, is a global engineering company with advanced manufacturing facilities and a vast operation area in central India.
  • Buhler Industries Inc., an agricultural equipment manufacturer, experienced growth through expansion, acquisitions, and reinvestment. The company continues to innovate with a strong distribution and dealer network in North America.

Scope and Coverage of the Delinting Machine Market Report

  • Bajaj Steel Industries Limited
  • Continental Eagle Corporation
  • JSC "Kubanzernoprodukt"
  • Toyota Industries Corporation
  • Rieter
  • Lummus Novo
  • Buhler Industries Inc.
  • Qingdao New Shun Xiang Machinery Co., Ltd
  • Marzoli Machines Textile S.r.l.
  • Swan Group
  • Shree Nath Fabricators Pvt. Ltd.
  • Kay Jay Chill Rolls Pvt Ltd.
  • M. G. Industries
  • Myande Group Co., Ltd.
  • Hebei Long Run Rubber Products Co., Ltd.
  • Hebei Sanli Grain Sorting Machinery Co., Ltd.
  • Shandong Wenshang Beida Machinery Co., Ltd.
  • Xinxiang Hundred Percent Electrical and Mechanical Co., Ltd.

Overview of Analytical Coverage and Study Boundaries for the Delinting Machine Industry

  • Impact of Cottonseed Delinting Machine
  • Emerging Trends in Cottonseed Processing Equipment
  • Overview of Seed Cotton Delinter Market
  • Analysis of Cotton Delinting Equipment Industry
  • Adjacent Study on Cottonseed Delinting Technology Market, Cotton Delinting Equipment Industry, Cottonseed Lint Cleaner Market, and Cottonseed Processing Equipment Market
  • Delinting Machine Market Share
  • Delinting Machine Market Demand in Australia

Top Segments Studied in the Delinting Machine Market Report

By Product Type:

  • Rotary Delinting Machines
  • Knife Delinting Machines
  • Acid Delinting Machines
  • Mechanical Delinting Machines

By Seed Type:

  • Cottonseed
  • Oilseeds
  • Other Seeds

By Delinting Capacity:

  • Low Capacity
  • Medium Capacity
  • Heavy Capacity

By Delinting Technology:

  • Roller Delinting Machines
  • Saw Delinting Machines
  • Air Jet Delinting Machines

By End-user:

  • Agricultural Sector
  • Seed Processing Industry
  • Research Institutes

By Region:

  • North America
  • Latin America
  • Western Europe
  • Eastern Europe
  • East Asia
  • South Asia and Pacific
  • Middle East and Africa

Table of Content

  • 1. Executive Summary
  • 2. Market Overview
  • 3. Key Market Trends
  • 4. Key Success Factors
  • 5. Global Market Demand Analysis 2019 to 2023 and Forecast, 2024 to 2034
  • 6. Global Market - Pricing Analysis
  • 7. Global Market Demand (in Value or Size in USD million) Analysis 2019 to 2023 and Forecast, 2024 to 2034
  • 8. Market Background
  • 9. Global Market Analysis 2019 to 2023 and Forecast 2024 to 2034, By Product Type
    • 9.1. Rotary Delinting Machines
    • 9.2. Knife Delinting Machines
    • 9.3. Acid Delinting Machines
    • 9.4. Mechanical Delinting Machines
  • 10. Global Market Analysis 2019 to 2023 and Forecast 2024 to 2034, By Seed Type
    • 10.1. Cottonseed
    • 10.2. Oilseeds
    • 10.3. Other Seeds
  • 11. Global Market Analysis 2019 to 2023 and Forecast 2024 to 2034, By Delinting Capacity
    • 11.1. Low Capacity
    • 11.2. Medium Capacity
    • 11.3. Heavy Capacity
  • 12. Global Market Analysis 2019 to 2023 and Forecast 2024 to 2034, By Delinting Technology
    • 12.1. Roller Delinting Machines
    • 12.2. Saw Delinting Machines
    • 12.3. Air Jet Delinting Machines
  • 13. Global Market Analysis 2019 to 2023 and Forecast 2024 to 2034, By End-user
    • 13.1. Agricultural Sector
    • 13.2. Seed Processing Industry
    • 13.3. Research Institutes
  • 14. Global Market Analysis 2019 to 2023 and Forecast 2024 to 2034, By Region
    • 14.1. North America
    • 14.2. Latin America
    • 14.3. East Asia
    • 14.4. South Asia Pacific
    • 14.5. Western Europe
    • 14.6. Eastern Europe
    • 14.7. Middle East and Africa
  • 15. North America Market Analysis 2019 to 2023 and Forecast 2024 to 2034
  • 16. Latin America Market Analysis 2019 to 2023 and Forecast 2024 to 2034
  • 17. East Asia Market Analysis 2019 to 2023 and Forecast 2024 to 2034
  • 18. South Asia Pacific Market Analysis 2019 to 2023 and Forecast 2024 to 2034
  • 19. Western Europe Market Analysis 2019 to 2023 and Forecast 2024 to 2034
  • 20. Eastern Europe Market Analysis 2019 to 2023 and Forecast 2024 to 2034
  • 21. Middle East and Africa Market Analysis 2019 to 2023 and Forecast 2024 to 2034
  • 22. Country-wise Market Analysis
  • 23. Market Structure Analysis
  • 24. Competition Analysis
    • 24.1. Lummus Corporation
    • 24.2. Bajaj Steel Industries Limited
    • 24.3. Continental Eagle Corporation
    • 24.4. JSC "Kubanzernoprodukt"
    • 24.5. Toyota Industries Corporation
    • 24.6. Rieter
    • 24.7. Lummus Novo
    • 24.8. Buhler Industries Inc.
    • 24.9. Qingdao New Shun Xiang Machinery Co., Ltd
    • 24.10. Marzoli Machines Textile S.r.l.
    • 24.11. Swan Group
    • 24.12. Shree Nath Fabricators Pvt. Ltd.
    • 24.13. Kay Jay Chill Rolls Pvt Ltd
    • 24.14. M. G. Industries
    • 24.15. Myande Group Co., Ltd.
    • 24.16. Hebei Long Run Rubber Products Co., Ltd.
    • 24.17. Hebei Sanli Grain Sorting Machinery Co., Ltd.
    • 24.18. Shandong Wenshang Beida Machinery Co., Ltd.
    • 24.19. Xinxiang Hundred Percent Electrical and Mechanical Co., Ltd.
  • 25. Assumptions and Acronyms Used
  • 26. Research Methodology

List of Tables

Table 1: Global Market Value (US$ million) Forecast by Region, 2019 to 2034

Table 2: Global Market Volume (Units) Forecast by Region, 2019 to 2034

Table 3: Global Market Value (US$ million) Forecast by Product Type, 2019 to 2034

Table 4: Global Market Volume (Units) Forecast by Product Type, 2019 to 2034

Table 5: Global Market Value (US$ million) Forecast by Application, 2019 to 2034

Table 6: Global Market Volume (Units) Forecast by Application, 2019 to 2034

Table 7: Global Market Value (US$ million) Forecast by Delinting Capacity, 2019 to 2034

Table 8: Global Market Volume (Units) Forecast by Delinting Capacity, 2019 to 2034

Table 9: Global Market Value (US$ million) Forecast by Delinting Technology, 2019 to 2034

Table 10: Global Market Volume (Units) Forecast by Delinting Technology, 2019 to 2034

Table 11: Global Market Value (US$ million) Forecast by End-user, 2019 to 2034

Table 12: Global Market Volume (Units) Forecast by End-user, 2019 to 2034

Table 13: North America Market Value (US$ million) Forecast by Country, 2019 to 2034

Table 14: North America Market Volume (Units) Forecast by Country, 2019 to 2034

Table 15: North America Market Value (US$ million) Forecast by Product Type, 2019 to 2034

Table 16: North America Market Volume (Units) Forecast by Product Type, 2019 to 2034

Table 17: North America Market Value (US$ million) Forecast by Application, 2019 to 2034

Table 18: North America Market Volume (Units) Forecast by Application, 2019 to 2034

Table 19: North America Market Value (US$ million) Forecast by Delinting Capacity, 2019 to 2034

Table 20: North America Market Volume (Units) Forecast by Delinting Capacity, 2019 to 2034

Table 21: North America Market Value (US$ million) Forecast by Delinting Technology, 2019 to 2034

Table 22: North America Market Volume (Units) Forecast by Delinting Technology, 2019 to 2034

Table 23: North America Market Value (US$ million) Forecast by End-user, 2019 to 2034

Table 24: North America Market Volume (Units) Forecast by End-user, 2019 to 2034

Table 25: Latin America Market Value (US$ million) Forecast by Country, 2019 to 2034

Table 26: Latin America Market Volume (Units) Forecast by Country, 2019 to 2034

Table 27: Latin America Market Value (US$ million) Forecast by Product Type, 2019 to 2034

Table 28: Latin America Market Volume (Units) Forecast by Product Type, 2019 to 2034

Table 29: Latin America Market Value (US$ million) Forecast by Application, 2019 to 2034

Table 30: Latin America Market Volume (Units) Forecast by Application, 2019 to 2034

Table 31: Latin America Market Value (US$ million) Forecast by Delinting Capacity, 2019 to 2034

Table 32: Latin America Market Volume (Units) Forecast by Delinting Capacity, 2019 to 2034

Table 33: Latin America Market Value (US$ million) Forecast by Delinting Technology, 2019 to 2034

Table 34: Latin America Market Volume (Units) Forecast by Delinting Technology, 2019 to 2034

Table 35: Latin America Market Value (US$ million) Forecast by End-user, 2019 to 2034

Table 36: Latin America Market Volume (Units) Forecast by End-user, 2019 to 2034

Table 37: Western Europe Market Value (US$ million) Forecast by Country, 2019 to 2034

Table 38: Western Europe Market Volume (Units) Forecast by Country, 2019 to 2034

Table 39: Western Europe Market Value (US$ million) Forecast by Product Type, 2019 to 2034

Table 40: Western Europe Market Volume (Units) Forecast by Product Type, 2019 to 2034

Table 41: Western Europe Market Value (US$ million) Forecast by Application, 2019 to 2034

Table 42: Western Europe Market Volume (Units) Forecast by Application, 2019 to 2034

Table 43: Western Europe Market Value (US$ million) Forecast by Delinting Capacity, 2019 to 2034

Table 44: Western Europe Market Volume (Units) Forecast by Delinting Capacity, 2019 to 2034

Table 45: Western Europe Market Value (US$ million) Forecast by Delinting Technology, 2019 to 2034

Table 46: Western Europe Market Volume (Units) Forecast by Delinting Technology, 2019 to 2034

Table 47: Western Europe Market Value (US$ million) Forecast by End-user, 2019 to 2034

Table 48: Western Europe Market Volume (Units) Forecast by End-user, 2019 to 2034

Table 49: Eastern Europe Market Value (US$ million) Forecast by Country, 2019 to 2034

Table 50: Eastern Europe Market Volume (Units) Forecast by Country, 2019 to 2034

Table 51: Eastern Europe Market Value (US$ million) Forecast by Product Type, 2019 to 2034

Table 52: Eastern Europe Market Volume (Units) Forecast by Product Type, 2019 to 2034

Table 53: Eastern Europe Market Value (US$ million) Forecast by Application, 2019 to 2034

Table 54: Eastern Europe Market Volume (Units) Forecast by Application, 2019 to 2034

Table 55: Eastern Europe Market Value (US$ million) Forecast by Delinting Capacity, 2019 to 2034

Table 56: Eastern Europe Market Volume (Units) Forecast by Delinting Capacity, 2019 to 2034

Table 57: Eastern Europe Market Value (US$ million) Forecast by Delinting Technology, 2019 to 2034

Table 58: Eastern Europe Market Volume (Units) Forecast by Delinting Technology, 2019 to 2034

Table 59: Eastern Europe Market Value (US$ million) Forecast by End-user, 2019 to 2034

Table 60: Eastern Europe Market Volume (Units) Forecast by End-user, 2019 to 2034

Table 61: East Asia Market Value (US$ million) Forecast by Country, 2019 to 2034

Table 62: East Asia Market Volume (Units) Forecast by Country, 2019 to 2034

Table 63: East Asia Market Value (US$ million) Forecast by Product Type, 2019 to 2034

Table 64: East Asia Market Volume (Units) Forecast by Product Type, 2019 to 2034

Table 65: East Asia Market Value (US$ million) Forecast by Application, 2019 to 2034

Table 66: East Asia Market Volume (Units) Forecast by Application, 2019 to 2034

Table 67: East Asia Market Value (US$ million) Forecast by Delinting Capacity, 2019 to 2034

Table 68: East Asia Market Volume (Units) Forecast by Delinting Capacity, 2019 to 2034

Table 69: East Asia Market Value (US$ million) Forecast by Delinting Technology, 2019 to 2034

Table 70: East Asia Market Volume (Units) Forecast by Delinting Technology, 2019 to 2034

Table 71: East Asia Market Value (US$ million) Forecast by End-user, 2019 to 2034

Table 72: East Asia Market Volume (Units) Forecast by End-user, 2019 to 2034

Table 73: South Asia Pacific Market Value (US$ million) Forecast by Country, 2019 to 2034

Table 74: South Asia Pacific Market Volume (Units) Forecast by Country, 2019 to 2034

Table 75: South Asia Pacific Market Value (US$ million) Forecast by Product Type, 2019 to 2034

Table 76: South Asia Pacific Market Volume (Units) Forecast by Product Type, 2019 to 2034

Table 77: South Asia Pacific Market Value (US$ million) Forecast by Application, 2019 to 2034

Table 78: South Asia Pacific Market Volume (Units) Forecast by Application, 2019 to 2034

Table 79: South Asia Pacific Market Value (US$ million) Forecast by Delinting Capacity, 2019 to 2034

Table 80: South Asia Pacific Market Volume (Units) Forecast by Delinting Capacity, 2019 to 2034

Table 81: South Asia Pacific Market Value (US$ million) Forecast by Delinting Technology, 2019 to 2034

Table 82: South Asia Pacific Market Volume (Units) Forecast by Delinting Technology, 2019 to 2034

Table 83: South Asia Pacific Market Value (US$ million) Forecast by End-user, 2019 to 2034

Table 84: South Asia Pacific Market Volume (Units) Forecast by End-user, 2019 to 2034

Table 85: Middle East and Africa Market Value (US$ million) Forecast by Country, 2019 to 2034

Table 86: Middle East and Africa Market Volume (Units) Forecast by Country, 2019 to 2034

Table 87: Middle East and Africa Market Value (US$ million) Forecast by Product Type, 2019 to 2034

Table 88: Middle East and Africa Market Volume (Units) Forecast by Product Type, 2019 to 2034

Table 89: Middle East and Africa Market Value (US$ million) Forecast by Application, 2019 to 2034

Table 90: Middle East and Africa Market Volume (Units) Forecast by Application, 2019 to 2034

Table 91: Middle East and Africa Market Value (US$ million) Forecast by Delinting Capacity, 2019 to 2034

Table 92: Middle East and Africa Market Volume (Units) Forecast by Delinting Capacity, 2019 to 2034

Table 93: Middle East and Africa Market Value (US$ million) Forecast by Delinting Technology, 2019 to 2034

Table 94: Middle East and Africa Market Volume (Units) Forecast by Delinting Technology, 2019 to 2034

Table 95: Middle East and Africa Market Value (US$ million) Forecast by End-user, 2019 to 2034

Table 96: Middle East and Africa Market Volume (Units) Forecast by End-user, 2019 to 2034

List of Figures

Figure 1: Global Market Value (US$ million) by Product Type, 2024 to 2034

Figure 2: Global Market Value (US$ million) by Application, 2024 to 2034

Figure 3: Global Market Value (US$ million) by Delinting Capacity, 2024 to 2034

Figure 4: Global Market Value (US$ million) by Delinting Technology, 2024 to 2034

Figure 5: Global Market Value (US$ million) by End-user, 2024 to 2034

Figure 6: Global Market Value (US$ million) by Region, 2024 to 2034

Figure 7: Global Market Value (US$ million) Analysis by Region, 2019 to 2034

Figure 8: Global Market Volume (Units) Analysis by Region, 2019 to 2034

Figure 9: Global Market Value Share (%) and BPS Analysis by Region, 2024 to 2034

Figure 10: Global Market Y-o-Y Growth (%) Projections by Region, 2024 to 2034

Figure 11: Global Market Value (US$ million) Analysis by Product Type, 2019 to 2034

Figure 12: Global Market Volume (Units) Analysis by Product Type, 2019 to 2034

Figure 13: Global Market Value Share (%) and BPS Analysis by Product Type, 2024 to 2034

Figure 14: Global Market Y-o-Y Growth (%) Projections by Product Type, 2024 to 2034

Figure 15: Global Market Value (US$ million) Analysis by Application, 2019 to 2034

Figure 16: Global Market Volume (Units) Analysis by Application, 2019 to 2034

Figure 17: Global Market Value Share (%) and BPS Analysis by Application, 2024 to 2034

Figure 18: Global Market Y-o-Y Growth (%) Projections by Application, 2024 to 2034

Figure 19: Global Market Value (US$ million) Analysis by Delinting Capacity, 2019 to 2034

Figure 20: Global Market Volume (Units) Analysis by Delinting Capacity, 2019 to 2034

Figure 21: Global Market Value Share (%) and BPS Analysis by Delinting Capacity, 2024 to 2034

Figure 22: Global Market Y-o-Y Growth (%) Projections by Delinting Capacity, 2024 to 2034

Figure 23: Global Market Value (US$ million) Analysis by Delinting Technology, 2019 to 2034

Figure 24: Global Market Volume (Units) Analysis by Delinting Technology, 2019 to 2034

Figure 25: Global Market Value Share (%) and BPS Analysis by Delinting Technology, 2024 to 2034

Figure 26: Global Market Y-o-Y Growth (%) Projections by Delinting Technology, 2024 to 2034

Figure 27: Global Market Value (US$ million) Analysis by End-user, 2019 to 2034

Figure 28: Global Market Volume (Units) Analysis by End-user, 2019 to 2034

Figure 29: Global Market Value Share (%) and BPS Analysis by End-user, 2024 to 2034

Figure 30: Global Market Y-o-Y Growth (%) Projections by End-user, 2024 to 2034

Figure 31: Global Market Attractiveness by Product Type, 2024 to 2034

Figure 32: Global Market Attractiveness by Application, 2024 to 2034

Figure 33: Global Market Attractiveness by Delinting Capacity, 2024 to 2034

Figure 34: Global Market Attractiveness by Delinting Technology, 2024 to 2034

Figure 35: Global Market Attractiveness by End-user, 2024 to 2034

Figure 36: Global Market Attractiveness by Region, 2024 to 2034

Figure 37: North America Market Value (US$ million) by Product Type, 2024 to 2034

Figure 38: North America Market Value (US$ million) by Application, 2024 to 2034

Figure 39: North America Market Value (US$ million) by Delinting Capacity, 2024 to 2034

Figure 40: North America Market Value (US$ million) by Delinting Technology, 2024 to 2034

Figure 41: North America Market Value (US$ million) by End-user, 2024 to 2034

Figure 42: North America Market Value (US$ million) by Country, 2024 to 2034

Figure 43: North America Market Value (US$ million) Analysis by Country, 2019 to 2034

Figure 44: North America Market Volume (Units) Analysis by Country, 2019 to 2034

Figure 45: North America Market Value Share (%) and BPS Analysis by Country, 2024 to 2034

Figure 46: North America Market Y-o-Y Growth (%) Projections by Country, 2024 to 2034

Figure 47: North America Market Value (US$ million) Analysis by Product Type, 2019 to 2034

Figure 48: North America Market Volume (Units) Analysis by Product Type, 2019 to 2034

Figure 49: North America Market Value Share (%) and BPS Analysis by Product Type, 2024 to 2034

Figure 50: North America Market Y-o-Y Growth (%) Projections by Product Type, 2024 to 2034

Figure 51: North America Market Value (US$ million) Analysis by Application, 2019 to 2034

Figure 52: North America Market Volume (Units) Analysis by Application, 2019 to 2034

Figure 53: North America Market Value Share (%) and BPS Analysis by Application, 2024 to 2034

Figure 54: North America Market Y-o-Y Growth (%) Projections by Application, 2024 to 2034

Figure 55: North America Market Value (US$ million) Analysis by Delinting Capacity, 2019 to 2034

Figure 56: North America Market Volume (Units) Analysis by Delinting Capacity, 2019 to 2034

Figure 57: North America Market Value Share (%) and BPS Analysis by Delinting Capacity, 2024 to 2034

Figure 58: North America Market Y-o-Y Growth (%) Projections by Delinting Capacity, 2024 to 2034

Figure 59: North America Market Value (US$ million) Analysis by Delinting Technology, 2019 to 2034

Figure 60: North America Market Volume (Units) Analysis by Delinting Technology, 2019 to 2034

Figure 61: North America Market Value Share (%) and BPS Analysis by Delinting Technology, 2024 to 2034

Figure 62: North America Market Y-o-Y Growth (%) Projections by Delinting Technology, 2024 to 2034

Figure 63: North America Market Value (US$ million) Analysis by End-user, 2019 to 2034

Figure 64: North America Market Volume (Units) Analysis by End-user, 2019 to 2034

Figure 65: North America Market Value Share (%) and BPS Analysis by End-user, 2024 to 2034

Figure 66: North America Market Y-o-Y Growth (%) Projections by End-user, 2024 to 2034

Figure 67: North America Market Attractiveness by Product Type, 2024 to 2034

Figure 68: North America Market Attractiveness by Application, 2024 to 2034

Figure 69: North America Market Attractiveness by Delinting Capacity, 2024 to 2034

Figure 70: North America Market Attractiveness by Delinting Technology, 2024 to 2034

Figure 71: North America Market Attractiveness by End-user, 2024 to 2034

Figure 72: North America Market Attractiveness by Country, 2024 to 2034

Figure 73: Latin America Market Value (US$ million) by Product Type, 2024 to 2034

Figure 74: Latin America Market Value (US$ million) by Application, 2024 to 2034

Figure 75: Latin America Market Value (US$ million) by Delinting Capacity, 2024 to 2034

Figure 76: Latin America Market Value (US$ million) by Delinting Technology, 2024 to 2034

Figure 77: Latin America Market Value (US$ million) by End-user, 2024 to 2034

Figure 78: Latin America Market Value (US$ million) by Country, 2024 to 2034

Figure 79: Latin America Market Value (US$ million) Analysis by Country, 2019 to 2034

Figure 80: Latin America Market Volume (Units) Analysis by Country, 2019 to 2034

Figure 81: Latin America Market Value Share (%) and BPS Analysis by Country, 2024 to 2034

Figure 82: Latin America Market Y-o-Y Growth (%) Projections by Country, 2024 to 2034

Figure 83: Latin America Market Value (US$ million) Analysis by Product Type, 2019 to 2034

Figure 84: Latin America Market Volume (Units) Analysis by Product Type, 2019 to 2034

Figure 85: Latin America Market Value Share (%) and BPS Analysis by Product Type, 2024 to 2034

Figure 86: Latin America Market Y-o-Y Growth (%) Projections by Product Type, 2024 to 2034

Figure 87: Latin America Market Value (US$ million) Analysis by Application, 2019 to 2034

Figure 88: Latin America Market Volume (Units) Analysis by Application, 2019 to 2034

Figure 89: Latin America Market Value Share (%) and BPS Analysis by Application, 2024 to 2034

Figure 90: Latin America Market Y-o-Y Growth (%) Projections by Application, 2024 to 2034

Figure 91: Latin America Market Value (US$ million) Analysis by Delinting Capacity, 2019 to 2034

Figure 92: Latin America Market Volume (Units) Analysis by Delinting Capacity, 2019 to 2034

Figure 93: Latin America Market Value Share (%) and BPS Analysis by Delinting Capacity, 2024 to 2034

Figure 94: Latin America Market Y-o-Y Growth (%) Projections by Delinting Capacity, 2024 to 2034

Figure 95: Latin America Market Value (US$ million) Analysis by Delinting Technology, 2019 to 2034

Figure 96: Latin America Market Volume (Units) Analysis by Delinting Technology, 2019 to 2034

Figure 97: Latin America Market Value Share (%) and BPS Analysis by Delinting Technology, 2024 to 2034

Figure 98: Latin America Market Y-o-Y Growth (%) Projections by Delinting Technology, 2024 to 2034

Figure 99: Latin America Market Value (US$ million) Analysis by End-user, 2019 to 2034

Figure 100: Latin America Market Volume (Units) Analysis by End-user, 2019 to 2034

Figure 101: Latin America Market Value Share (%) and BPS Analysis by End-user, 2024 to 2034

Figure 102: Latin America Market Y-o-Y Growth (%) Projections by End-user, 2024 to 2034

Figure 103: Latin America Market Attractiveness by Product Type, 2024 to 2034

Figure 104: Latin America Market Attractiveness by Application, 2024 to 2034

Figure 105: Latin America Market Attractiveness by Delinting Capacity, 2024 to 2034

Figure 106: Latin America Market Attractiveness by Delinting Technology, 2024 to 2034

Figure 107: Latin America Market Attractiveness by End-user, 2024 to 2034

Figure 108: Latin America Market Attractiveness by Country, 2024 to 2034

Figure 109: Western Europe Market Value (US$ million) by Product Type, 2024 to 2034

Figure 110: Western Europe Market Value (US$ million) by Application, 2024 to 2034

Figure 111: Western Europe Market Value (US$ million) by Delinting Capacity, 2024 to 2034

Figure 112: Western Europe Market Value (US$ million) by Delinting Technology, 2024 to 2034

Figure 113: Western Europe Market Value (US$ million) by End-user, 2024 to 2034

Figure 114: Western Europe Market Value (US$ million) by Country, 2024 to 2034

Figure 115: Western Europe Market Value (US$ million) Analysis by Country, 2019 to 2034

Figure 116: Western Europe Market Volume (Units) Analysis by Country, 2019 to 2034

Figure 117: Western Europe Market Value Share (%) and BPS Analysis by Country, 2024 to 2034

Figure 118: Western Europe Market Y-o-Y Growth (%) Projections by Country, 2024 to 2034

Figure 119: Western Europe Market Value (US$ million) Analysis by Product Type, 2019 to 2034

Figure 120: Western Europe Market Volume (Units) Analysis by Product Type, 2019 to 2034

Figure 121: Western Europe Market Value Share (%) and BPS Analysis by Product Type, 2024 to 2034

Figure 122: Western Europe Market Y-o-Y Growth (%) Projections by Product Type, 2024 to 2034

Figure 123: Western Europe Market Value (US$ million) Analysis by Application, 2019 to 2034

Figure 124: Western Europe Market Volume (Units) Analysis by Application, 2019 to 2034

Figure 125: Western Europe Market Value Share (%) and BPS Analysis by Application, 2024 to 2034

Figure 126: Western Europe Market Y-o-Y Growth (%) Projections by Application, 2024 to 2034

Figure 127: Western Europe Market Value (US$ million) Analysis by Delinting Capacity, 2019 to 2034

Figure 128: Western Europe Market Volume (Units) Analysis by Delinting Capacity, 2019 to 2034

Figure 129: Western Europe Market Value Share (%) and BPS Analysis by Delinting Capacity, 2024 to 2034

Figure 130: Western Europe Market Y-o-Y Growth (%) Projections by Delinting Capacity, 2024 to 2034

Figure 131: Western Europe Market Value (US$ million) Analysis by Delinting Technology, 2019 to 2034

Figure 132: Western Europe Market Volume (Units) Analysis by Delinting Technology, 2019 to 2034

Figure 133: Western Europe Market Value Share (%) and BPS Analysis by Delinting Technology, 2024 to 2034

Figure 134: Western Europe Market Y-o-Y Growth (%) Projections by Delinting Technology, 2024 to 2034

Figure 135: Western Europe Market Value (US$ million) Analysis by End-user, 2019 to 2034

Figure 136: Western Europe Market Volume (Units) Analysis by End-user, 2019 to 2034

Figure 137: Western Europe Market Value Share (%) and BPS Analysis by End-user, 2024 to 2034

Figure 138: Western Europe Market Y-o-Y Growth (%) Projections by End-user, 2024 to 2034

Figure 139: Western Europe Market Attractiveness by Product Type, 2024 to 2034

Figure 140: Western Europe Market Attractiveness by Application, 2024 to 2034

Figure 141: Western Europe Market Attractiveness by Delinting Capacity, 2024 to 2034

Figure 142: Western Europe Market Attractiveness by Delinting Technology, 2024 to 2034

Figure 143: Western Europe Market Attractiveness by End-user, 2024 to 2034

Figure 144: Western Europe Market Attractiveness by Country, 2024 to 2034

Figure 145: Eastern Europe Market Value (US$ million) by Product Type, 2024 to 2034

Figure 146: Eastern Europe Market Value (US$ million) by Application, 2024 to 2034

Figure 147: Eastern Europe Market Value (US$ million) by Delinting Capacity, 2024 to 2034

Figure 148: Eastern Europe Market Value (US$ million) by Delinting Technology, 2024 to 2034

Figure 149: Eastern Europe Market Value (US$ million) by End-user, 2024 to 2034

Figure 150: Eastern Europe Market Value (US$ million) by Country, 2024 to 2034

Figure 151: Eastern Europe Market Value (US$ million) Analysis by Country, 2019 to 2034

Figure 152: Eastern Europe Market Volume (Units) Analysis by Country, 2019 to 2034

Figure 153: Eastern Europe Market Value Share (%) and BPS Analysis by Country, 2024 to 2034

Figure 154: Eastern Europe Market Y-o-Y Growth (%) Projections by Country, 2024 to 2034

Figure 155: Eastern Europe Market Value (US$ million) Analysis by Product Type, 2019 to 2034

Figure 156: Eastern Europe Market Volume (Units) Analysis by Product Type, 2019 to 2034

Figure 157: Eastern Europe Market Value Share (%) and BPS Analysis by Product Type, 2024 to 2034

Figure 158: Eastern Europe Market Y-o-Y Growth (%) Projections by Product Type, 2024 to 2034

Figure 159: Eastern Europe Market Value (US$ million) Analysis by Application, 2019 to 2034

Figure 160: Eastern Europe Market Volume (Units) Analysis by Application, 2019 to 2034

Figure 161: Eastern Europe Market Value Share (%) and BPS Analysis by Application, 2024 to 2034

Figure 162: Eastern Europe Market Y-o-Y Growth (%) Projections by Application, 2024 to 2034

Figure 163: Eastern Europe Market Value (US$ million) Analysis by Delinting Capacity, 2019 to 2034

Figure 164: Eastern Europe Market Volume (Units) Analysis by Delinting Capacity, 2019 to 2034

Figure 165: Eastern Europe Market Value Share (%) and BPS Analysis by Delinting Capacity, 2024 to 2034

Figure 166: Eastern Europe Market Y-o-Y Growth (%) Projections by Delinting Capacity, 2024 to 2034

Figure 167: Eastern Europe Market Value (US$ million) Analysis by Delinting Technology, 2019 to 2034

Figure 168: Eastern Europe Market Volume (Units) Analysis by Delinting Technology, 2019 to 2034

Figure 169: Eastern Europe Market Value Share (%) and BPS Analysis by Delinting Technology, 2024 to 2034

Figure 170: Eastern Europe Market Y-o-Y Growth (%) Projections by Delinting Technology, 2024 to 2034

Figure 171: Eastern Europe Market Value (US$ million) Analysis by End-user, 2019 to 2034

Figure 172: Eastern Europe Market Volume (Units) Analysis by End-user, 2019 to 2034

Figure 173: Eastern Europe Market Value Share (%) and BPS Analysis by End-user, 2024 to 2034

Figure 174: Eastern Europe Market Y-o-Y Growth (%) Projections by End-user, 2024 to 2034

Figure 175: Eastern Europe Market Attractiveness by Product Type, 2024 to 2034

Figure 176: Eastern Europe Market Attractiveness by Application, 2024 to 2034

Figure 177: Eastern Europe Market Attractiveness by Delinting Capacity, 2024 to 2034

Figure 178: Eastern Europe Market Attractiveness by Delinting Technology, 2024 to 2034

Figure 179: Eastern Europe Market Attractiveness by End-user, 2024 to 2034

Figure 180: Eastern Europe Market Attractiveness by Country, 2024 to 2034

Figure 181: East Asia Market Value (US$ million) by Product Type, 2024 to 2034

Figure 182: East Asia Market Value (US$ million) by Application, 2024 to 2034

Figure 183: East Asia Market Value (US$ million) by Delinting Capacity, 2024 to 2034

Figure 184: East Asia Market Value (US$ million) by Delinting Technology, 2024 to 2034

Figure 185: East Asia Market Value (US$ million) by End-user, 2024 to 2034

Figure 186: East Asia Market Value (US$ million) by Country, 2024 to 2034

Figure 187: East Asia Market Value (US$ million) Analysis by Country, 2019 to 2034

Figure 188: East Asia Market Volume (Units) Analysis by Country, 2019 to 2034

Figure 189: East Asia Market Value Share (%) and BPS Analysis by Country, 2024 to 2034

Figure 190: East Asia Market Y-o-Y Growth (%) Projections by Country, 2024 to 2034

Figure 191: East Asia Market Value (US$ million) Analysis by Product Type, 2019 to 2034

Figure 192: East Asia Market Volume (Units) Analysis by Product Type, 2019 to 2034

Figure 193: East Asia Market Value Share (%) and BPS Analysis by Product Type, 2024 to 2034

Figure 194: East Asia Market Y-o-Y Growth (%) Projections by Product Type, 2024 to 2034

Figure 195: East Asia Market Value (US$ million) Analysis by Application, 2019 to 2034

Figure 196: East Asia Market Volume (Units) Analysis by Application, 2019 to 2034

Figure 197: East Asia Market Value Share (%) and BPS Analysis by Application, 2024 to 2034

Figure 198: East Asia Market Y-o-Y Growth (%) Projections by Application, 2024 to 2034

Figure 199: East Asia Market Value (US$ million) Analysis by Delinting Capacity, 2019 to 2034

Figure 200: East Asia Market Volume (Units) Analysis by Delinting Capacity, 2019 to 2034

Figure 201: East Asia Market Value Share (%) and BPS Analysis by Delinting Capacity, 2024 to 2034

Figure 202: East Asia Market Y-o-Y Growth (%) Projections by Delinting Capacity, 2024 to 2034

Figure 203: East Asia Market Value (US$ million) Analysis by Delinting Technology, 2019 to 2034

Figure 204: East Asia Market Volume (Units) Analysis by Delinting Technology, 2019 to 2034

Figure 205: East Asia Market Value Share (%) and BPS Analysis by Delinting Technology, 2024 to 2034

Figure 206: East Asia Market Y-o-Y Growth (%) Projections by Delinting Technology, 2024 to 2034

Figure 207: East Asia Market Value (US$ million) Analysis by End-user, 2019 to 2034

Figure 208: East Asia Market Volume (Units) Analysis by End-user, 2019 to 2034

Figure 209: East Asia Market Value Share (%) and BPS Analysis by End-user, 2024 to 2034

Figure 210: East Asia Market Y-o-Y Growth (%) Projections by End-user, 2024 to 2034

Figure 211: East Asia Market Attractiveness by Product Type, 2024 to 2034

Figure 212: East Asia Market Attractiveness by Application, 2024 to 2034

Figure 213: East Asia Market Attractiveness by Delinting Capacity, 2024 to 2034

Figure 214: East Asia Market Attractiveness by Delinting Technology, 2024 to 2034

Figure 215: East Asia Market Attractiveness by End-user, 2024 to 2034

Figure 216: East Asia Market Attractiveness by Country, 2024 to 2034

Figure 217: South Asia Pacific Market Value (US$ million) by Product Type, 2024 to 2034

Figure 218: South Asia Pacific Market Value (US$ million) by Application, 2024 to 2034

Figure 219: South Asia Pacific Market Value (US$ million) by Delinting Capacity, 2024 to 2034

Figure 220: South Asia Pacific Market Value (US$ million) by Delinting Technology, 2024 to 2034

Figure 221: South Asia Pacific Market Value (US$ million) by End-user, 2024 to 2034

Figure 222: South Asia Pacific Market Value (US$ million) by Country, 2024 to 2034

Figure 223: South Asia Pacific Market Value (US$ million) Analysis by Country, 2019 to 2034

Figure 224: South Asia Pacific Market Volume (Units) Analysis by Country, 2019 to 2034

Figure 225: South Asia Pacific Market Value Share (%) and BPS Analysis by Country, 2024 to 2034

Figure 226: South Asia Pacific Market Y-o-Y Growth (%) Projections by Country, 2024 to 2034

Figure 227: South Asia Pacific Market Value (US$ million) Analysis by Product Type, 2019 to 2034

Figure 228: South Asia Pacific Market Volume (Units) Analysis by Product Type, 2019 to 2034

Figure 229: South Asia Pacific Market Value Share (%) and BPS Analysis by Product Type, 2024 to 2034

Figure 230: South Asia Pacific Market Y-o-Y Growth (%) Projections by Product Type, 2024 to 2034

Figure 231: South Asia Pacific Market Value (US$ million) Analysis by Application, 2019 to 2034

Figure 232: South Asia Pacific Market Volume (Units) Analysis by Application, 2019 to 2034

Figure 233: South Asia Pacific Market Value Share (%) and BPS Analysis by Application, 2024 to 2034

Figure 234: South Asia Pacific Market Y-o-Y Growth (%) Projections by Application, 2024 to 2034

Figure 235: South Asia Pacific Market Value (US$ million) Analysis by Delinting Capacity, 2019 to 2034

Figure 236: South Asia Pacific Market Volume (Units) Analysis by Delinting Capacity, 2019 to 2034

Figure 237: South Asia Pacific Market Value Share (%) and BPS Analysis by Delinting Capacity, 2024 to 2034

Figure 238: South Asia Pacific Market Y-o-Y Growth (%) Projections by Delinting Capacity, 2024 to 2034

Figure 239: South Asia Pacific Market Value (US$ million) Analysis by Delinting Technology, 2019 to 2034

Figure 240: South Asia Pacific Market Volume (Units) Analysis by Delinting Technology, 2019 to 2034

Figure 241: South Asia Pacific Market Value Share (%) and BPS Analysis by Delinting Technology, 2024 to 2034

Figure 242: South Asia Pacific Market Y-o-Y Growth (%) Projections by Delinting Technology, 2024 to 2034

Figure 243: South Asia Pacific Market Value (US$ million) Analysis by End-user, 2019 to 2034

Figure 244: South Asia Pacific Market Volume (Units) Analysis by End-user, 2019 to 2034

Figure 245: South Asia Pacific Market Value Share (%) and BPS Analysis by End-user, 2024 to 2034

Figure 246: South Asia Pacific Market Y-o-Y Growth (%) Projections by End-user, 2024 to 2034

Figure 247: South Asia Pacific Market Attractiveness by Product Type, 2024 to 2034

Figure 248: South Asia Pacific Market Attractiveness by Application, 2024 to 2034

Figure 249: South Asia Pacific Market Attractiveness by Delinting Capacity, 2024 to 2034

Figure 250: South Asia Pacific Market Attractiveness by Delinting Technology, 2024 to 2034

Figure 251: South Asia Pacific Market Attractiveness by End-user, 2024 to 2034

Figure 252: South Asia Pacific Market Attractiveness by Country, 2024 to 2034

Figure 253: Middle East and Africa Market Value (US$ million) by Product Type, 2024 to 2034

Figure 254: Middle East and Africa Market Value (US$ million) by Application, 2024 to 2034

Figure 255: Middle East and Africa Market Value (US$ million) by Delinting Capacity, 2024 to 2034

Figure 256: Middle East and Africa Market Value (US$ million) by Delinting Technology, 2024 to 2034

Figure 257: Middle East and Africa Market Value (US$ million) by End-user, 2024 to 2034

Figure 258: Middle East and Africa Market Value (US$ million) by Country, 2024 to 2034

Figure 259: Middle East and Africa Market Value (US$ million) Analysis by Country, 2019 to 2034

Figure 260: Middle East and Africa Market Volume (Units) Analysis by Country, 2019 to 2034

Figure 261: Middle East and Africa Market Value Share (%) and BPS Analysis by Country, 2024 to 2034

Figure 262: Middle East and Africa Market Y-o-Y Growth (%) Projections by Country, 2024 to 2034

Figure 263: Middle East and Africa Market Value (US$ million) Analysis by Product Type, 2019 to 2034

Figure 264: Middle East and Africa Market Volume (Units) Analysis by Product Type, 2019 to 2034

Figure 265: Middle East and Africa Market Value Share (%) and BPS Analysis by Product Type, 2024 to 2034

Figure 266: Middle East and Africa Market Y-o-Y Growth (%) Projections by Product Type, 2024 to 2034

Figure 267: Middle East and Africa Market Value (US$ million) Analysis by Application, 2019 to 2034

Figure 268: Middle East and Africa Market Volume (Units) Analysis by Application, 2019 to 2034

Figure 269: Middle East and Africa Market Value Share (%) and BPS Analysis by Application, 2024 to 2034

Figure 270: Middle East and Africa Market Y-o-Y Growth (%) Projections by Application, 2024 to 2034

Figure 271: Middle East and Africa Market Value (US$ million) Analysis by Delinting Capacity, 2019 to 2034

Figure 272: Middle East and Africa Market Volume (Units) Analysis by Delinting Capacity, 2019 to 2034

Figure 273: Middle East and Africa Market Value Share (%) and BPS Analysis by Delinting Capacity, 2024 to 2034

Figure 274: Middle East and Africa Market Y-o-Y Growth (%) Projections by Delinting Capacity, 2024 to 2034

Figure 275: Middle East and Africa Market Value (US$ million) Analysis by Delinting Technology, 2019 to 2034

Figure 276: Middle East and Africa Market Volume (Units) Analysis by Delinting Technology, 2019 to 2034

Figure 277: Middle East and Africa Market Value Share (%) and BPS Analysis by Delinting Technology, 2024 to 2034

Figure 278: Middle East and Africa Market Y-o-Y Growth (%) Projections by Delinting Technology, 2024 to 2034

Figure 279: Middle East and Africa Market Value (US$ million) Analysis by End-user, 2019 to 2034

Figure 280: Middle East and Africa Market Volume (Units) Analysis by End-user, 2019 to 2034

Figure 281: Middle East and Africa Market Value Share (%) and BPS Analysis by End-user, 2024 to 2034

Figure 282: Middle East and Africa Market Y-o-Y Growth (%) Projections by End-user, 2024 to 2034

Figure 283: Middle East and Africa Market Attractiveness by Product Type, 2024 to 2034

Figure 284: Middle East and Africa Market Attractiveness by Application, 2024 to 2034

Figure 285: Middle East and Africa Market Attractiveness by Delinting Capacity, 2024 to 2034

Figure 286: Middle East and Africa Market Attractiveness by Delinting Technology, 2024 to 2034

Figure 287: Middle East and Africa Market Attractiveness by End-user, 2024 to 2034

Figure 288: Middle East and Africa Market Attractiveness by Country, 2024 to 2034

Frequently Asked Questions

What was the value of the global market in 2023?

The global market was valued at USD 1,499.6 million in 2023.

How big is the delinting machine market?

The market value is set to reach USD 1,562.6 million in 2024.

At what rate will the global demand rise through 2034?

Global delinting machine demand is anticipated to rise at 4.3% CAGR.

What is the expected market size in 2034?

The delinting machine market size is set to reach USD 2,380.6 million by 2034.

Which end-use segment is expected to lead the market?

Agricultural sector is expected to lead the market during the forecast period.

Explore Similar Insights

Future Market Insights

Delinting Machine Market