The Europe secondhand goods market is projected to grow from USD 38.4 billion in 2025 to USD 116.6 billion by 2035, registering an 11.7% CAGR. Growth is fueled by inflation-led thrift behavior, digital resale platforms, and regulatory incentives supporting circular trade. Fashion, electronics, and furniture dominate transactions, while certified refurbished tech and luxury resale segments are expanding.
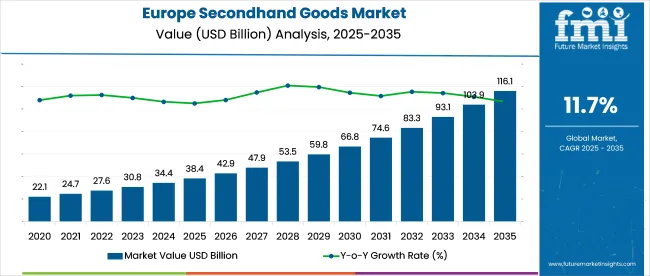
| Attribute | Value |
|---|---|
| Industry Value (2025) | USD 38.4 billion |
| Forecast Value (2035) | USD 116.6 billion |
| Global CAGR (2025 to 2035) | 11.7% |
Retailers are investing in trade-in models, reverse logistics, and resale-dedicated product lines. VAT exemptions and extended producer responsibility frameworks are accelerating industry formalization. Sellers are encouraged to adopt AI-based grading, localized repair infrastructure, and supply loops to secure inventory and enhance throughput across fragmented resale channels.
In December 2024, Amazon launched its "Amazon Used" secondhand marketplace in Belgium, offering customers the opportunity to purchase pre-owned and returned items at discounted prices. Products are categorized by condition, including "New," "Like New," "Very Good," "Good," and "Acceptable."
This initiative is part of Amazon's commitment to sustainable consumption and includes options for repairs, replacements, and recycling to extend product lifecycles. The launch follows successful expansions in other European countries, aligning with Amazon’s goal of promoting environmentally conscious shopping and fostering a more sustainable retail landscape.
The Europe secondhand goods industry is estimated to account for approximately 18% of the recommerce and refurbished products market, driven by strong demand across fashion, electronics, and furniture. Within the broader retail market, its share stands at around 6%, reflecting a gradual shift toward value-driven and circular consumption.
The market contributes 9% to the consumer goods segment as consumer behavior moves toward cost-saving and reuse. In the circular economy market, secondhand goods hold a 12% share, supported by regional waste-reduction targets and sustainability goals.
Lastly, within the e-commerce and online marketplaces, secondhand goods comprise 10%, fueled by peer-to-peer platforms, digital resale apps, and hybrid retail-resale models. These shares continue to rise as secondhand adoption moves into mainstream retail channels.
The industry is experiencing robust growth, driven by key product types such as apparel and fashion, which will dominate the segment with a 40% share. Online marketplaces will lead the sales channel segment, accounting for 60%. These segments benefit from consumer preferences for affordability and convenience, driving industry dynamics across regions such as the UK, Germany, France, and Italy.
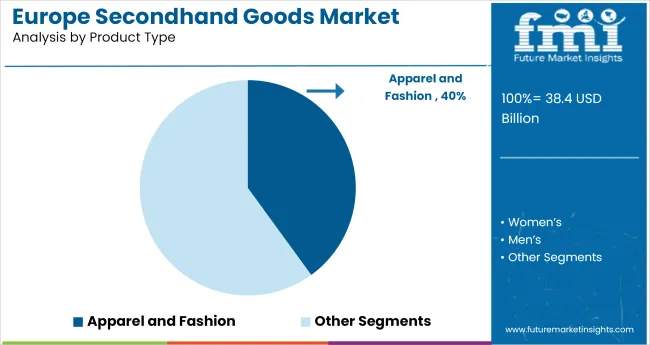
Apparel and fashion are expected to account for 40% in 2025. The segment’s growth is influenced by a shift towards affordable and pre-owned fashion. Platforms such as Vestiaire Collective, ThredUp, and Depop have been pivotal in driving this trend, especially in Western European regions. Increasing demand for vintage and pre-loved items, particularly among younger consumers, has fueled the expansion of this segment, supported by growing recognition of the economic and environmental advantages of secondhand purchasing.
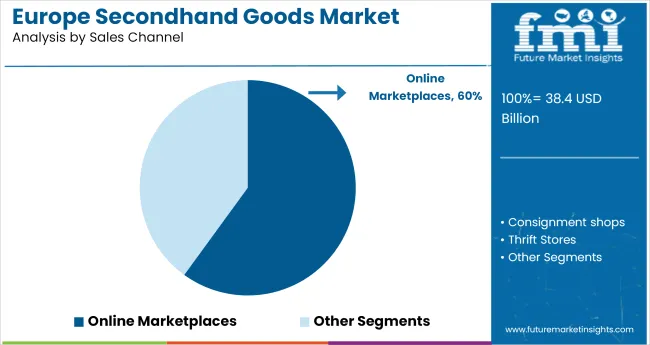
Online marketplaces are expected to account for 60% in 2025. Platforms such as eBay, Vinted, and Facebook Marketplace continue to offer an extensive range of secondhand products. The ease of online shopping, combined with the expansion of mobile apps and digital payment systems, has contributed to the rapid growth of this segment. Northern and Western Europe, where digital adoption is high, have particularly benefited from this shift, making secondhand goods more accessible to a broader consumer base.
The industry is experiencing significant growth, driven by factors such as inventory optimization, expanding digital platforms, and increasing consumer demand for affordable luxury, fashion, and refurbished electronics. These trends are supported by innovations in product handling and cross-border initiatives fostering the circular economy.
Inventory Rationalization & Post-Purchase Handling Efficiency
Retailers and online platforms in Europe have optimized secondhand goods inventory cycles to increase working capital efficiency and reduce unsold stock. Storage time for secondhand goods in major industries, like the UK and Germany, dropped by 18% from 75 to 62 days in Q1 2025, following the adoption of automated sorting systems and improved storage practices.
Online platforms, particularly in France and Spain, have increased product turnover by 1.3x compared to new goods, leading to a 12% expansion in dedicated secondhand sections. Advanced digital tracking has also reduced return rates by 7%, and partnerships with local refurbishers have lowered product defects by 10%.
Secondhand Electronics & Home Goods Market Expansion
Europe secondhand electronics and home goods sector is growing rapidly, with a 9.4% year-on-year increase in transactions for refurbished smartphones and household appliances. Retailers and online platforms like CEX and Back Market have driven this shift, as consumers seek cost-effective alternatives in high-ticket product categories.
Studies from the University of Barcelona (2024) show that refurbished smartphones offer a 13% lower environmental impact than new models, appealing to eco-conscious buyers. Digital certification schemes and in-store refurbishment partnerships have enhanced consumer confidence, with a 15% increase in repeat purchases in the secondhand electronics segment.
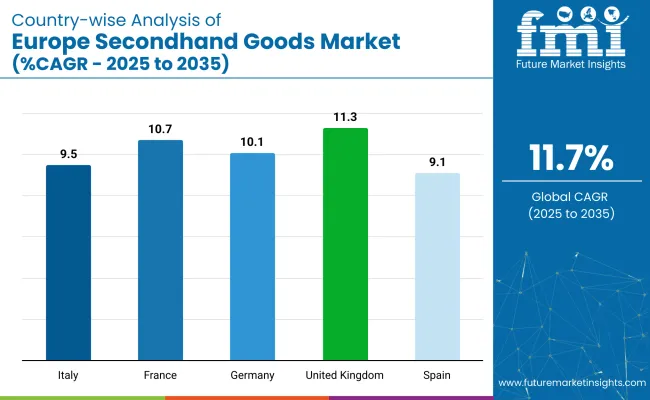
| Country | CAGR (2025 to 2035) |
|---|---|
| United Kingdom | 11.3% |
| France | 10.7% |
| Germany | 10.1% |
| Italy | 9.5% |
| Spain | 9.1% |
The global market is expected to grow at a 11.7% CAGR from 2025 to 2035. The United Kingdom, with a 11.3% CAGR, slightly trails the global average but is still a major player, driven by increasing demand for affordable fashion and luxury items, reflecting trends observed in OECD nations. France, at a 10.7% CAGR, also follows closely behind the global growth rate, benefiting from strong consumer interest in pre-owned fashion and electronics.
Germany, with a 10.1% CAGR, is a key contributor, with its robust resale platforms and growing interest in the circular economy. Italy, at 9.5%, and Spain, with a 9.1% CAGR, show steady growth in their secondhand industries, driven by rising online marketplace adoption and consumer preference for value-driven purchases.
In contrast to BRICS nations, where secondhand growth is more volume-driven, European industries are increasingly influenced by digital platforms and evolving consumer behavior, with a clear focus on quality and convenience.
The United Kingdom market, growing at an 11.3% CAGR, slightly trailing the global rate. The growth is driven by strong demand for pre-owned fashion, electronics, and luxury items. As part of the OECD, the UK benefits from a large consumer base increasingly focused on affordable and high-quality pre-owned goods.
Online resale platforms, particularly Depop and Vinted, continue to lead the industry by providing easy access to secondhand products. The growing inclination towards digital platforms and online shopping is further boosting the industry, especially in metropolitan areas where demand for secondhand goods is highest.
Demand for secondhand goods in France is projected to grow at a 10.7% CAGR through 2035. The country’s demand for secondhand fashion, home goods, and electronics is being driven by affordability and evolving consumer preferences. The industry is heavily influenced by platforms like Vinted and LeBonCoin, which offer consumers a convenient way to buy and sell pre-owned items.
As consumer habits continue to shift towards affordable alternatives, the industry is expected to experience steady growth. France’s growing adoption of online resale platforms reflects broader European trends towards more accessible and cost-effective consumption.
Sales for secondhand goods in Germany are forecasted to expand at a 10.1% CAGR from 2025 to 2035. The demand is driven by a combination of growing interest in pre-owned fashion, electronics, and home goods, with platforms like eBay Kleinanzeigen and Rebuy leading the way.
Germany’s strong infrastructure for resale platforms and high consumer awareness of the benefits of purchasing secondhand items has contributed to the sector’s growth. Additionally, the shift towards more affordable, high-quality goods is helping to further expand the secondhand industry. Germany’s focus on consumer convenience and ease of access fuels this upward trend.
Sales of secondhand goods are projected to expand at a 9.5% CAGR, driven by increasing demand for pre-owned fashion and home goods. The country’s strong cultural affinity for vintage and secondhand items, especially in fashion, is pushing the growth of industry.
Platforms such as Subito and Vestiaire Collective are playing a key role in facilitating the demand. Italy's growing focus on affordability and value-driven purchasing continues to support the shift toward secondhand goods. The demand for high-quality, designer secondhand fashion and the increasing acceptance of pre-owned items across various categories are key factors in industry expansion.
Demand for secondhand goods in Spain is expected to grow at a 9.1% CAGR from 2025 to 2035. The growth is driven by the increasing adoption of online platforms such as Wallapop and Vinted, which make it easier for consumers to buy and sell pre-owned products. Younger consumers are driving the demand for affordable secondhand goods, including fashion, electronics, and home goods.
The country’s expanding digital infrastructure and the growing popularity of online resale platforms are crucial factors behind this growth. As more consumers embrace pre-owned purchases, Spain’s secondhand goods industry is expected to continue expanding at a steady pace.
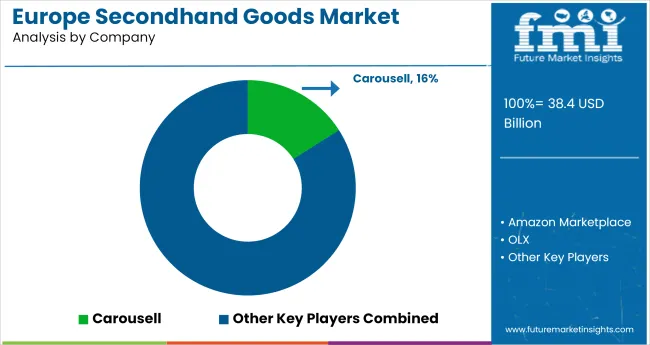
In the secondhand goods industry in Europe, leading companies are driving growth through mobile-first technology, resale optimization, and cross-category expansion. Carousell leads with a 16% share by prioritizing localized listings and targeting fast-moving categories like fashion, electronics, and books. Its platform strategy focuses on user engagement, regional onboarding, and frictionless resale journeys.
OLX Group, Amazon Marketplace, and eBay operate as dominant suppliers, leveraging verified seller networks, integrated logistics, and refurbished product tiers to maintain industry breadth. Cashify, Reebelo, and BookMooch are scaling within niche verticals such as refurbished smartphones and secondhand literature by focusing on assurance, traceability, and targeted audience segments.
Competitive pressure is intensifying as new entrants capitalize on digital resale culture and regulatory openness. Defending share now demands specialization in authentication, returns integration, and device grading standards. Most active firms are pursuing three strategic pillars,enhancing platform reliability and trust, optimizing resale supply chains via micro-fulfillment, and expanding resale categories through strategic brand partnerships.
Recent Industry News
| Report Attributes | Details |
|---|---|
| Industry Size (2025) | USD 38.4 billion |
| Projected Industry Size (2035) | USD 116.6 billion |
| CAGR (2025 to 2035) | 11.7% |
| Base Year for Estimation | 2024 |
| Historical Period | 2020 to 2024 |
| Projections Period | 2025 to 2035 |
| Quantitative Units | USD billion for value and million transactions for volume |
| Product Types Analyzed (Segment 1) | Apparel/Fashion (Women’s, Men’s, Baby/Kids), House, Garden, Do-It-Yourself, Consumer Electronics, Media & Entertainment, Consumer Appliances, Beauty and Health, Toys, Leisure, Sports and Fitness, Pet Supplies |
| Sales Channels Analyzed (Segment 2) | Thrift Stores/Resale Stores, Online Marketplaces, Consignment Shops, Other Channels |
| Countries Covered | United Kingdom, France, Germany, Spain, Italy |
| Key Players | Carousell, Amazon Marketplace, OLX, Tokopedia, Reebelo, Sangeetha Mobiles, Cashify, Hamleys, BookMooch, Qoo10, My Toys, Nykaa, Flipkart, PetSmart, Pet Lovers Centre, Anchanto, Rakuten, SaSa, Kakaku.com, Toy "R" Us, Yahoo! Auctions Japan |
| Additional Attributes | Dollar sales, share by product and sales channel, rapid shift toward online resale models, high resale volume in fashion and consumer electronics, cross-border platform expansion in Europe, emerging youth-led resale demand |
The industry is segmented into apparel/fashion, women’s, men’s, baby/kids, house, garden, do-it-yourself, consumer electronics, media and entertainment, consumer appliances, beauty and health, toys, leisure, sports and fitness, and pet supplies.
The industry is segmented into thrift stores/resale stores, online marketplaces, consignment shops, and other channels.
The industry is segmented into the United Kingdom, France, Germany, Spain, Italy.
The industry is projected to reach USD 38.4 billion in 2025.
The industry is expected to grow at a CAGR of 11.7% from 2025 to 2035.
Apparel and fashion is expected to capture 40% in 2025.
Western Europe, particularly the United Kingdom, is projected to lead with a CAGR of 11.3% from 2025 to 2035.
The industry is projected to reach USD 116.6 billion by 2035.


Our Research Products

The "Full Research Suite" delivers actionable market intel, deep dives on markets or technologies, so clients act faster, cut risk, and unlock growth.

The Leaderboard benchmarks and ranks top vendors, classifying them as Established Leaders, Leading Challengers, or Disruptors & Challengers.

Locates where complements amplify value and substitutes erode it, forecasting net impact by horizon

We deliver granular, decision-grade intel: market sizing, 5-year forecasts, pricing, adoption, usage, revenue, and operational KPIs—plus competitor tracking, regulation, and value chains—across 60 countries broadly.

Spot the shifts before they hit your P&L. We track inflection points, adoption curves, pricing moves, and ecosystem plays to show where demand is heading, why it is changing, and what to do next across high-growth markets and disruptive tech

Real-time reads of user behavior. We track shifting priorities, perceptions of today’s and next-gen services, and provider experience, then pace how fast tech moves from trial to adoption, blending buyer, consumer, and channel inputs with social signals (#WhySwitch, #UX).

Partner with our analyst team to build a custom report designed around your business priorities. From analysing market trends to assessing competitors or crafting bespoke datasets, we tailor insights to your needs.
Supplier Intelligence
Discovery & Profiling
Capacity & Footprint
Performance & Risk
Compliance & Governance
Commercial Readiness
Who Supplies Whom
Scorecards & Shortlists
Playbooks & Docs
Category Intelligence
Definition & Scope
Demand & Use Cases
Cost Drivers
Market Structure
Supply Chain Map
Trade & Policy
Operating Norms
Deliverables
Buyer Intelligence
Account Basics
Spend & Scope
Procurement Model
Vendor Requirements
Terms & Policies
Entry Strategy
Pain Points & Triggers
Outputs
Pricing Analysis
Benchmarks
Trends
Should-Cost
Indexation
Landed Cost
Commercial Terms
Deliverables
Brand Analysis
Positioning & Value Prop
Share & Presence
Customer Evidence
Go-to-Market
Digital & Reputation
Compliance & Trust
KPIs & Gaps
Outputs
Full Research Suite comprises of:
Market outlook & trends analysis
Interviews & case studies
Strategic recommendations
Vendor profiles & capabilities analysis
5-year forecasts
8 regions and 60+ country-level data splits
Market segment data splits
12 months of continuous data updates
DELIVERED AS:
PDF EXCEL ONLINE
Secondhand Apparel Market Analysis - Size, Share, and Forecast 2025 to 2035
Competitive Overview of Secondhand Apparel Market Share
GCC Secondhand Apparel Market Growth, Trends and Forecast from 2025 to 2035
USA & Canada Secondhand Apparel Market Growth, Trends and Forecast from 2025 to 2035
Asia Pacific Secondhand Goods Market Growth, Trends and Forecast from 2025 to 2035
Paper Goods Market Size and Share Forecast Outlook 2025 to 2035
Leather Goods Market Outlook - Size, Share, and Growth 2025 to 2035
Hazardous Goods Packaging Market Analysis – Growth & Forecast 2025 to 2035
Multipurpose Goods Vehicle Market Size and Share Forecast Outlook 2025 to 2035
Frozen Baked Goods Market Size and Share Forecast Outlook 2025 to 2035
Aircraft Soft Goods Market Size and Share Forecast Outlook 2025 to 2035
ASEAN Hard Luxury Goods Market Demand & Forecast 2025 to 2035
Oil Country Tubular Goods Market Size and Share Forecast Outlook 2025 to 2035
North America Sporting Goods Market Analysis by Distribution Channel and by Sports Type Forecast 2025 to 2035
Demand for Multipurpose Goods Vehicle in UK Size and Share Forecast Outlook 2025 to 2035
All Electric Multipurpose Goods Vehicle Market Forecast and Outlook 2025 to 2035
Europe Cruise Market Forecast and Outlook 2025 to 2035
Europe Massage Therapy Service Market Size and Share Forecast Outlook 2025 to 2035
Europe and MENA Generic Oncology Drug Market Size and Share Forecast Outlook 2025 to 2035
Europe Dermal Fillers Market Size and Share Forecast Outlook 2025 to 2035

Thank you!
You will receive an email from our Business Development Manager. Please be sure to check your SPAM/JUNK folder too.
Chat With
MaRIA