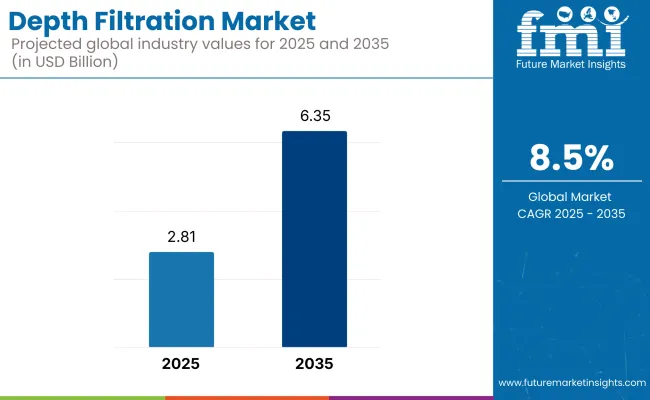
The global depth filtration market is projected to grow from USD 2.81 billion in 2025 to USD 6.35 billion by 2035, registering a CAGR of 8.5% over the forecast period. The pharmaceutical and biopharmaceutical industries are among the leading adopters, especially as the production of biologics, cell therapies, and vaccines expands.
Water treatment, food and beverage processing, and specialty chemical industries also contribute to consistent demand. Regionally, North America and Europe maintain regulatory-driven adoption, but Asia-Pacific is set to lead in volume, backed by rapid industrialization and rising healthcare infrastructure investments.
Depth filtration systems are widely used in scenarios requiring high dirt-holding capacity and consistent flow rates. They are particularly effective in removing particulates from viscous fluids and in batch processing where membrane fouling is a concern. Cartridge filters lead the product segment due to ease of use, modularity, and cost-efficiency.
Looking forward, market dynamics are shifting toward sustainability and automation. New-generation filters incorporating nanofiber technology and biodegradable media are being developed to meet stricter environmental norms, particularly in the EU. Moreover, the integration of IoT-enabled monitoring systems and predictive maintenance features is gaining traction in North America.
While raw material price volatility remains a challenge, manufacturers are increasingly investing in high-capacity, eco-friendly systems and forming partnerships to localize production. As urbanization intensifies and water quality concerns rise globally, depth filtration is positioned as a critical enabler of industrial hygiene, safety, and compliance.
In addition, the competitive landscape of the depth filtration market is evolving as key players focus on strategic mergers, capacity expansions, and regional partnerships to secure supply chains and meet rising demand. Companies are increasingly targeting emerging economies with tailored solutions that offer high throughput and low operational complexity.
For example, modular skid-mounted systems are gaining popularity in Southeast Asia and Latin America for their plug-and-play scalability in small to mid-sized facilities. Furthermore, with the rise of continuous processing in biomanufacturing and zero-liquid-discharge mandates in industrial wastewater treatment, manufacturers are innovating filter formats and configurations to enable higher operational uptime and compliance.
These strategic moves are expected to further strengthen the role of depth filtration in next-generation industrial and life sciences infrastructure.
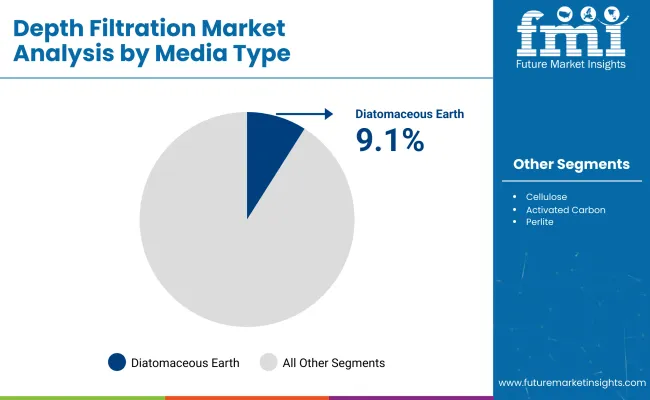
Among filtration media, diatomaceous earth (DE) holds the highest growth potential due to its superior filtration depth, high surface area, and natural microporosity. It enables effective removal of fine particulates and microbes, especially in water treatment and beverage clarification. DE is thermally stable and resistant to acids, making it valuable across diverse industrial applications.
Increasing regulations for potable water purity, particularly in emerging economies, are accelerating its uptake. Moreover, DE’s eco-friendly and biodegradable nature aligns with sustainability goals in Europe and North America. Recent innovations involve blending DE with activated carbon or perlite to boost efficiency and broaden its use in pharmaceutical and food processing sectors.
Continuous advancements in DE processing and granule optimization will further drive its adoption, especially in high-throughput, continuous-flow systems used in municipal and industrial water purification.
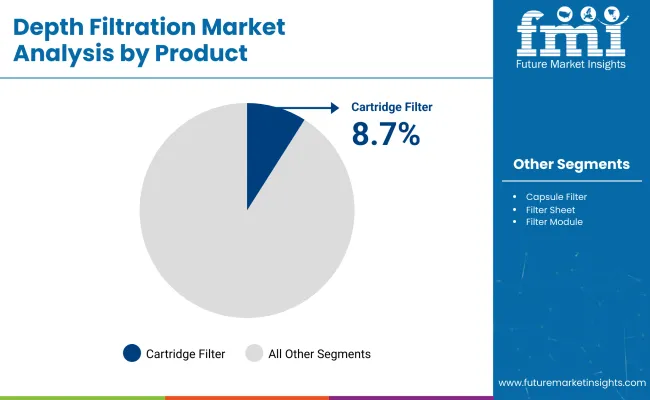
Cartridge filters are expected to maintain dominance across the depth filtration product landscape due to their cost-efficiency, versatility, and ease of integration into existing filtration setups. They are widely deployed in biopharma, chemical processing, water treatment, and F&B industries due to their consistent micron-level control, extended dirt-holding capacity, and modular designs.
Cartridge systems are particularly favored in batch processes and applications involving high viscosity or particulate-laden fluids. Additionally, the ability to tailor micron ratings and combine multiple media layers (e.g., cellulose, glass fiber, polypropylene) within a single housing enhances performance.
Cartridge filters also enable easy replacement and scalability, reducing downtime in mission-critical operations. Their dominance will persist as regulatory standards tighten and manufacturers seek compact, maintenance-friendly, and validated filtration systems.
Final product processing will remain the largest and fastest-growing application segment, fueled by the need for high-purity outputs in pharmaceuticals, biologics, nutraceuticals, and food and beverage manufacturing. This stage demands the removal of sub-micron particulates, pyrogens, endotoxins, and other contaminants before the product reaches consumers.
With biopharma production shifting toward gene therapies and monoclonal antibodies, stringent regulatory oversight (FDA, EMA, WHO GMP) is compelling manufacturers to invest in high-efficiency depth filters. In F&B, final-stage filtration ensures sensory consistency and extended shelf life, particularly in beverages like beer, wine, and juices. Filter validation and traceability are also major focus areas, pushing demand for depth filters that can withstand rigorous CIP (clean-in-place) processes and offer longer service life under variable load conditions.
Surveyed Q4 2024, n=500 stakeholder participants evenly distributed across manufacturers, end-users, and distributors in North America, Europe, Asia-Pacific, and Latin America
Regional Variance
High Variance in Adoption
Convergent and Divergent Perspectives on ROI
Consensus
Synthetic polymer-based filtration media was preferred by 67% of global stakeholders for its high dirt-holding capacity and chemical resistance.
Regional Variance
Shared Challenges
85% of stakeholders cited rising raw material costs (polymer prices up 22%, cellulose up 15%) as a major concern.
Regional Differences
Manufacturers
Distributors
End-Users
Alignment
72% of global manufacturers plan to invest in R&D for advanced filtration technologies, focusing on extended filter lifespan and higher retention efficiency.
Divergence
North America
67% of respondents said increased FDA scrutiny on pharmaceutical filtration processes significantly impacted procurement strategies.
Europe
80% viewed the EU's Circular Economy Plan as a catalyst for demand for sustainable filtration solutions.
Asia-Pacific & Latin America
Only 34% felt that regulations directly impacted purchase decisions, citing lower enforcement standards compared to North America and Europe.
High Consensus
Key Variances
Strategic Insight
| Country/Region | Key Regulations & Certifications Impacting the Industry |
|---|---|
| United States |
|
| Canada |
|
| European Union |
|
| Germany |
|
| France |
|
| United Kingdom |
|
| China |
|
| Japan |
|
| South Korea |
|
| India |
|
| Brazil |
|
| Australia |
|
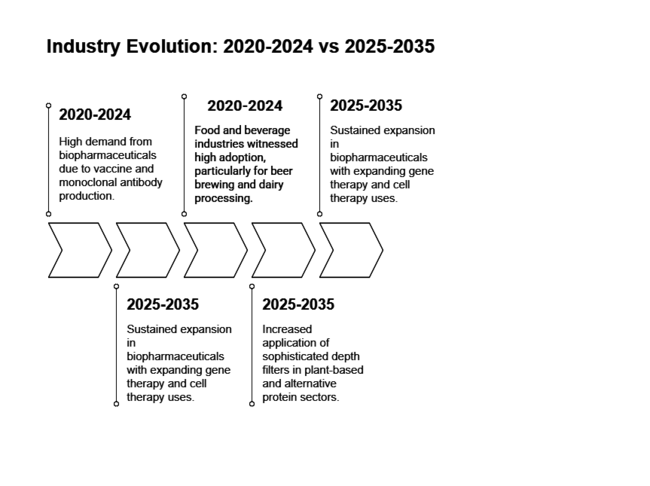
| 2020 to 2024 | 2025 to 2035 |
|---|---|
| High demand from biopharmaceuticals due to vaccine and monoclonal antibody production. | Sustained expansion in biopharmaceuticals with expanding gene therapy and cell therapy uses. |
| The water treatment industry grew due to increased interest in water purity and regulatory enforcement. | Improvements in filtration media to increase efficiency and sustainability of water purification. |
| Food and beverage industries witnessed high adoption, particularly for beer brewing and dairy processing. | Increased application of sophisticated depth filters in plant-based and alternative protein sectors. |
| Advancements were targeted at enhancing filter life and capacity. | Sophisticated filtration systems with IoT integration to maximize efficiency and monitoring. |
| North America and Europe dominated innovation, whereas Asia-Pacific witnessed high industrial uptake. | Asia-Pacific will lead growth because of growing pharmaceutical and manufacturing industries. |
| Mergers and acquisitions among major players heightened industry concentration. | Ongoing strategic partnerships and investments in R&D to design high-performance filtration solutions. |
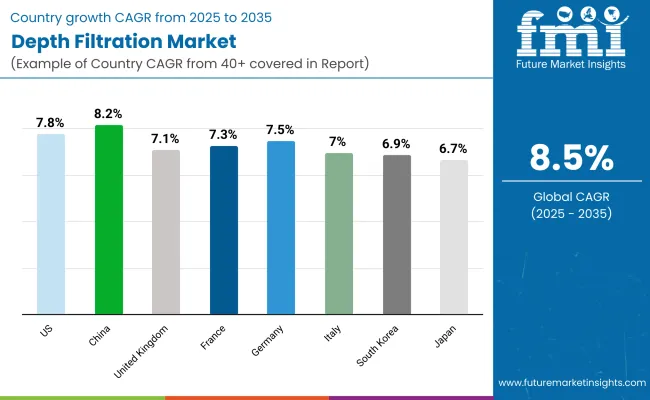
The USA depth filtration market is projected to expand at a CAGR of ~7.8% from 2025 to 2035, fueled by the rapid expansion of quick-service restaurants (QSRs) and the adoption of advanced food warmers integrated with filtration systems. The growing demand for sterile and high-efficiency filters in food processing is driven by stringent FDA food safety regulations, which require QSR chains to maintain strict hygiene and contamination control measures.
The rise of IoT-enabled filtration technologies in smart food warming systems is another key factor shaping industry growth. These advanced systems ensure extended food preservation, quality control, and real-time monitoring, reducing food wastage and operational inefficiencies. Additionally, the Environmental Protection Agency’s (EPA) industrial wastewater treatment regulations are encouraging QSR chains to invest in sustainable filtration solutions, particularly those designed for oil and grease separation.
The increasing shift toward automation in commercial kitchens, including robotic food handling and AI-powered quality assessment systems, is also contributing to the demand for high-performance filtration solutions. As major QSR chains continue to expand their presence and modernize their operations, the need for advanced, cost-effective, and sustainable filtration systems is expected to surge, positioning the United States as a key hub for filtration innovations.
The UK is set to expand at a CAGR of ~7.1% from 2025 to 2035, driven by the rapid growth of QSR outlets and the increasing use of energy-efficient food-warming technologies. The British Standards Institution (BSI) BS 6920 mandates stringent filtration quality controls in food service equipment, ensuring hygiene and compliance.
As post-Brexit regulations evolve, local QSR brands are investing in specialized filtration solutions tailored to meet new safety and hygiene requirements. The growing emphasis on automation in commercial kitchens is further accelerating the adoption of advanced filtration systems, particularly in self-cleaning fryers and smart food warming units. The UK’s sustainability push in the food service sector is fueling demand for eco-friendly and reusable filtration systems.
Many QSR operators are prioritizing biodegradable filter media to reduce their environmental footprint while ensuring compliance with stringent food safety laws. As the adoption of high-tech filtration solutions continues to rise, the industry is expected to see significant expansion, with increasing investments in smart, automated, and sustainable filtration technologies.
France is anticipated to expand at a CAGR of ~7.3% from 2025 to 2035, driven by the rise of premium QSR chains and advanced filtration technologies in food warming systems. ANSES food safety regulations and AFNOR standards (NF T 90-520) require high-efficiency filters in food processing and catering equipment, compelling QSRs to upgrade their filtration infrastructure. The country’s thriving patisserie, bakery, and gourmet fast-food sectors are also increasing the demand for temperature-controlled food warmers with superior filtration systems to maintain hygiene and quality.
Additionally, the shift toward automated food preparation and service, including AI-powered dispensers and robotic kitchens, is boosting the need for smart filtration solutions. France’s growing focus on sustainability is further driving the adoption of eco-friendly and reusable filter media. As QSR operators continue to invest in advanced filtration technologies to comply with strict EU food safety directives, the industry is poised for sustained growth.
Germany is expected to register a CAGR of ~7.5% from 2025 to 2035, supported by the increasing adoption of automated QSRs and high-tech food warming solutions. The country’s DIN standards (DIN 19643, DIN 58356) enforce strict filtration quality requirements in food processing, compelling QSRs and self-service restaurants to adopt advanced filtration systems. The rapid growth of robotic kitchens and contactless food service technologies is further fueling demand for high-efficiency filtration solutions in food warming systems.
Germany’s strong commitment to energy efficiency is also driving the adoption of sustainable filter media. The increasing focus on automated cooking and serving systems in fast-food chains necessitates the use of high-performance filters to maintain air and food quality, prevent contamination, and optimize operational efficiency. As QSR operators continue prioritizing automation and sustainability, the industry is expected to witness steady growth.
Italy is poised to grow at a CAGR of ~7.0% from 2025 to 2035, fueled by the expansion of QSR chains and increasing demand for stringent filtration in food equipment. The Italian National Institute of Health (ISS) mandates strict compliance for food-grade filtration systems, particularly in pizza chains and gelato outlets. The rising emphasis on hygiene and antimicrobial filtration in high-volume QSRs is prompting the adoption of innovative filtration products.
Additionally, Italy’s focus on sustainability is encouraging QSRs to integrate biodegradable filtration media into their operations. The adoption of energy-efficient filtration systems in commercial kitchens is also growing as businesses look to optimize costs while meeting regulatory standards. As the QSR industry continues to expand, investments in high-quality filtration technologies are expected to rise, enhancing food safety and operational efficiency.
South Korea is forecast to grow at a CAGR of ~6.9% from 2025 to 2035, driven by the increasing adoption of technologically advanced QSRs and smart food warming solutions. The Ministry of Food and Drug Safety (MFDS) mandates strict filtration regulations in food handling equipment, compelling QSR chains to invest in self-cleaning and automated filtration systems. With the rise of AI-integrated food warmers in Korean convenience stores and self-service QSRs, the demand for high-performance filtration solutions is surging to ensure food hygiene and extended shelf life.
The sector is also witnessing a shift toward sustainable and energy-efficient filtration systems in response to South Korea’s environmental regulations. The growing presence of robotic kitchens and automated food dispensing units is further driving innovation in filtration technologies. As QSR brands continue to integrate smart, automated filtration into their food service infrastructure, the industry is expected to see significant advancements in high-efficiency and eco-friendly filtration solutions.
Japan is projected to expand at a CAGR of ~6.7% from 2025 to 2035, driven by the increasing number of compact QSRs and the integration of smart filtration technologies in automated food service equipment. The Pharmaceuticals and Medical Devices Agency (PMDA) and JIS B 9920 standards enforce strict compliance in food warmers and filtration units, ensuring safety in high-density urban eateries and vending machines. The demand for filtration-enhanced self-heating food containers is also rising, particularly in Japan's high-tech restaurant ecosystem.
As the country continues to push for innovation in automated dining solutions, QSR operators are increasingly investing in AI-driven filtration systems that optimize food preservation and air quality. Additionally, the push for sustainable food service solutions is driving demand for reusable and biodegradable filtration media. As urbanization and automation reshape Japan’s food service industry, the adoption of advanced filtration solutions is expected to experience steady growth.
China is expected to achieve a CAGR of ~8.2% from 2025 to 2035, driven by the rapid expansion of QSR chains and stringent government-led food safety regulations. The National Medical Products Administration (NMPA) and GB/T 5750 to 2023 standards regulate food-grade filtration systems, ensuring compliance in large-scale restaurant chains. The increasing adoption of robotic food preparation units and IoT-enabled warmers is further fueling demand for advanced filtration technologies.
China’s push for food safety modernization, supported by government policies, is encouraging QSR chains to invest in high-efficiency filtration systems. Additionally, the rise of cloud kitchens and centralized food production hubs is boosting the need for industrial-grade filtration solutions to maintain hygiene and product quality. As automation and food safety regulations continue to evolve, the industry is poised for significant growth.
By media type, the industry is segmented into diatomaceous earth, cellulose, activated carbon, perlite, and others.
In terms of product, the sector is segmented into cartridge filters, capsule filters, filter sheets, filter modules, and others.
By application, the industry is segmented into final product processing, cell clarification, and raw material filtration.
The industry is segmented by region into North America, Latin America, Western Europe, South Asia & Pacific, East Asia, Middle East, and Africa.
Increasing demand in biopharmaceuticals, food and beverage processing, and water treatment is driving adoption. Advancements in filtration technology and stringent regulatory requirements further support expansion.
Biopharmaceuticals, food and beverage, chemicals, water treatment, and industrial manufacturing sectors depend on filtration for efficient contaminant removal and product purification.
High initial investment, filter clogging, and limited reusability pose challenges. However, advancements in filter media and design are improving efficiency and cost-effectiveness.
Filtration captures particles throughout the filter medium, ensuring high dirt-holding capacity. In contrast, membrane filtration retains particles on the surface, making it better suited for fine particle removal.
Companies such as Merck KGaA, Pall Corporation, Sartorius AG, 3M, and Eaton Corporation are recognized for their advanced filtration technologies and extensive product portfolios.


Our Research Products

The "Full Research Suite" delivers actionable market intel, deep dives on markets or technologies, so clients act faster, cut risk, and unlock growth.

The Leaderboard benchmarks and ranks top vendors, classifying them as Established Leaders, Leading Challengers, or Disruptors & Challengers.

Locates where complements amplify value and substitutes erode it, forecasting net impact by horizon

We deliver granular, decision-grade intel: market sizing, 5-year forecasts, pricing, adoption, usage, revenue, and operational KPIs—plus competitor tracking, regulation, and value chains—across 60 countries broadly.

Spot the shifts before they hit your P&L. We track inflection points, adoption curves, pricing moves, and ecosystem plays to show where demand is heading, why it is changing, and what to do next across high-growth markets and disruptive tech

Real-time reads of user behavior. We track shifting priorities, perceptions of today’s and next-gen services, and provider experience, then pace how fast tech moves from trial to adoption, blending buyer, consumer, and channel inputs with social signals (#WhySwitch, #UX).

Partner with our analyst team to build a custom report designed around your business priorities. From analysing market trends to assessing competitors or crafting bespoke datasets, we tailor insights to your needs.
Supplier Intelligence
Discovery & Profiling
Capacity & Footprint
Performance & Risk
Compliance & Governance
Commercial Readiness
Who Supplies Whom
Scorecards & Shortlists
Playbooks & Docs
Category Intelligence
Definition & Scope
Demand & Use Cases
Cost Drivers
Market Structure
Supply Chain Map
Trade & Policy
Operating Norms
Deliverables
Buyer Intelligence
Account Basics
Spend & Scope
Procurement Model
Vendor Requirements
Terms & Policies
Entry Strategy
Pain Points & Triggers
Outputs
Pricing Analysis
Benchmarks
Trends
Should-Cost
Indexation
Landed Cost
Commercial Terms
Deliverables
Brand Analysis
Positioning & Value Prop
Share & Presence
Customer Evidence
Go-to-Market
Digital & Reputation
Compliance & Trust
KPIs & Gaps
Outputs
Full Research Suite comprises of:
Market outlook & trends analysis
Interviews & case studies
Strategic recommendations
Vendor profiles & capabilities analysis
5-year forecasts
8 regions and 60+ country-level data splits
Market segment data splits
12 months of continuous data updates
DELIVERED AS:
PDF EXCEL ONLINE
Depth Sensing Market Trends - Growth & Forecast 2025 to 2035
Deep Depth Subsea Umbilicals, Risers and Flowlines Market Size and Share Forecast Outlook 2025 to 2035
Multi Depth Corrugated Box Market Size and Share Forecast Outlook 2025 to 2035
Shallow Depth SURF Market Size and Share Forecast Outlook 2025 to 2035
Filtration and Separation Equipment Market Size and Share Forecast Outlook 2025 to 2035
Filtration Paper Market Growth and Forecast 2024 to 2034
Ultrafiltration Membranes Market Analysis by Material Type, End-Use, and Region through 2025 to 2035
Dairy Filtration Systems Market Size and Share Forecast Outlook 2025 to 2035
Liquid Filtration Market Size and Share Forecast Outlook 2025 to 2035
Data Exfiltration Market Size and Share Forecast Outlook 2025 to 2035
Coolant Filtration Skids Market Analysis - Size, Share, and Forecast Outlook 2025 to 2035
Portable Filtration System Market Size and Share Forecast Outlook 2025 to 2035
Membrane Filtration Systems Market Size and Share Forecast Outlook 2025 to 2035
Laboratory Filtration Devices Market Size and Share Forecast Outlook 2025 to 2035
Industrial Filtration Market Growth - Trends & Forecast 2025 to 2035
Single-use Filtration Assemblies Market Growth – Trends & Forecast 2025 to 2035
Laboratory Filtration Equipment Market Growth – Trends & Forecast 2019-2027
Normal Flow Filtration Products Market Size and Share Forecast Outlook 2025 to 2035
Membrane Microfiltration Market Size and Share Forecast Outlook 2025 to 2035
Industrial Air Filtration Market Size and Share Forecast Outlook 2025 to 2035

Thank you!
You will receive an email from our Business Development Manager. Please be sure to check your SPAM/JUNK folder too.
Chat With
MaRIA