
- Market Size (2026)
- USD 1.8 Bn
- Forecast (2036)
- USD 2.9 Bn
- CAGR (2026 to 2036)
- 4.9%
How Big Is the Dried Cranberries Market in 2026?
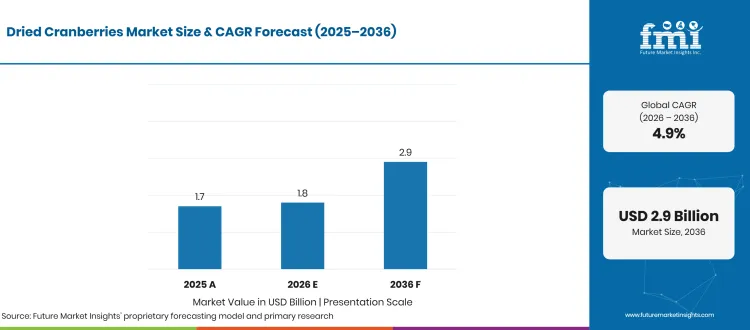
Global dried cranberries market establishes its foundation at USD 1.7 billion in 2025, advances to USD 1.8 billion in 2026, and is forecast by Future Market Insights (FMI) to scale to USD 2.9 billion by 2036 at a CAGR of 4.9%, generating USD 1.1 billion in incremental revenue over the forecast decade.
| Market Metric | Valuation / Share / Forecast Benchmark |
|---|---|
| 2025 Market Size (Historical) | USD 1.7 billion |
| 2026 Market Size (Estimated) | USD 1.8 billion |
| 2036 Market Size (Projected) | USD 2.9 billion |
| Compound Annual Growth Rate (2026 to 2036) | 4.9% CAGR |
| Incremental Dollar Opportunity (2026 to 2036) | USD 1.1 billion |
| Dominant Product Segment (2026 Share) | Sun Dried (42.0% in 2026) | Other Segment Combined (58.0%) | Total (100.0%) |
| Dominant Nature Segment (2026 Share) | Organic (63.0% in 2026) | Other Segment Combined (37.0%) | Total (100.0%) |
| Dominant Distribution Channel (2026 Share) | Supermarkets & Hypermarkets (49.0% in 2026) | Other Segment Combined (51.0%) | Total (100.0%) |
| Largest Country Markets (2026 Valuation) | United States (USD 0.68 billion), Canada (USD 0.25 billion), Germany (USD 0.18 billion) |
| Fastest-Growing Country Markets (2026 to 2036) | Canada (5.4% CAGR), Mexico (5.0% CAGR), United Kingdom & Germany (4.9% CAGR each) |
| Leading Active Market Players | Ocean Spray Cranberries, Inc., Fruit d'Or, Graceland Fruit, Inc., Decas Cranberry Products, Inc., Mariani Packing Company, Inc. |
Source: Future Market Insights analysis of the dried cranberries market, 2026.
This Report Answers
- How large the dried cranberries market is in 2026 and what it reaches by 2036
- Which product, nature and distribution channel segments lead in 2026
- What is driving demand and what is holding the category back
- Which countries grow fastest between 2026 and 2036
- What Ocean Spray Cranberries and other leading players have launched
- How the dried cranberries market is defined, segmented and measured
Executive Market Overview
Commercial baking plants and breakfast cereal manufacturers purchase sweetened dried cranberries (SDC) on long-term contracts, valuing their chewiness, distinct red visual appeal, and moisture retention in dry grain matrices. FMI finds that industrial food processors are shifting orders toward diced and reduced-sugar cranberry inclusions to maintain fruit visibility in breakfast cereals and snack bars, owing to tighter retail sugar labeling standards across North America and Europe. Supply availability remains tied to North American harvest yields, as production records from the USDA National Agricultural Statistics Service (May 2026) confirm that United States utilized cranberry output totaled 7.46 million barrels in 2025, with Wisconsin harvesting 4.80 million barrels or more than 60.0% of the national crop. Cereal and trail-mix formulators frequently blend infused cranberry pieces with freeze-dried fruits to control water activity during ambient storage.
Standard cane-sugar-infused dried cranberries face margin pressure in mass grocery aisles unless processors differentiate on organic certification or apple-juice infusion. In FMI's view, ingredient suppliers are capturing higher contract margins by pairing certified organic raw fruit with bake-stable fruit pieces engineered for high-speed dough extrusion. Public procurement is also opening institutional volume, as documented when the Commonwealth of Massachusetts (October 2026) and Ocean Spray Cranberries, Inc. launched 200-count cases of 1.16-ounce Fruit Punch Craisins pouches with 50% less sugar for K-12 school districts in October 2026. Market sizing covers revenue from packaged retail dried cranberries and bulk business-to-business dried cranberry ingredients across Sun Dried and Air Dried, while excluding fresh or frozen berries and cranberry juices bakery or cereal revenues.
Analyst Perspective
"Dried cranberry processors will expand revenue faster through certified organic and reduced-sugar ingredient grades than through standard sweetened bulk cartons, as bakery and institutional buyers pay a premium for compliant nutrition panels and locked-in water activity. The primary commercial risk is harvest concentration in Wisconsin and Quebec, where dry growing seasons tighten raw barrel supply and compress fixed-price co-packing margins."
- Nandini Roy Choudhury, Principal Consultant, Future Market Insights (FMI)
Key Market Trends & Insights
- Institutional and Retail Reformulation Toward Reduced-Sugar Pouches:School nutrition mandates and front-of-pack sugar rules are prompting processors to replace full-sugar infusion syrups with soluble fiber or fruit-juice concentrates. In October 2026, the Commonwealth of Massachusetts (October 2026) confirmed that Massachusetts K-12 school districts began ordering reformulated 1.16-ounce Craisins pouches containing 50% less sugar with waived state delivery fees for the 2026 to 2027 school year, while scientific guidance from the UK Department of Health and Social Care SACN (November 2026) tightened free-sugar classifications for processed fruit ingredients.
- Consolidation of Certified Organic Cranberry Supply in Quebec:Multinational cereal and snack manufacturers are locking in multi-year organic dried cranberry contracts with vertically integrated Canadian handlers to prevent supply bottlenecks. Horticultural records from Agriculture and Agri-Food Canada (August 2025) show that Canada harvested 211,790 metric tons of cranberries, with Quebec supplying 154,288 metric tons (72.8% of national output) and maintaining 17.5% of provincial cranberry acreage under certified organic management.
- Third-Party Food Safety and Ethical Audit Qualification for Bulk Ingredients:Industrial bakery and confectionery procurement teams increasingly require verified facility audit grades and effluent controls before approving bulk dried-fruit vendors. In June 2025, Graceland Fruit, Inc. (June 2025) secured a Grade AA certificate under BRCGS Global Standard Food Safety Issue 9 covering cranberry infusion and drying at Frankfort, Michigan, followed by Fruit d'Or (March 2026) completing a zero-nonconformity Sedex SMETA 7.0 audit at its Plessisville facility in March 2026.
What Are the Main Drivers, Restraints, and Opportunities?
Repeat industrial inclusion in breakfast cereals and portioned retail snack pouches drives core shipment volume, whereas harvest weather swings and strict free-sugar disclosures restrain margin expansion, leaving apple-juice-infused organic cuts as the primary commercial opportunity through 2036.
Driver: Portion-Controlled Retail Snacking and Bake-Stable Industrial Formulations
Commercial bakeries and snack packers specify sweetened and diced dried cranberrieson account of their low water activity and tart flavor profile that balances sweet oat bars and superfoods trail mixes without requiring refrigerated transit. FMI observes that retail demand is expanding through single-serve multipacks that fit household lunchboxes and convenience store racks. In June 2025, Mariani Packing Company, Inc. (June 2025) expanded its retail convenience range by launching an 8-pouch single-serve dried fruit Snack Packs format designed for portion-controlled household consumption, helping grocery chains lift unit velocity per shelf foot.
Restraint: North American Bog Yield Volatility and Free-Sugar Labeling Friction
Dry growing conditions in primary North American bogs periodically tighten raw berry availability for dehydration plants, while mandatory added-sugar and free-sugar disclosures complicate clean-label product approvals for bakery flavor pastes and fruit fillings. Crop outlook data from the USDA Economic Research Service (November 2025) shows that the 2025 United States cranberry crop forecast dropped 9.0% year-on-year to 8.13 million barrels, with Massachusetts harvest projections falling 22.0% to 1.75 million barrels due to dry bog conditions. Simultaneously, the UK Department of Health and Social Care SACN (November 2026) confirmed in November 2026 that fruit subjected to cellular-breakdown processing falls under free-sugar dietary guidance, lengthening retail nutrition qualification.
Opportunity: Apple-Juice-Infused Organic Cuts and Upcycled Processing Streams
Processors that replace refined cane sugar with organic apple-juice infusion and document closed-loop manufacturing are winning premium supply contracts with European and North American clean label ingredients buyers. FMI believes brand owners are willing to pay higher contract prices for unsweetened or fruit-juice-sweetened organic slices that keep front-of-pack sugar counts low. In December 2025, Fruit d'Or (December 2025) documented measurable industrial effluent reductions and residual cranberry pomace recovery in its 2025 Sustainability Progress Report while scaling commercial shipments of Patience Fruit & Co (January 2026) 142-gram Organic Sliced Dried Cranberries with No Added Sugar across North American grocery banners.
How Is the Dried Cranberries Market Segmented?
Dried Cranberries Market is segmented by Product and Nature. Forecast period from 2026 to 2036.
| Segmentation Axis | Sub-Segments Covered | 2026 Leading Segment & Share | Remainder & Total Alignment (2026 to 2036) |
|---|---|---|---|
| Product | Sun Dried, Air Dried, Freeze Dried, Others | Sun Dried (42.0% share in 2026) | Other Segment Combined (58.0% share) | Total (100.0%) |
| Nature | Organic, Conventional | Organic (63.0% share in 2026) | Other Segment Combined (37.0% share) | Total (100.0%) |
| Distribution Channel | Supermarkets & Hypermarkets, Convenience Stores, Online | Supermarkets & Hypermarkets (49.0% share in 2026) | Other Segment Combined (51.0% share) | Total (100.0%) |
| Region | North America, Latin America, Western Europe, Eastern Europe, East Asia, South Asia and Pacific, Middle East and Africa | North America (led by USA and Canada at 51.7% combined share) | Canada (5.4% CAGR) & Mexico (5.0% CAGR) lead national growth |
Source: Future Market Insights analysis of the dried cranberries market, 2026.
Why Does the Sun Dried Segment Lead by Product?
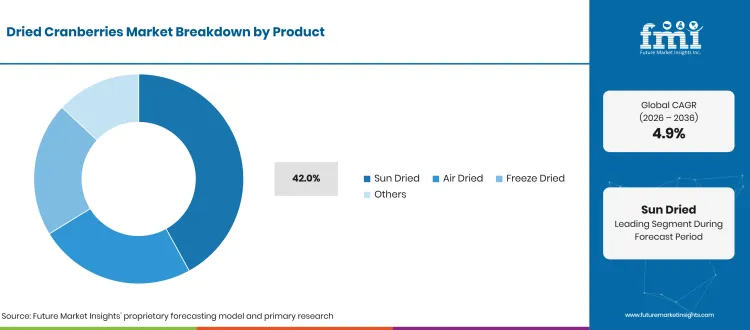
Sun Dried varieties secure a leading 42.0% share of Product revenue in 2026, favored by commercial bakeries and snack brands for economical dehydration costs and chewy texture in hearth breads and trail mixes compared with higher-cost freeze-dried fruit inclusions. freeze-dried fruit inclusions. Industrial buyers evaluate whole and sliced sun-dried berries on controlled water activity between 0.45 and 0.62 so fruit pieces do not migrate moisture into dry cereal flakes. Commercial ingredient specifications from Traina Foods (April 2026), which marked its 100-year California sun-drying milestone in April 2026, and Ocean Spray Cranberries, Inc. (January 2026) confirm that whole and diced infused cranberry formats remain the primary volume anchor for bakery and snack co-packers through 2036.
Why Does the Organic Segment Lead by Nature?
Organic sourcing commands a decisive 63.0% revenue share in 2026, driven by higher unit wholesale prices and mandatory segregated chain-of-custody documentation across European and North American organic food and beveragessupply chains. Statutory organic amendments enacted under UK Statutory Instruments (October 2025) (The Organic Production Amendment Regulations 2025, S.I. 2025/1111) extended organic processing compliance windows through 31 December 2026. Fruit d'Or (January 2026) and Bella Viva Orchards (October 2026) expanded certified organic whole and apple-juice-infused dried cranberry offerings for clean-label cereal brands.
Why Does the Supermarkets & Hypermarkets Segment Lead by Distribution Channel?
Supermarkets and hypermarkets hold 49.0% of the Distribution Channel category in 2026, serving as the main retail source for resealable stand-up pouches and baking-aisle ingredients. FMI believes large-format grocery chains retain the largest channel share helped by end-cap merchandising across produce and baking and private-label freeze-dried fruits. Multi-ounce resealable stand-up pouches allow households to compare reduced-sugar and organic claims directly at the shelf. Retail assortment tracking from Decas Cranberry Products, Inc. (January 2026) and Mariani Packing Company, Inc. (January 2026) confirms that grocery buyers prioritize 5-ounce to 48-ounce resealable pouches with visible fiber and sugar disclosures to sustain repeat household replenishment through 2036.
Regional & Country Outlook
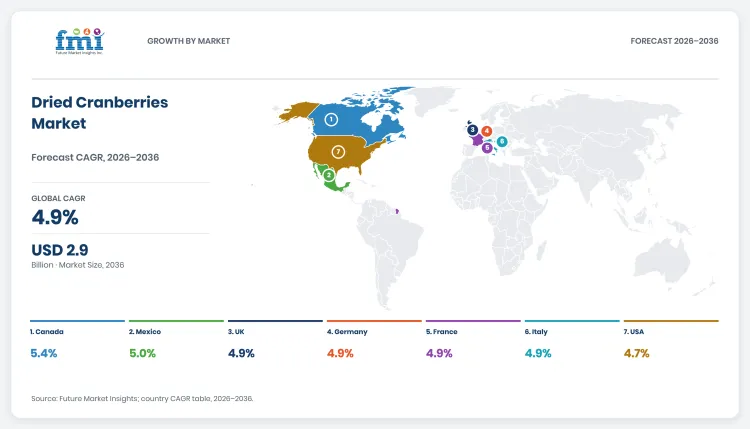
North America and Western Europe anchor global dried cranberries demand through 2036, corroborated by domestic bog cultivation in the United States and Canada and established organic retail channels across Germany, France, the United Kingdom, and Italy. FMI projects the seven profiled countries below to represent 81.1% of global market value in 2026 (USD 1.46 billion), rising to USD 2.34 billion by 2036 as food processors integrate dried cranberry cuts and fruit and vegetable ingredients in bakery and snack lines. While the United States generates the largest 10-year dollar addition at +USD 0.40 billion, Canada leads national growth rates at a 5.4% CAGR, followed by Mexico at 5.0% CAGR.
| Country | 2026 Revenue | 2036 Revenue | 10-Year Addition | 2026 to 2036 CAGR | Global Share (2026 -> 2036) |
|---|---|---|---|---|---|
| Canada | USD 0.25 billion | USD 0.42 billion | +USD 0.17 billion | 5.4% | 13.9% -> 14.5% |
| Mexico | USD 0.09 billion | USD 0.15 billion | +USD 0.06 billion | 5.0% | 5.0% -> 5.2% |
| United Kingdom | USD 0.13 billion | USD 0.21 billion | +USD 0.08 billion | 4.9% | 7.2% -> 7.2% |
| Germany | USD 0.18 billion | USD 0.29 billion | +USD 0.11 billion | 4.9% | 10.0% -> 10.0% |
| France | USD 0.12 billion | USD 0.19 billion | +USD 0.07 billion | 4.9% | 6.7% -> 6.6% |
| Italy | USD 0.03 billion | USD 0.05 billion | +USD 0.02 billion | 4.9% | 1.7% -> 1.7% |
| United States | USD 0.68 billion | USD 1.08 billion | +USD 0.40 billion | 4.7% | 37.8% -> 37.2% |
Source: Future Market Insights analysis of the dried cranberries market, 2026.
United States
Demand for dried cranberries in United States is projected to rise from USD 0.68 billion in 2026 to USD 1.08 billion by 2036, advancing at a 4.7% CAGR and adding USD 0.40 billion in new revenue. FMI observes that domestic demand is anchored by large-scale cereal manufacturing and institutional school nutrition procurement rather than seasonal fresh-berry sales. Production statistics published by the USDA National Agricultural Statistics Service (May 2026) show that the United States harvested 7.46 million barrels of cranberries in 2025, while the Commonwealth of Massachusetts (October 2026) rolled out 200-pouch cases of reduced-sugar Massachusetts-grown Craisins across K-12 schools in October 2026. FMI expects continued school-meal reformulation and retail multipack expansion to sustain steady bulk contract reorders across United States dehydration plants through 2036.
Canada
Buyer adoption of dried cranberries across Canada is estimated to expand from USD 0.25 billion in 2026 to USD 0.42 billion by 2036, spurred by a 5.4% CAGR and generating USD 0.17 billion in commercial expansion. In FMI's assessment, Canadian market growth outpaces the global average owing to Quebec's concentrated organic bog infrastructure and domestic processors pairing dried cranberries with aronia berries in export-grade snack mixes. Official horticultural records from Agriculture and Agri-Food Canada (August 2025) confirm that Quebec produced 154,288 metric tons of cranberries (72.8% of national output) with 17.5% of provincial cranberry acreage certified organic, while Fruit d'Or (March 2026) completed its Plessisville SMETA 7.0 audit in March 2026. FMI projects expanding organic apple-juice-infused dehydration capacity in Quebec to drive domestic retail and industrial sales through 2036.
Germany
Dried cranberries industry in Germany is set to scale from USD 0.18 billion in 2026 to USD 0.29 billion by 2036, driven by a 4.9% CAGR and adding USD 0.11 billion in incremental market value. FMI finds that German demand is driven by muesli manufacturers and discounter private-label programs that require strict European Union organic import certificates and low-pesticide traceability. Annual sector tracking from Bund Ökologische Lebensmittelwirtschaft (February 2026) confirms that German organic food and beverage retail sales expanded by 4.5% year-on-year in 2025 as mainstream supermarkets and discounters widened organic dry-goods assortments. FMI anticipates sustained private-label muesli and bakery demand to keep Germany as Europe's largest dried cranberry buyer through 2036.
United Kingdom
Sales of dried cranberries throughout United Kingdom are projected to increase from USD 0.13 billion in 2026 to USD 0.21 billion by 2036, progressing at a 4.9% CAGR and creating USD 0.08 billion in additional revenue. FMI believes supermarket home-baking aisles and portioned snack packs anchor British consumption, attributed to retailer compliance with high-fat and salt (HFSS) placement rules. Government data from the UK Department for Environment, Food & Rural Affairs (March 2026) shows that supermarkets captured 66.7% of all United Kingdom organic food and drink retail sales in 2025. FMI expects British grocery chains to expand reduced-sugar and fruit-juice-sweetened dried cranberry listings across baking and snacking planograms through 2036.
France
Consumption of dried cranberries across France is estimated to climb from USD 0.12 billion in 2026 to USD 0.19 billion by 2036, reflecting a 4.9% CAGR and contributing USD 0.07 billion over the forecast decade. FMI's analysis indicates that French demand is shifting toward specialist organic stores and patisserie ingredient distributors as a result of national agricultural programs promoting certified organic ingredients. Figures published by the Ministère de l'Agriculture et de la Souveraineté Alimentaire (May 2026) and Agence BIO (June 2025) confirm that 14.9% of French farms (61,853 holdings across 2.7 million hectares) operate under organic certification while household organic retail value rose 0.8%. In FMI's view, rising artisan bakery and organic breakfast-mix adoption will support steady French import orders through 2036.
Mexico
Revenue generated by dried cranberries suppliers in Mexico is forecast to expand from USD 0.09 billion in 2026 to USD 0.15 billion by 2036, anchored by a 5.0% CAGR and generating USD 0.06 billion in new category sales. FMI observes that Mexican industrial bakeries and modern supermarket chains are increasing imports of bulk and retail-packed dried cranberries fueled by duty-free North American trade and reformulation around front-of-pack warning seals. According to the USDA Foreign Agricultural Service (April 2025) (MX2025-0019), food processing accounts for 4.0% of Mexico's gross domestic product with the United States supplying 35.0% of Mexico's agricultural ingredient imports. FMI projects expanding modern grocery private labels and commercial bakery lines to accelerate Mexican dried cranberry adoption through 2036.
Italy
Buyer procurement of dried cranberries throughout Italy is tracking from USD 0.03 billion in 2026 to USD 0.05 billion by 2036, exhibiting a 4.9% CAGR and contributing USD 0.02 billion to national market value. FMI notes that Italian confectioners and premium bakery producers incorporate diced organic dried cranberries into seasonal panettone and biscotti bars due to rising domestic preference for certified organic fruit inclusions. Market monitoring released by ISMEA (January 2026) confirms that Italian household organic food purchasing grew 9.2% year-on-year in 2025 across modern retail channels. FMI expects continued premiumization in Italian baked goods and healthy snacking aisles to sustain import growth through 2036.
Competitive Environment and Notable Companies
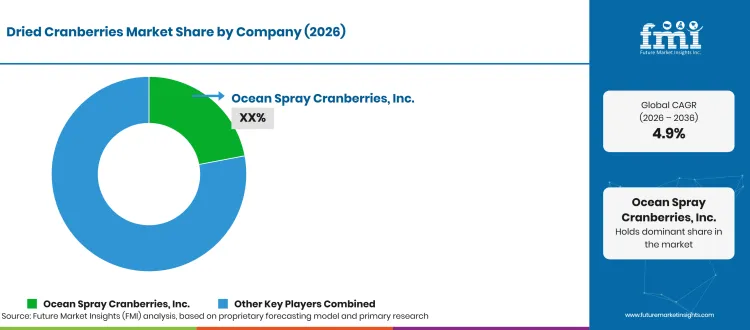
Notable companies operating in the global dried cranberries market include Ocean Spray Cranberries, Inc., Fruit d'Or, Graceland Fruit, Inc., Decas Cranberry Products, Inc., Mariani Packing Company, Inc., Patience Fruit & Co and Atoka Cranberries Orchards. Competition is structured around two commercial tiers: grower-owned cooperatives and vertically integrated bog processors controlling bulk osmotic infusion and dehydration lines, and branded retail dried-fruit marketers competing on resealable pouch formats and reduced-sugar claims placement.
How Are Companies Positioned in the Dried Cranberries Market?
Ocean Spray Cranberries, Inc. leads retail and institutional distribution through its Craisins brand and bulk ingredient division, as demonstrated by itsCommonwealth of Massachusetts (October 2026) school nutrition partnership. Fruit d'Or and its retail brand Patience Fruit & Co (January 2026), and subsidiary Decas Cranberry Products, Inc. (January 2026), lead certified organic and unsweetened dried cranberry supply across Canada and the United States, while Graceland Fruit, Inc. (June 2025) focuses on high-specification industrial bakery and cereal ingredients.
What Matters When a Buyer Selects a Dried Cranberry Supplier?
Industrial food manufacturers and retail grocery buyers qualify suppliers on lot-to-lot water activity stability, cut-size uniformity, verified organic chain-of-custody certificates, and third-party food-safety audit scores. Graceland Fruit, Inc. (June 2025) substantiates quality compliance with its Grade AA BRCGS Issue 9 certification, while Fruit d'Or (March 2026) provides buyer due-diligence assurance through its zero-nonconformity Sedex SMETA 7.0 facility audit completed in March 2026.
Which Capabilities Distinguish Product Offers?
Supplier portfolios diverge across sweetening matrices and piece geometry treatments. Ocean Spray Cranberries, Inc. (January 2026) supplies whole and sliced; Fruit d'Or (January 2026) differentiates with organic apple-juice-infused and no-added-sugar sliced cranberries; Mariani Packing Company, Inc. (June 2025) markets portioned 8-count single-serve retail pouches; and Traina Foods (April 2026) specializes in California sun-dried fruit ingredients.
How Does Geographic Reach Affect Competition?
Because commercial cranberry bogs are concentrated in Wisconsin and Massachusetts, North American processors control primary dehydration capacity and export internationally. Fruit d'Or (December 2025) leverages dual Canadian and Massachusetts operations (via Decas Farms) to serve European Union and North American organic buyers, while Bella Viva Orchards (October 2026) and Atoka Cranberries (January 2026) supply direct online and bulk regional accounts.
| Verified Company Evidence (2025 to 2026) | Commercial Effect | Buyer Action |
|---|---|---|
| 6 October 2026: Ocean Spray Cranberries, Inc. and the Commonwealth of Massachusetts launched 200-count cases of 1.16-oz Fruit Punch Craisins with 50% less sugar for K-12 schools (Commonwealth of Massachusetts, October 2026). | Demonstrates how 50%-less-sugar reformulation unlocks institutional USDA school-meal procurement. | Qualify reduced-sugar 1.16-oz single-serve pouches for institutional foodservice and K-12 bids. |
| 24 March 2026: Fruit d'Or completed a Sedex SMETA 7.0 social responsibility audit at its Plessisville, Quebec plant with zero nonconformities (Fruit d'Or, March 2026). | Satisfies multinational retailer and cereal-brand ESG and ethical sourcing qualification gates. | Request current SMETA 7.0 and organic traceability records during annual vendor onboarding. |
| 10 June 2025: Graceland Fruit, Inc. achieved a Grade AA certificate under BRCGS Global Standard Food Safety Issue 9 for cranberry infusion and drying (Graceland Fruit, Inc., June 2025). | Validates high-compliance dehydration and packing controls for industrial bakery and cereal cuts. | Verify lot-level water activity and BRCGS Issue 9 audit scope before contracting bulk diced fruit. |
Source: Verified corporate disclosures and Future Market Insights analysis, 2026.
| Company | Core Positioning | Verified Activity & Source Attribution |
|---|---|---|
| Ocean Spray Cranberries, Inc. | Grower cooperative; Craisins retail pouches and bulk dried cranberry ingredients | Launched Massachusetts-grown 50%-less-sugar 1.16-oz Craisins school pouches in October 2026 (Commonwealth of Massachusetts, October 2026). |
| Fruit d'Or | Canadian organic cranberry processor; cane-sugar and apple-juice-infused cuts | Completed zero-nonconformity Sedex SMETA 7.0 audit in March 2026 and released 2025 Sustainability Progress Report in December 2025 (Fruit d'Or, March 2026). |
| Graceland Fruit, Inc. | Industrial dried cranberry ingredient specialist for bakery, cereal, and trail mix | Secured BRCGS Food Safety Issue 9 Grade AA certification for cranberry infusion and drying in June 2025 (Graceland Fruit, Inc., June 2025). |
| Mariani Packing Company, Inc. | Branded retail sweetened dried cranberries and multi-pouch snack packs | Introduced 8-count single-serve dried fruit Snack Packs in June 2025 and 30-oz resealable cranberry bags (Mariani Packing Company, Inc., June 2025). |
| Decas Cranberry Products, Inc. | Massachusetts cranberry processor and Paradise Meadow retail brand (Fruit d'Or group) | Supplies Original Premium Dried Cranberries and bulk industrial ingredients across North America (Decas Cranberry Products, Inc., January 2026). |
| Patience Fruit & Co | Retail organic dried cranberry brand offering no-added-sugar and sliced formats | Markets 142-gram Organic Sliced Dried Cranberries with No Added Sugar across North American grocery channels in 2026 (Patience Fruit & Co, January 2026). |
| Atoka Cranberries | Quebec bulk sweetened and organic dried cranberry ingredient producer | Maintains documented B2B ingredient specifications on TraceGains for industrial food manufacturers (Atoka Cranberries, January 2026). |
| Traina Foods | California commercial sun-dried fruit processor and industrial ingredient supplier | Marked its 100-year sun-drying anniversary in April 2026 supplying sun-dried cranberries for bakery and foodservice (Traina Foods, April 2026). |
| Bella Viva Orchards | California organic dried cranberry producer for direct-to-consumer and specialty retail | Supplies USDA-certified organic lightly sweetened dried cranberries across direct online and specialty channels in 2026 (Bella Viva Orchards, October 2026). |
Source: Verified corporate disclosures and Future Market Insights analysis, 2026.
Key takeaways
- Valued at USD 1.8 billion in 2026, on course for USD 2.9 billion by 2036.
- The decade adds USD 1.1 billion in new value at a 4.9% CAGR.
- The product segment is led by Sun Dried at 42.0% of 2026 revenue.
- 63.0% of nature revenue goes to Organic in 2026.
- Canada grows fastest at 5.4% CAGR, ahead of Mexico at 5.0%.
Dried Cranberries Market Report Scope and Research Methodology
FMI sizes the global dried cranberries market by reconciling North American and international raw cranberry harvest allocations destined for osmotic infusion and dehydration against retail scanner sales and industrial food-processing procurement volumes. Revenue is measured at the point of packaged retail sale or business-to-business ingredient shipment across each tracked country, ensuring that bulk dried cranberries sold to cereal and bakery manufacturers are counted solely at the ingredient transaction level without double counting finished consumer foods. Segment and national revenue estimates are cross-checked against agricultural ministry crop summaries, organic acreage registries, and audited corporate product disclosures so that all sub-segments and countries sum to the global market total in every forecast year from 2026 to 2036.
| Coverage Field | Report Scope |
|---|---|
| Market definition | Revenue from packaged retail dried cranberries and business-to-business bulk dried cranberry ingredients. |
| Product segment | Sun Dried, Air Dried, Freeze Dried, and Others (Dominant: Sun Dried at 42.0% share in 2026; Other Segment Combined at 58.0%). |
| Nature segment | Organic and Conventional (Dominant: Organic at 63.0% share in 2026; Other Segment Combined at 37.0%). |
| Distribution channels | Supermarkets & Hypermarkets, Convenience Stores, and Online (Dominant: Supermarkets & Hypermarkets at 49.0% share in 2026). |
| Ingredients included | Whole, sliced, diced, glycerated, cane-sugar-infused, apple-juice-infused, and no-added-sugar dehydrated cranberries. |
| Packaging formats | Single-serve pouches (1.16 oz), multi-pouch retail snack packs, resealable household stand-up bags (4 oz to 48 oz), and bulk industrial cartons. |
| End users | Household retail shoppers, institutional school meal programs, commercial bakeries, breakfast cereal plants, and trail-mix co-packers. |
| Exclusions | Fresh or frozen raw cranberries, cranberry juice and concentrates, dietary supplement extracts, and downstream finished bakery or cereal revenues. |
| Quantitative units | USD billion for global and national market valuations. |
| Base and historical years | 2025 (Historical: USD 1.7 billion); 2026 (Estimated: USD 1.8 billion). |
| Forecast period | 2026 to 2036 (Projected 2036 valuation: USD 2.9 billion at a 4.9% CAGR). |
| Regions covered | North America, Latin America, Western Europe, Eastern Europe, East Asia, South Asia and Pacific, and Middle East and Africa. |
| Countries profiled | United States, Canada, Germany, United Kingdom, France, Mexico, and Italy. |
| Companies covered | Ocean Spray Cranberries, Inc., Fruit d'Or, Graceland Fruit, Inc., Decas Cranberry Products, Inc., Mariani Packing Company, Inc., Patience Fruit & Co, Atoka Cranberries, Traina Foods, and Bella Viva Orchards. |
Source: Future Market Insights analysis of the dried cranberries market, 2026.
Research Sources and Bibliography
- Agence BIO. (2025, June 12).L'Agence BIO dévoile les chiffres du marché et de la production bio. https://www.agencebio.org/wp-content/uploads/2025/06/CP_Presentation-des-chiffres-du-bio2024_Agence-BIO.pdf
- Agriculture and Agri-Food Canada. (2025, August 15).Statistical Overview of the Canadian Fruit Industry. https://agriculture.canada.ca/en/sector/horticulture/reports/statistical-overview-canadian-fruit-industry-2024
- Atoka Cranberries. (2026, January 15).Atoka Cranberries Inc. Commercial Ingredient Catalogue on TraceGains. https://gather.tracegains.com/market/supplier/776d4c6b-80f3-490d-b973-49491b1562a7
- Bella Viva Orchards. (2026, October 1).Organic Dried Cranberries Product Specification and Sourcing. https://www.bellaviva.com/products/dried-organic-cranberries
- Bund Ökologische Lebensmittelwirtschaft. (2026, February 10).Umsatz, Absatz und Importe beim deutschen Bio-Markt 2025/2026. https://www.boelw.de/themen/zahlen-fakten/handel/artikel/umsatz-absatz-importe-2026/
- Commonwealth of Massachusetts. (2026, October 6).Healey-Driscoll Administration Announces Massachusetts Grown Cranberries for Schools Across the State. https://www.mass.gov/news/healey-driscoll-administration-announces-massachusetts-grown-cranberries-for-schools-across-the-state
- Decas Cranberry Products, Inc. (2026, January 20).Original Premium Dried Cranberries Product Portfolio. https://www.decasfarms.com/products/premium-dried-cranberries
- Fruit d'Or. (2025, December 11).2025 Sustainability Progress Report: Fruit d'Or Continues to Turn Its Sustainability Ambitions Into Concrete Action. https://fruitdor.ca/en/blog/year-2-report-sustainable-development-plan/
- Fruit d'Or. (2026, January 18).Organic Dried Cranberries, Apple Juice Infused Specification. https://fruitdor.ca/en/products/organic-dried-cranberries-apple-juice-infused/
- Fruit d'Or. (2026, March 24).Fruit d'Or Reaffirms Its Commitment to Social Responsibility With the Successful Completion of the SMETA 7.0 Audit. https://fruitdor.ca/en/blog/sedex-member-2026/
- Graceland Fruit, Inc. (2025, June 10).BRCGS Global Standard Food Safety Issue 9 Certificate (Grade AA). https://www.gracelandfruit.com/wp-content/uploads/2025/07/BRCGS-Certificate-2025-Graceland-Fruit-Inc.pdf
- ISMEA. (2026, January 20).Biologico: gli acquisti alimentari delle famiglie nel 2025. https://www.ismeamercati.it/flex/cm/pages/ServeBLOB.php/L/IT/IDPagina/13855
- Mariani Packing Company, Inc. (2025, June 24).New Mariani Snack Packs: Pocket-Size Fruit Boosts for Cravings on the Go. https://mariani.com/blogs/weve-got-news/new-mariani-snack-packs
- Mariani Packing Company, Inc. (2026, January 12).Sweetened Dried Cranberries Retail Portfolio. https://mariani.com/products/cranberries
- Ministère de l'Agriculture et de la Souveraineté Alimentaire. (2026, May 7).Le Printemps Bio, temps fort de l'agriculture biologique française. https://agriculture.gouv.fr/le-printemps-bio-temps-fort-de-lagriculture-biologique-francaise
- Ocean Spray Cranberries, Inc. (2026, January 10).Dried Cranberries Commercial Ingredients Portfolio. https://www.oceanspray.com/ingredients/products/dried-cranberries
- Patience Fruit & Co. (2026, January 14).Organic Sliced Dried Cranberries With No Added Sugar Range. https://www.patiencefruitco.com/en/product-category/dried-fruits/
- Traina Foods. (2026, April 15).Traina Dried Fruit 100-Year Sun-Drying Anniversary and Commercial Ingredient Portfolio. https://www.trainadriedfruit.com/news-and-trends/
- UK Department for Environment, Food & Rural Affairs. (2026, March 12).Food Statistics in Your Pocket: Organic Food and Drink Sales. https://www.gov.uk/government/statistics/food-statistics-pocketbook/food-statistics-in-your-pocket
- UK Department of Health and Social Care SACN. (2026, November 10).Free Sugars in Processed Fruit and Vegetables: SACN Statement Summary. https://www.gov.uk/government/publications/free-sugars-in-processed-fruit-and-vegetables-sacn-statement/free-sugars-in-processed-fruit-and-vegetables-sacn-statement-summary
- UK Statutory Instruments. (2025, October 20).The Organic Production (Amendment) Regulations 2025 (S.I. 2025/1111). https://www.legislation.gov.uk/id/uksi/2025/1111/regulation/2/4
- USDA Economic Research Service. (2025, November 26).Cranberry Production Forecast to Land Near Five-Year Average in 2025. https://www.ers.usda.gov/data-products/charts-of-note/113512
- USDA Foreign Agricultural Service. (2025, April 3).Food Processing Ingredients Annual: Mexico (MX2025-0019). https://apps.fas.usda.gov/newgainapi/api/Report/DownloadReportByFileName?fileName=Food%20Processing%20Ingredients%20Annual_Mexico%20City%20ATO_Mexico_MX2025-0019
- USDA National Agricultural Statistics Service. (2026, May 1).Noncitrus Fruits and Nuts 2025 Summary (Cranberry Production). https://release.nass.usda.gov/reports/ncit0526.pdf
Table of Content
- Key Takeaways
- Market Size and CAGR
- Top Growth Driver
- Fastest Growing Segment
- Leading Region
- Key Companies
- Emerging Opportunities
- Executive Summary
- Global Market Outlook
- Demand-side Trends
- Supply-side Trends
- Technology Roadmap Analysis
- Analysis and Recommendations
- Analyst Perspective (What is happening? Why now? What should investors know?)
- Key Questions Answered
- How large is the market?
- What is the CAGR?
- What are key trends?
- Which region dominates?
- Who are the leaders?
Read More...
- Market Overview
- Market Coverage / Taxonomy
- Market Definition / Scope / Limitations
- Research Methodology
- Chapter Orientation
- Analytical Lens and Working Hypotheses
- Market Structure, Signals, and Trend Drivers
- Benchmarking and Cross-market Comparability
- Market Sizing, Forecasting, and Opportunity Mapping
- Research Design and Evidence Framework
- Desk Research Programme (Secondary Evidence)
- Expert Input and Fieldwork (Primary Evidence)
- Tooling, Models, and Reference Databases
- Data Engineering and Model Build
- Quality Assurance and Audit Trail
- Market Background
- Market Dynamics (Drivers, Restraints, Opportunity, Trends)
- Scenario Forecast (Optimistic, Likely, Conservative)
- Impact Analysis
- AI Impact
- Sustainability Impact
- Regulatory Impact
- Technology Impact
- Consumer / Buyer Analysis
- Purchase Drivers
- Adoption Barriers
- Buyer Journey
- Opportunity Map Analysis
- Product Life Cycle Analysis
- Supply Chain Analysis
- Investment Feasibility Matrix
- Value Chain Analysis
- PESTLE and Porter's Analysis
- Regulatory Landscape
- Regional Parent Market Outlook
- Production and Consumption Statistics
- Import and Export Statistics
- Global Market Analysis and Forecast, 2021 to 2036
- Historical Market Size Value (USD Billion) Analysis, 2021 to 2025
- Current and Future Market Size Value (USD Billion) Projections, 2026 to 2036
- Y-o-Y Growth Trend Analysis
- Absolute $ Opportunity Analysis
- Global Market Pricing Analysis, 2021 to 2036
- Global Market Analysis and Forecast, By Product, 2021 to 2036
- Introduction / Key Findings
- Historical Market Size Value (USD Billion) Analysis By Product, 2021 to 2025
- Current and Future Market Size Value (USD Billion) Analysis and Forecast By Product, 2026 to 2036
- Sun Dried
- Air Dried
- Freeze Dried
- Others
- Y-o-Y Growth Trend Analysis By Product, 2021 to 2025
- Absolute $ Opportunity Analysis By Product, 2026 to 2036
- Global Market Analysis and Forecast, By Nature, 2021 to 2036
- Introduction / Key Findings
- Historical Market Size Value (USD Billion) Analysis By Nature, 2021 to 2025
- Current and Future Market Size Value (USD Billion) Analysis and Forecast By Nature, 2026 to 2036
- Organic
- Conventional
- Y-o-Y Growth Trend Analysis By Nature, 2021 to 2025
- Absolute $ Opportunity Analysis By Nature, 2026 to 2036
- Global Market Analysis and Forecast, By Distribution Channel, 2021 to 2036
- Introduction / Key Findings
- Historical Market Size Value (USD Billion) Analysis By Distribution Channel, 2021 to 2025
- Current and Future Market Size Value (USD Billion) Analysis and Forecast By Distribution Channel, 2026 to 2036
- Supermarkets & Hypermarkets
- Convenience Stores
- Online
- Y-o-Y Growth Trend Analysis By Distribution Channel, 2021 to 2025
- Absolute $ Opportunity Analysis By Distribution Channel, 2026 to 2036
- Global Market Analysis and Forecast, By Region, 2021 to 2036
- Introduction
- Historical Market Size Value (USD Billion) Analysis By Region, 2021 to 2025
- Current Market Size Value (USD Billion) Analysis and Forecast By Region, 2026 to 2036
- North America
- Western Europe
- East Asia
- South Asia and Pacific
- Market Attractiveness Analysis By Region
- North America Market Analysis and Forecast, By Country, 2021 to 2036
- Historical Market Size Value (USD Billion) Trend Analysis By Market Taxonomy, 2021 to 2025
- Market Size Value (USD Billion) Forecast By Market Taxonomy, 2026 to 2036
- By Country
- United States
- Canada
- By Product
- By Nature
- By Distribution Channel
- By Country
- Market Attractiveness Analysis
- By Country
- By Product
- By Nature
- By Distribution Channel
- Key Takeaways
- Western Europe Market Analysis and Forecast, By Country
- Historical Market Size Value (USD Billion) Trend Analysis By Market Taxonomy, 2021 to 2025
- Market Size Value (USD Billion) Forecast By Market Taxonomy, 2026 to 2036
- By Country
- United Kingdom
- Germany
- France
- By Product
- By Nature
- By Distribution Channel
- By Country
- Market Attractiveness Analysis
- By Country
- By Product
- By Nature
- By Distribution Channel
- Key Takeaways
- East Asia Market Analysis and Forecast, By Country
- Historical Market Size Value (USD Billion) Trend Analysis By Market Taxonomy, 2021 to 2025
- Market Size Value (USD Billion) Forecast By Market Taxonomy, 2026 to 2036
- By Country
- China
- Japan
- South Korea
- By Product
- By Nature
- By Distribution Channel
- By Country
- Market Attractiveness Analysis
- By Country
- By Product
- By Nature
- By Distribution Channel
- Key Takeaways
- South Asia and Pacific Market Analysis and Forecast, By Country
- Historical Market Size Value (USD Billion) Trend Analysis By Market Taxonomy, 2021 to 2025
- Market Size Value (USD Billion) Forecast By Market Taxonomy, 2026 to 2036
- By Country
- India
- Australia
- Rest of world aggregate
- By Product
- By Nature
- By Distribution Channel
- By Country
- Market Attractiveness Analysis
- By Country
- By Product
- By Nature
- By Distribution Channel
- Key Takeaways
- Key Countries Market Analysis
- United States
- Pricing Analysis
- Market Share Analysis, 2025
- By Product
- By Nature
- By Distribution Channel
- Canada
- Pricing Analysis
- Market Share Analysis, 2025
- By Product
- By Nature
- By Distribution Channel
- Germany
- Pricing Analysis
- Market Share Analysis, 2025
- By Product
- By Nature
- By Distribution Channel
- United Kingdom
- Pricing Analysis
- Market Share Analysis, 2025
- By Product
- By Nature
- By Distribution Channel
- France
- Pricing Analysis
- Market Share Analysis, 2025
- By Product
- By Nature
- By Distribution Channel
- India
- Pricing Analysis
- Market Share Analysis, 2025
- By Product
- By Nature
- By Distribution Channel
- China
- Pricing Analysis
- Market Share Analysis, 2025
- By Product
- By Nature
- By Distribution Channel
- Japan
- Pricing Analysis
- Market Share Analysis, 2025
- By Product
- By Nature
- By Distribution Channel
- South Korea
- Pricing Analysis
- Market Share Analysis, 2025
- By Product
- By Nature
- By Distribution Channel
- Australia
- Pricing Analysis
- Market Share Analysis, 2025
- By Product
- By Nature
- By Distribution Channel
- United States
- Market Structure Analysis
- Competition Dashboard
- Competition Benchmarking
- Market Share Analysis of Top Players
- By Regional
- By Product
- By Nature
- By Distribution Channel
- Emerging Startups
- Innovation Benchmarking
- Competition Analysis
- Competition Deep Dive
- Ocean Spray Cranberries, Inc.
- Overview
- Product Portfolio
- Profitability by Market Segments
- Sales Footprint
- Strategy Overview
- Marketing Strategy
- Product Strategy
- Channel Strategy
- Fruit d'Or
- Graceland Fruit, Inc.
- Mariani Packing Company, Inc.
- Decas Cranberry Products, Inc.
- Patience Fruit & Co
- Atoka Cranberries
- Traina Foods
- Bella Viva Orchards
- Ocean Spray Cranberries, Inc.
- Case Studies
- Success Stories
- Recent Developments
- Competition Deep Dive
- Assumptions & Acronyms Used
List of Tables
- Table 1: Global Market Value (USD Billion) Forecast by Region, 2021 to 2036
- Table 2: Global Market Value (USD Billion) Forecast by Product, 2021 to 2036
- Table 3: Global Market Value (USD Billion) Forecast by Nature, 2021 to 2036
- Table 4: Global Market Value (USD Billion) Forecast by Distribution Channel, 2021 to 2036
- Table 5: North America Market Value (USD Billion) Forecast by Country, 2021 to 2036
- Table 6: North America Market Value (USD Billion) Forecast by Product, 2021 to 2036
- Table 7: North America Market Value (USD Billion) Forecast by Nature, 2021 to 2036
- Table 8: North America Market Value (USD Billion) Forecast by Distribution Channel, 2021 to 2036
- Table 9: Western Europe Market Value (USD Billion) Forecast by Country, 2021 to 2036
- Table 10: Western Europe Market Value (USD Billion) Forecast by Product, 2021 to 2036
- Table 11: Western Europe Market Value (USD Billion) Forecast by Nature, 2021 to 2036
- Table 12: Western Europe Market Value (USD Billion) Forecast by Distribution Channel, 2021 to 2036
- Table 13: East Asia Market Value (USD Billion) Forecast by Country, 2021 to 2036
- Table 14: East Asia Market Value (USD Billion) Forecast by Product, 2021 to 2036
- Table 15: East Asia Market Value (USD Billion) Forecast by Nature, 2021 to 2036
- Table 16: East Asia Market Value (USD Billion) Forecast by Distribution Channel, 2021 to 2036
- Table 17: South Asia and Pacific Market Value (USD Billion) Forecast by Country, 2021 to 2036
- Table 18: South Asia and Pacific Market Value (USD Billion) Forecast by Product, 2021 to 2036
- Table 19: South Asia and Pacific Market Value (USD Billion) Forecast by Nature, 2021 to 2036
- Table 20: South Asia and Pacific Market Value (USD Billion) Forecast by Distribution Channel, 2021 to 2036
List of Figures
- Figure 1: Global Market Pricing Analysis
- Figure 2: Global Market Value (USD Billion) Forecast 2021-2036
- Figure 3: Global Market Value Share and BPS Analysis by Product, 2026 and 2036
- Figure 4: Global Market Y-o-Y Growth Comparison by Product, 2026-2036
- Figure 5: Global Market Attractiveness Analysis by Product
- Figure 6: Global Market Value Share and BPS Analysis by Nature, 2026 and 2036
- Figure 7: Global Market Y-o-Y Growth Comparison by Nature, 2026-2036
- Figure 8: Global Market Attractiveness Analysis by Nature
- Figure 9: Global Market Value Share and BPS Analysis by Distribution Channel, 2026 and 2036
- Figure 10: Global Market Y-o-Y Growth Comparison by Distribution Channel, 2026-2036
- Figure 11: Global Market Attractiveness Analysis by Distribution Channel
- Figure 12: Global Market Value (USD Billion) Share and BPS Analysis by Region, 2026 and 2036
- Figure 13: Global Market Y-o-Y Growth Comparison by Region, 2026-2036
- Figure 14: Global Market Attractiveness Analysis by Region
- Figure 15: North America Market Incremental Dollar Opportunity, 2026-2036
- Figure 16: Western Europe Market Incremental Dollar Opportunity, 2026-2036
- Figure 17: East Asia Market Incremental Dollar Opportunity, 2026-2036
- Figure 18: South Asia and Pacific Market Incremental Dollar Opportunity, 2026-2036
- Figure 19: North America Market Value Share and BPS Analysis by Country, 2026 and 2036
- Figure 20: North America Market Value Share and BPS Analysis by Product, 2026 and 2036
- Figure 21: North America Market Y-o-Y Growth Comparison by Product, 2026-2036
- Figure 22: North America Market Attractiveness Analysis by Product
- Figure 23: North America Market Value Share and BPS Analysis by Nature, 2026 and 2036
- Figure 24: North America Market Y-o-Y Growth Comparison by Nature, 2026-2036
- Figure 25: North America Market Attractiveness Analysis by Nature
- Figure 26: North America Market Value Share and BPS Analysis by Distribution Channel, 2026 and 2036
- Figure 27: North America Market Y-o-Y Growth Comparison by Distribution Channel, 2026-2036
- Figure 28: North America Market Attractiveness Analysis by Distribution Channel
- Figure 29: Western Europe Market Value Share and BPS Analysis by Country, 2026 and 2036
- Figure 30: Western Europe Market Value Share and BPS Analysis by Product, 2026 and 2036
- Figure 31: Western Europe Market Y-o-Y Growth Comparison by Product, 2026-2036
- Figure 32: Western Europe Market Attractiveness Analysis by Product
- Figure 33: Western Europe Market Value Share and BPS Analysis by Nature, 2026 and 2036
- Figure 34: Western Europe Market Y-o-Y Growth Comparison by Nature, 2026-2036
- Figure 35: Western Europe Market Attractiveness Analysis by Nature
- Figure 36: Western Europe Market Value Share and BPS Analysis by Distribution Channel, 2026 and 2036
- Figure 37: Western Europe Market Y-o-Y Growth Comparison by Distribution Channel, 2026-2036
- Figure 38: Western Europe Market Attractiveness Analysis by Distribution Channel
- Figure 39: East Asia Market Value Share and BPS Analysis by Country, 2026 and 2036
- Figure 40: East Asia Market Value Share and BPS Analysis by Product, 2026 and 2036
- Figure 41: East Asia Market Y-o-Y Growth Comparison by Product, 2026-2036
- Figure 42: East Asia Market Attractiveness Analysis by Product
- Figure 43: East Asia Market Value Share and BPS Analysis by Nature, 2026 and 2036
- Figure 44: East Asia Market Y-o-Y Growth Comparison by Nature, 2026-2036
- Figure 45: East Asia Market Attractiveness Analysis by Nature
- Figure 46: East Asia Market Value Share and BPS Analysis by Distribution Channel, 2026 and 2036
- Figure 47: East Asia Market Y-o-Y Growth Comparison by Distribution Channel, 2026-2036
- Figure 48: East Asia Market Attractiveness Analysis by Distribution Channel
- Figure 49: South Asia and Pacific Market Value Share and BPS Analysis by Country, 2026 and 2036
- Figure 50: South Asia and Pacific Market Value Share and BPS Analysis by Product, 2026 and 2036
- Figure 51: South Asia and Pacific Market Y-o-Y Growth Comparison by Product, 2026-2036
- Figure 52: South Asia and Pacific Market Attractiveness Analysis by Product
- Figure 53: South Asia and Pacific Market Value Share and BPS Analysis by Nature, 2026 and 2036
- Figure 54: South Asia and Pacific Market Y-o-Y Growth Comparison by Nature, 2026-2036
- Figure 55: South Asia and Pacific Market Attractiveness Analysis by Nature
- Figure 56: South Asia and Pacific Market Value Share and BPS Analysis by Distribution Channel, 2026 and 2036
- Figure 57: South Asia and Pacific Market Y-o-Y Growth Comparison by Distribution Channel, 2026-2036
- Figure 58: South Asia and Pacific Market Attractiveness Analysis by Distribution Channel
- Figure 59: Global Market - Tier Structure Analysis
- Figure 60: Global Market - Company Share Analysis
Frequently Asked Questions
How big is the dried cranberries market in 2026?
Future Market Insights estimates the global dried cranberries market valuation at USD 1.8 billion in 2026, advancing from USD 1.7 billion in 2025 across retail and bulk ingredient channels.
How fast is the dried cranberries market to grow through 2036?
FMI projects the global dried cranberries market to expand at a 4.9% CAGR from 2026 to 2036, reaching USD 2.9 billion by 2036 and generating USD 1.1 billion in incremental revenue.
Which Product segment leads the dried cranberries market?
Sun Dried leads the Product category with a 42.0% revenue share in 2026, as commercial bakeries and snack co-packers favor pliable, cost-effective infused berries for cereals and breads.
Which Nature segment leads the dried cranberries market?
Organic dried cranberries represent 63.0% of Nature segment revenue in 2026, supported by organic certifications and grower supply contracts in Quebec.
Which Distribution Channel leads the dried cranberries market?
Supermarkets & Hypermarkets generate 49.0% of sales channel turnover in 2026, driven by high shelf turnover for resealable stand-up pouches in baking and snack aisles.
Which country is the largest dried cranberries market?
United States is the largest national market globally, accounting for 37.8% of global revenue in 2026 (USD 0.68 billion) and projected to reach USD 1.08 billion by 2036.
Which countries are expected to grow fastest in the dried cranberries market?
Canada is projected to grow fastest at a 5.4% CAGR from 2026 to 2036, followed by Mexico at 5.0% CAGR and the United Kingdom and Germany.9% CAGR each.
What drives demand for dried cranberries?
Demand rests on year-round use of shelf-stable, moisture-controlled fruit pieces in breakfast cereals and bakery items snack pouches, reinforced by reduced-sugar institutional school programs and organic apple-juice-infused formulations.
Preview the report firsthand - request a free sample
Get SampleGet the brochure for pricing and purchase details.
Get PDF
