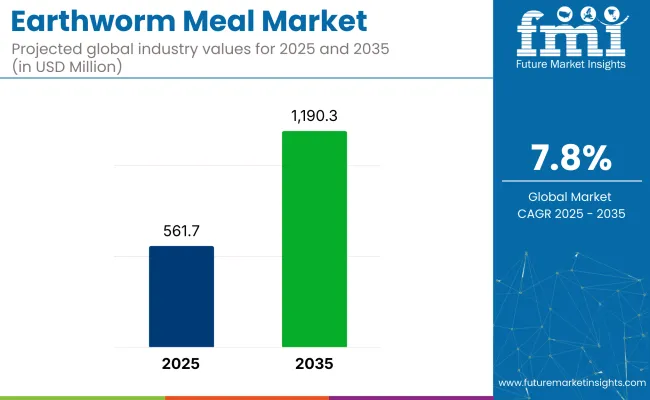
The earthworm meal market is likely to grow to USD 561.7 million in 2025 and will reach USD 1,190.3 million by 2035, advancing at a 7.8% CAGR. Momentum is being propelled by dual demand streams- protein-dense feed inputs and biological soil enhancers- coupled with policy shifts favoring circular-economy agriculture.

| Attributes | Description |
|---|---|
| Estimated Global Industry Size (2025E) | USD 561.7 million |
| Projected Global Industry Value (2035F) | USD 1,190.3 million |
| Value-based CAGR (2025 to 2035) | 7.8% |
In China, feed formulators lifted earthworm meal inclusion to 4% of fin-fish rations during 2024 pilot runs, trimming fish-in-fish-out ratios by 0.18 points and unlocking municipal eco-subsidies. USA specialty-pet brands introduced grain-free kibble blends featuring 8% defatted earthworm protein, and retail velocities outpaced conventional SKUs by 22% over six months.
Latin-American sugarcane cooperatives, grappling with nitrogen-price volatility, adopted powdered earthworm meal as a co-compost additive, shortening maturation cycles by seven days and boosting microbial activity indices by 19%. Southeast-Asian greenhouse clusters deployed slurry formulations through fertigation lines, achieving 14% yield lifts in leafy greens while meeting ASEAN heavy-metal thresholds.
Across Europe, aquafeed processors secured multiyear supply contracts that stipulate PCR-pathogen screening and blockchain lot traceability; average FOB price for GMP-certified powder closed Q1 2025 at USD 2,450 per MT, versus USD 1 920 for unverified bulk.
Investor confidence mirrors that seen in insect-protein funding rounds. Series-A financings in India and Brazil attracted blended capital at 1.3x revenue multiples, earmarked for solar-driven drying tunnels and automated sifting modules. Venture groups in Scandinavia formed a procurement consortium to guarantee 8000t of pasteurized earthworm meal annually for cold-water species, anchoring regional protein-transition objectives. Digital platforms now log geotagged vermiculture bins, humidity curves, and antibiotic-free certifications, cutting supplier vetting times by 35% and reducing rejection rates by 10.7%.
Pricing has remained relatively stable despite rising live-worm costs; bulk powder averages USD 2,100 per MT, while high-protein concentrates (≥65%) command USD 3,600. This spread incentivizes fractionators to upcycle lipid streams into horticultural wetting agents, broadening revenue stacks. Shelf-stable, 25 kg lined-kraft bags dominate logistics, with vacuum-sealed sachets entering premium pet and aquafeed niches.
Earthworm meal represents about 15-17% of the animal and aquaculture feed protein additive space. Within organic fertilizer and soil-amendment markets it captures roughly 34-38%. In pet-food ingredients its share hovers near 11-13%. Sustainable-agriculture inputs allocate close to 14%, and vermiculture downstream products account for roughly 9-11%. These proportions underscore an expanding but still underpenetrated position across protein, soil-health, and regenerative-input value chains.
The earthworm meal market has been segmented by form into powder and liquid. It has been segmented by end user into aquafeed, poultry feed, pet food, animal feed supplements, and fertilizers. It has been segmented by region into North America, Europe, Asia Pacific, Latin America, and Middle East & Africa.
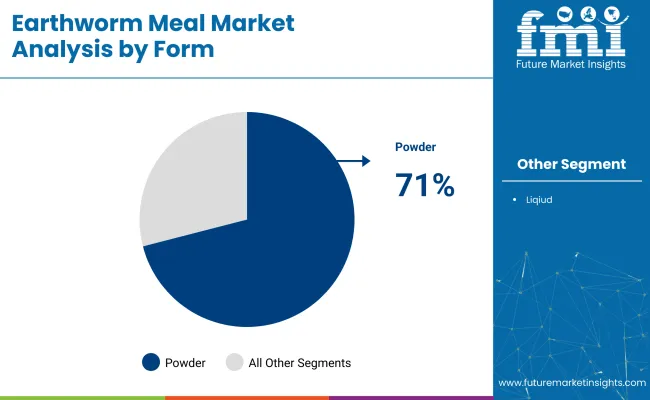
Powder form leads the earthworm meal market by volume and value, accounting for more than 71% of total consumption in 2025. Its stability, long shelf life, and ease of storage make it the preferred choice for feed manufacturers and fertilizer blenders.

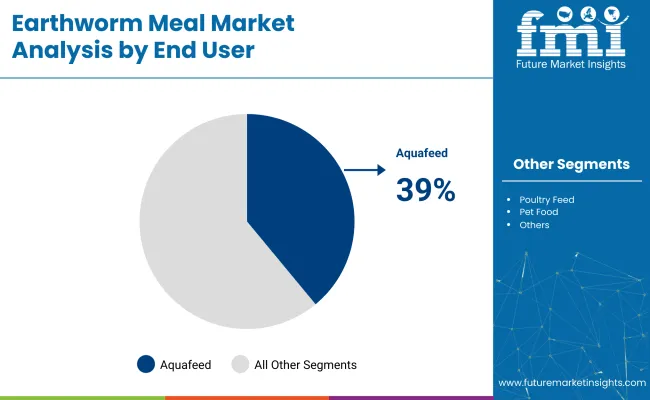
Aquafeed holds the leading share in the market by end use, contributing nearly 39% of total demand in 2025. High protein concentration, rapid digestibility, and optimal amino acid balance make product an effective substitute for traditional fishmeal in aquaculture diets.

Earthworm meal is emerging as a sustainable fishmeal alternative in aquaculture and pet food, offering enhanced digestibility and traceable terrestrial sourcing. In agriculture, it is enhancing soil fertility, boosting crop performance, and aligning with organic input regulations through its dual role as nutrient carrier and microbial stimulant.
Protein scarcity recalibrating feed strategy
Protein sourcing for global aquaculture and poultry chains is being re-engineered as fishmeal quotas tighten and oilseed volatility escalates. Earthworm meal, a vermiculture protein milled into fine worm-based powder, has been positioned as a biologically efficient replacement because conversion ratios are uplifted, amino-acid spectra mirror marine inputs, and allergen risk is minimized. Commercial feed binders have adopted pilot lots across Southeast Asian shrimp ponds and European recirculating systems, where feed-cost indices were cut.
Biological fertility redefining crop economics
Soil-fertility agendas across horticulture and speciality crops are being reshaped as synthetic-nitrogen curbs tighten under water-quality directives. It is being applied as a dual-function soil conditioner: biogenic nitrogen carrier and microbial stimulant.
Field plots in Mediterranean vineyards and Californian lettuce belts were recorded delivering higher leaf chlorophyll, deeper root mass, and lighter nitrate runoff than urea programmes. Agronomists contend that chitin fragments and humic complexes within earthworm tissue drive beneficial bacterial colonisation, thereby lifting phosphorus-uptake efficiency.

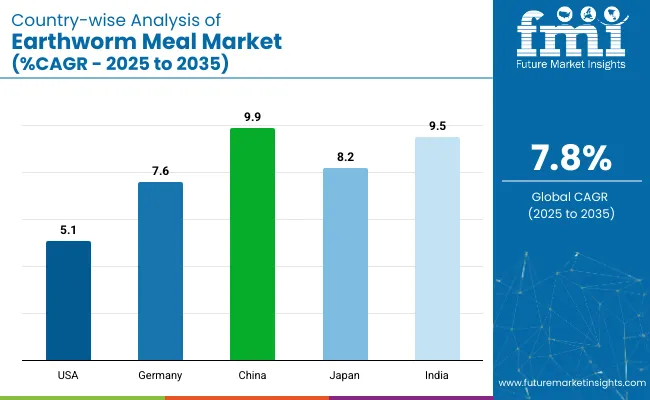
| Country | CAGR (2025 to 2035) |
|---|---|
| United States | 5.1% |
| Germany | 7.6% |
| China | 9.9% |
| Japan | 8.2% |
| India | 9.5% |
The earthworm meal industry, expected to grow at a global CAGR of 7.8% from 2025 to 2035, is showing varied momentum across major economies. A 5.1% CAGR is being recorded in the United States, an OECD member, where growth is supported by FDA-cleared aquafeed applications and retrofitting of feed mills for blended protein formulations.
Germany, also in the OECD, is exhibiting a 7.6% CAGR, aided by public funding for closed-loop vermiculture plants and integration into organic livestock supply chains. Japan, another OECD country, is expanding at 8.2%, driven by municipal waste-to-feed conversion and university-led in earthworm protein processing.
Faster growth is being seen in BRICS nations. India is forecast to grow at 9.5%, with backyard vermiculture units expanding under self-help groups and product gaining traction in aquaponics diets and poultry premixes. China leads with a 9.9% CAGR, supported by vertical vermiculture expansion and provincial aquaculture cooperatives replacing fishmeal with earthworm-based alternatives. While OECD countries are progressing through regulatory and enablers, BRICS economies are leading growth through production-scale adoption and cost substitution.
The report covers a detailed analysis of 40+ countries and the top five countries have been shared as a reference.
The USA earthworm meal market is estimated to grow at 5.1% CAGR during the forecast period. Despite modest volume expansion, the United States presents structurally resilient use cases for earthworm meal across pet nutrition, aquaculture, and regenerative agriculture. Commercial uptake remains gradual but firm, led by functional reformulations and policy clarity on alternative proteins in feed and soil applications.
The USDA and FDA have finalized guidance on novel feed inputs, enabling commercial-scale launches with lower regulatory friction. Pet food manufacturers are deploying worm protein in grain-free and hypoallergenic formats, capitalizing on the 27 percent year-on-year growth in the premium pet segment. In aquafeed, trout and catfish farms in the Pacific Northwest and Midwest are partially substituting fishmeal with worm powder to mitigate import price volatility.
Demand for earthworm meal is expected to grow in Germany at 7.6% CAGR during the forecast period. Stringent nitrate-reduction mandates and advanced waste-management systems are accelerating adoption across biodynamic farms and rainbow trout operations. Organic-certification bodies now list worm powder as an approved dual-use input, prompting feed and fertilizer convergence.
Sales of earthworm meal in China is projected to grow at 9.9% CAGR from 2025 to 2035. National targets to curb fishmeal imports and close nutrient loops drive fast uptake in tilapia and eel farms. Green Food pilots endorse worm-based fertilizers in nitrate-affected rural zones, while peri-urban waste belts house automated vermiculture units linked to municipal recycling.
The earthworm meal market in Japan is estimated to grow at 8.2% CAGR between 2025 and 2035. Eco-label compliance in shrimp and amberjack aquaculture plus aging-pet nutrition trends underpin demand. Regional governments subsidize worm-based inputs for high-value crops such as strawberries and tea, aligning with national soil-health targets.
Demand for India earthworm meal is likely to grow at 9.5% CAGR during the forecast period. Shrimp hatcheries seek fishmeal substitutes, poultry startups test gut-health benefits, and state subsidies fuel cooperative vermiculture units. ICAR field trials link worm meal to higher crop yields and moisture retention, supporting growth across biofertilizer channels.
The earthworm meal field is shaped by established producers and inventive specialists focused on high-protein feed inputs, organic soil enhancers, and controlled vermiculture platforms. Large-volume powders are supplied by Anphu Earthworm Co., Ltd. and Viet Delta Industrial Company to aquafeed mills throughout Southeast Asia, while Mazuri integrates worm protein into exotic-animal nutrition lines.
Certified organic meal for horticultural use is offered by Agricare Organic Farms Ltd., and pathogen-controlled feed ingredient output is provided by Taj Agro International and Kiryu Co., Ltd. Automated vermiculture units that transform food-processing waste into uniform biomass have been deployed by Allworms Bio-Tech Co., Ltd. and XABC Biotech Co., Ltd. North American pet-food formulators are served by Nature’s Healing Remedies, Inc. through cold-pressed worm protein concentrates, whereas European scale-up expertise is contributed by Ÿnsect, whose vertical-farming know-how is being adapted to produce large-volume product via proprietary bioreactors.
| Report Attributes | Details |
|---|---|
| Market Size (2025) | USD 561.7 million |
| Projected Market Size (2035) | USD 1,190.3 million |
| CAGR (2025 to 2035) | 7.8% |
| Base Year for Estimation | 2024 |
| Historical Period | 2020 to 2024 |
| Projections Period | 2025 to 2035 |
| Quantitative Units | USD billion for value and million units for volume |
| Form Analyzed (Segment 1) | Powder And Liquid. |
| End Users Analyzed (Segment 2) | Aquafeed, Poultry Feed, Pet Food, Animal Feed Supplements, And Fertilizers. |
| Regions Covered | North America, Europe, Asia Pacific, Middle East & Africa, Latin America |
| Countries Covered | United States, Canada, Germany, United Kingdom, France, Italy, Spain, China, Japan, South Korea, India, Australia, Brazil, Mexico, Argentina, Saudi Arabia, UAE, South Africa |
| Key Players | Anphu Earthworm Co., Ltd, Mazuri, Agricare Organic Farms Ltd, Taj Agro International, Kiryu Co., Ltd, Allworms Bio-Tech Co., Ltd., XABC Biotech Co., Ltd, Viet Delta Industrial Company, Nature's Healing Remedies, Inc., Ÿnsect |
| Additional Attributes | Dollar sales, share by end use, top export markets, regulatory approvals, aquafeed vs. fertilizer potential, cost benchmarks, form preference (powder vs. liquid), vermiculture scale-up trends, competitor capacity, price trends. |
The market offers products in various forms, including Powder, Pellet, and Liquid, ensuring versatility for different applications.
These products are widely used in industries such as Aquafeed, Poultry Feed, Pet Food, Animal Feed Supplements, and Fertilizer, catering to diverse agricultural and commercial needs.
The market is segmented as North America, Latin America, Western Europe, Eastern Europe, East Asia, South Asia & Pacific, Central Asia, Russia and Belarus, Balkan & Baltic Countries, Middle East and Africa.
The industry is valued at USD 561.7 million in 2025.
It is forecasted to reach USD 1,190.3 million by 2035.
The industry is anticipated to grow at a CAGR of 7.8% during this period.
Powder Form are projected to lead the market with a 71% share in 2025.
Asia Pacific, particularly China, is expected to be the key growth region with a projected growth rate of 9.9%.


Our Research Products

The "Full Research Suite" delivers actionable market intel, deep dives on markets or technologies, so clients act faster, cut risk, and unlock growth.

The Leaderboard benchmarks and ranks top vendors, classifying them as Established Leaders, Leading Challengers, or Disruptors & Challengers.

Locates where complements amplify value and substitutes erode it, forecasting net impact by horizon

We deliver granular, decision-grade intel: market sizing, 5-year forecasts, pricing, adoption, usage, revenue, and operational KPIs—plus competitor tracking, regulation, and value chains—across 60 countries broadly.

Spot the shifts before they hit your P&L. We track inflection points, adoption curves, pricing moves, and ecosystem plays to show where demand is heading, why it is changing, and what to do next across high-growth markets and disruptive tech

Real-time reads of user behavior. We track shifting priorities, perceptions of today’s and next-gen services, and provider experience, then pace how fast tech moves from trial to adoption, blending buyer, consumer, and channel inputs with social signals (#WhySwitch, #UX).

Partner with our analyst team to build a custom report designed around your business priorities. From analysing market trends to assessing competitors or crafting bespoke datasets, we tailor insights to your needs.
Supplier Intelligence
Discovery & Profiling
Capacity & Footprint
Performance & Risk
Compliance & Governance
Commercial Readiness
Who Supplies Whom
Scorecards & Shortlists
Playbooks & Docs
Category Intelligence
Definition & Scope
Demand & Use Cases
Cost Drivers
Market Structure
Supply Chain Map
Trade & Policy
Operating Norms
Deliverables
Buyer Intelligence
Account Basics
Spend & Scope
Procurement Model
Vendor Requirements
Terms & Policies
Entry Strategy
Pain Points & Triggers
Outputs
Pricing Analysis
Benchmarks
Trends
Should-Cost
Indexation
Landed Cost
Commercial Terms
Deliverables
Brand Analysis
Positioning & Value Prop
Share & Presence
Customer Evidence
Go-to-Market
Digital & Reputation
Compliance & Trust
KPIs & Gaps
Outputs
Full Research Suite comprises of:
Market outlook & trends analysis
Interviews & case studies
Strategic recommendations
Vendor profiles & capabilities analysis
5-year forecasts
8 regions and 60+ country-level data splits
Market segment data splits
12 months of continuous data updates
DELIVERED AS:
PDF EXCEL ONLINE
Meal Voucher Market Size and Share Forecast Outlook 2025 to 2035
Meal Kit Market Size and Share Forecast Outlook 2025 to 2035
Meal Tray Sealing Machines Market Size and Share Forecast Outlook 2025 to 2035
Meal Replacement Bars Market Size, Growth, and Forecast for 2025 to 2035
Meal Replacement Products Market Analysis by Product type, source, application and region Through 2035
Meal Kit Delivery Service Market - Trends & Forecast 2025 to 2035
Meal Replacement Shake Market Trends - Powder & Liquid Analysis
UK Meal Replacement Products Market Trends – Growth, Demand & Forecast 2025-2035
Oatmeal market Analysis by Nature, Type and Sales Channel Through 2025 to 2035
Fishmeal and Fish Oil Market Analysis - Size, Share, and Forecast Outlook 2025 to 2035
USA Meal Replacement Products Market Insights – Size, Share & Forecast 2025-2035
Fish Meal Alternative Market Size and Share Forecast Outlook 2025 to 2035
Fish Meal Market Analysis – Size, Share, and Forecast Outlook 2025 to 2035
Market Leaders & Share in the Fish Meal Industry
Ready Meals Packaging Market Size and Share Forecast Outlook 2025 to 2035
Vegan Meals Market Size, Growth, and Forecast for 2025 to 2035
Krill Meal Market Analysis - Size, Growth, and Forecast 2025 to 2035
Competitive Overview of Ready Meals Packaging Market Share
Blood Meal Market Analysis – Applications, Demand & Growth
Veggie Meals Market Trends - Innovation & Consumer Demand 2025 to 2035

Thank you!
You will receive an email from our Business Development Manager. Please be sure to check your SPAM/JUNK folder too.
Chat With
MaRIA