Electric Light Commercial Vehicle Market Size and Share Forecast Outlook (2024 to 2034)

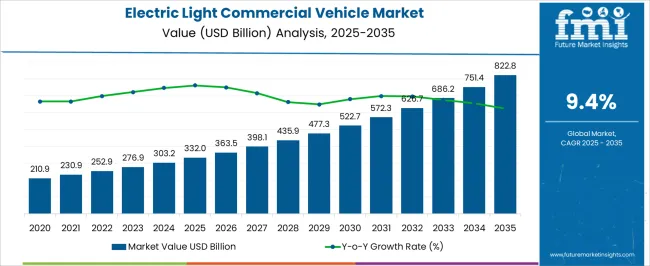
The electric light commercial vehicle market is estimated to be worth USD 303.2 billion in 2024. The demand for electric light commercial vehicles is predicted to grow at a robust CAGR of 9.5% over the forecast period. The market valuation is expected to reach USD 750 billion by 2034.

The rising popularity of all types of electric vehicles (EVs) with a growing emphasis on environmental sustainability is driving the growth of the market. However, to lower carbon emissions, the demand for electric light commercial vehicles (eLCVs) is rising with the introduction of sustainable urban delivery vans.

Electric Light Commercial Vehicle Market Trends & Analysis

  • In-house businesses, including transportation and logistics services, are increasingly exploring electric vehicles as an affordable option due to fluctuating fuel prices. Such commercial entities are getting drawn more towards electric light-duty trucks/vehicles that offer better stability over running expenses.
  • Growing investments in building charging stations with ongoing development of charging infrastructure is one of the critical issues with electric mobility. Electric light commercial vehicle manufacturers are thus extending their business and operations to establish networks of charging stations to scale up their LCV sales.
Report Attribute Details
Electric Light Commercial Vehicle Market Size (2024) USD 303.2 billion
Anticipated Market Value (2034) USD 750 billion
Projected CAGR (2024 to 2034) 9.5%

Sales Analysis of Electric Light Commercial Vehicles (Historical vs Forecast Outlook)

The net revenue generated from sales of electric light commercial vehicles in 2019 was around USD 173 billion. Sales of electric light commercial vehicles grew at a CAGR of 12% from 2019 to 2023. The value of the market was USD 271.9 billion in 2023.

The reliability and travel range of electric light commercial vehicles or eLCVs improved by continuous developments in battery technology during this period. Companies that used the emerging advancements in battery technology, including higher energy density and quicker charging times, provided customers with competitive and attractive eLCV models.

Attributes Details
Electric Light Commercial Vehicle Market Size (2019) USD 173 billion
Total Market Size (2023) USD 271.9 billion
Overall Market (CAGR 2019 to 2023) 12% CAGR

Key Drivers Supporting the Growth of Electric Light Commercial Vehicles

Logistics services or door-to-door delivery businesses find electric light commercial vehicles to be economically feasible due to their lower running costs, which include frequent halts and maintenance charges. So, EV manufacturers are now trying to draw electric commercial fleet operators and companies looking for efficiency by highlighting cost reductions in their marketing campaigns.

Though this market mostly deals with commercial vehicles, people’s decisions to buy electric vehicles for occasional use have also influenced the market trends to some extent. Manufacturers of electric vehicles can enhance their brand image over the coming decade by emphasizing the advantages of eLCVs to consumers with knowledge of environmental effects and climate change.
Analysis of Top Countries Adopting Electric Light Commercial Vehicles

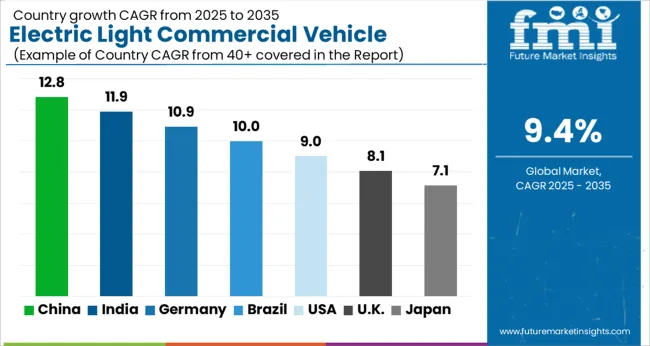
The table below demonstrates the expected growth rates of lucrative markets through 2034.

Countries CAGR (2024 to 2034)
United States 9.8%
Japan 10.9%
United Kingdom 10.7%
South Korea 11.3%
China 9.9%

Technological Advancements Boosting Sales of Electric Vehicles in the United States

Sales of eLCVs in the United States are expected to rise at a 9.8% CAGR from 2024 to 2034.

  • With better infrastructure for rapid establishment and expansion of charging stations or networks, the United States has been one of the pioneering countries in the market.
  • The rising electrification of the commercial sector is driving the adoption of electric light commercial vehicles in the country. Key players are taking advantage of this trend, which is creating opportunities in the market.

China to Witness Higher Demand for Electric Vehicles Due to Favorable Government Policies

The market in China is expected to rise at a 9.9% CAGR from 2024 to 2034.

  • China is one of the leading countries in the electric light commercial vehicle market due to its robust semiconductor and battery construction industries.
  • To encourage the use of electric cars, governments in several countries are putting in place favorable policies, subsidies, and incentives. Such initiatives are expected to boost exports of electric light commercial vehicles in China.
  • Manufacturers are enhancing the appeal and affordability of their vehicles, which is expected to drive the market forward.

Concerns Related to Air Pollution Fueling the United Kingdom Market

The electric light commercial vehicle market in the United Kingdom is expected to advance at a CAGR of 10.7% over the projected period.
  • The rising emphasis on sustainable development is one of the factors driving sales of electric commercial vehicles in the United Kingdom.
  • Increasing concerns about air pollution are also fueling demand for electric vehicles for commercial purposes.

Shifting Preferences of Automotive Manufacturers toward Light Commercial EVs in Japan

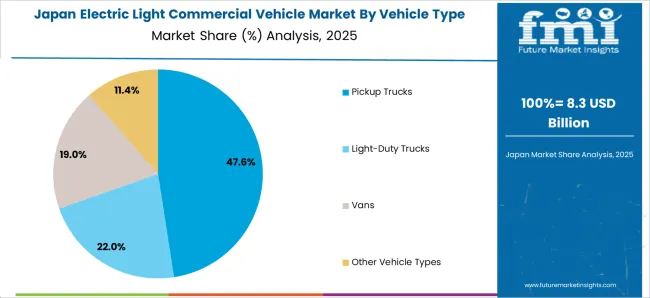
Japan’s electric light commercial vehicles market is expected to expand at a 10.9% CAGR through 2034.

  • Established automotive manufacturers, like Toyota and Suzuki, are entering the EV sector to compete in the market. This is boosting the market demand in Japan.
  • Technological advancements, rising sustainability efforts, and innovative battery solutions are other aspects that are generating growth potential in the market in Japan.

Development and Commercialization of Enhanced EV Technologies in South Korea

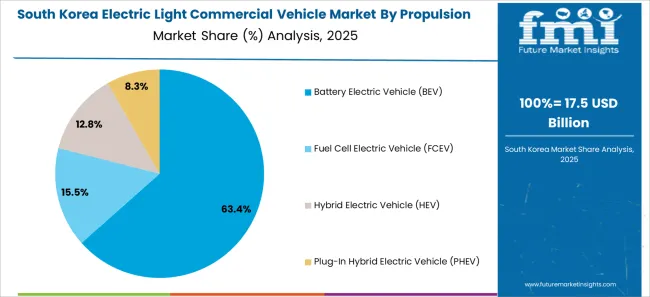
The market in South Korea is likely to rise at a CAGR of 11.3% through 2034.

  • Rising government support and regulations promoting sales of electric vehicles for commercial purposes are driving the market forward.
  • The government’s strong determination to reduce carbon emissions is bolstering the demand for EVs. This is creating opportunities in the country for the development and commercialization of enhanced EV technologies.

Electric Light Commercial Vehicle Industry Analysis by Top Investment Segments

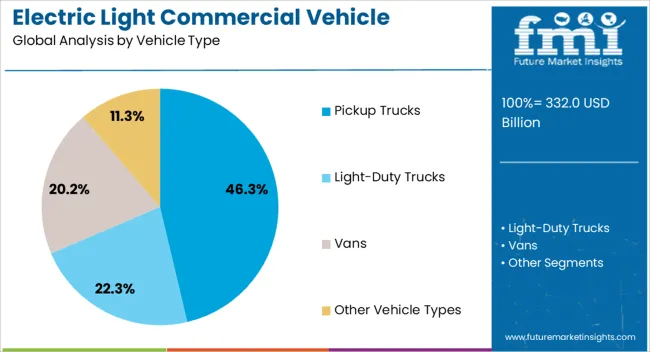
Popularity of Electric Light-duty Trucks over Other Vehicle Types

Based on the vehicle type, electric light-duty trucks are expected to lead the market in 2024. The production and sales of electric light-duty trucks are expected to increase at 9.3% CAGR through 2034.

Attributes Details
Top Vehicle Type Light-duty Trucks
CAGR from 2024 to 2034 9.3%
CAGR from 2019 to 2023 11.8%

Urban delivery businesses are actively looking to improve their operational efficiency. The creation of integrated fleet management systems, including electric light-duty trucks, is economical. This is propelling the segment’s growth.

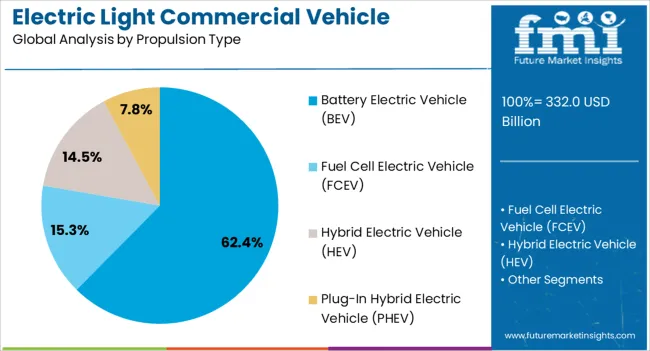
The BEV Segment Dominates the Market Due to its Affordability

Based on the propulsion type, the demand for battery electric vehicles is higher compared to other segments. Sales of BEVs are expected to rise at a CAGR of 9.1% over the projected years.

Attributes Details
Top Propulsion Type BEV
CAGR from 2024 to 2034 9.1%
CAGR from 2019 to 2023 11.6%

Battery electric vehicles (BEVs) have become more appealing by the incorporation of remote control technologies and mobile connection capabilities. This is expected to boost the segment’s growth over the forecast period, owing to the integration of intelligent and networked functionalities.
Competitive Landscape of the Electric Light Commercial Vehicle Market

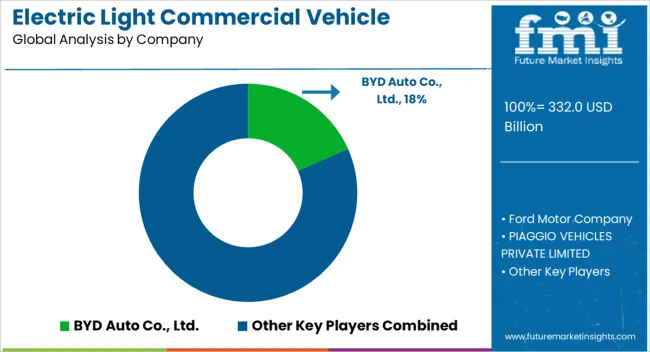
The electric light commercial vehicle market is characterized by the presence of established key players who are focusing on the diversification and modeling eLCVS. The landscape provides enough room for the entry of new players. Startups are focusing on innovation and development to increase their market share. They are emphasizing the development of quicker charging technologies to enhance accessibility, boosting growth in the market.

Recent Developments in the Electric Light Commercial Vehicle Market

  • In September 2022, The FUSO developed the next generation of its electric eCanter light commercial vehicles.
  • In May 2022, General Motors Inc. declared to introduce its new mid-sized electric cargo van, Zevo 400. As per the company inputs, the new electric van has been equipped with ADAS systems to make it suitable for short and frequent trips.

Leading Companies in the Electric Light Commercial Vehicle Industry

  • Bollinger
  • Chevrolet
  • Ford Motor Company
  • Fuso
  • General Motors Inc.

Scope and Coverage of the Electric Light Commercial Vehicle Market Report

Attribute Details
Estimated Market Size (2024) USD 303.2 billion
Projected Market Size (2034) USD 750 billion
Anticipated CAGR (2024 to 2034) 9.5%
Forecast Period 2024 to 2034
Historical Data Available for 2019 to 2023
Market Analysis USD million or billion for Value and Units for Volume
Key Regions Covered North America; Latin America; Europe; Middle East & Africa (MEA); East Asia; South Asia and Oceania
Key Countries Covered United States, Canada, Brazil, Mexico, Germany, Spain, Italy, France, United Kingdom, Russia, China, India, Australia & New Zealand, GCC Countries, and South Africa
Key Segments Covered By Vehicle Type, By Application, By Propulsion Type, By Gross Vehicle Weight (GVW), and By Region
Key Companies Profiled Bollinger; Chevrolet; Ford Motor Company; Fuso
Report Coverage Market Forecast, Company Share Analysis, Competition Intelligence, DROT Analysis, Market Dynamics and Challenges, and Strategic Growth Initiatives
Customization & Pricing Available upon Request

Top Segments Studied in the Electric Light Commercial Vehicle Market

By Vehicle Type:

  • Light-duty Trucks
  • Vans
  • Pickup Trucks
  • Other Vehicle Types

By Propulsion Type:

  • Battery Electric Vehicle (BEV)
  • Fuel Cell Electric Vehicle (FCEV)
  • Hybrid Electric Vehicle (HEV)
  • Plug-in Hybrid Electric Vehicle (PHEV)

By Gross Vehicle Weight (GVW):

  • Below 6,000 lbs
  • 6,000 lbs to 10,000 lbs
  • 10,000 lbs to 14,000 lbs

By Application:

  • Commercial
  • Industrial

By Region:

  • North America
  • Latin America
  • Europe
  • East Asia
  • South Asia and Pacific
  • Middle East and Africa (MEA)

Table of Content

  • 1. Executive Summary
  • 2. Market Overview
  • 3. Market Background
  • 4. Global Market Analysis 2019 to 2023 and Forecast, 2024 to 2034
  • 5. Global Market Analysis 2019 to 2023 and Forecast 2024 to 2034, By Vehicle Type
    • 5.1. Light Commercial Pick-up Trucks
    • 5.2. Light Commercial Vans
  • 6. Global Market Analysis 2019 to 2023 and Forecast 2024 to 2034, By Fuel Type
    • 6.1. BEV
    • 6.2. FCEV
    • 6.3. HEV
    • 6.4. PHEV
  • 7. Global Market Analysis 2019 to 2023 and Forecast 2024 to 2034, By Region
    • 7.1. North America
    • 7.2. Latin America
    • 7.3. Western Europe
    • 7.4. Eastern Europe
    • 7.5. South Asia and Pacific
    • 7.6. East Asia
    • 7.7. Middle East and Africa
  • 8. North America Market Analysis 2019 to 2023 and Forecast 2024 to 2034, By Country
  • 9. Latin America Market Analysis 2019 to 2023 and Forecast 2024 to 2034, By Country
  • 10. Western Europe Market Analysis 2019 to 2023 and Forecast 2024 to 2034, By Country
  • 11. Eastern Europe Market Analysis 2019 to 2023 and Forecast 2024 to 2034, By Country
  • 12. South Asia and Pacific Market Analysis 2019 to 2023 and Forecast 2024 to 2034, By Country
  • 13. East Asia Market Analysis 2019 to 2023 and Forecast 2024 to 2034, By Country
  • 14. Middle East and Africa Market Analysis 2019 to 2023 and Forecast 2024 to 2034, By Country
  • 15. Key Countries Market Analysis
  • 16. Market Structure Analysis
  • 17. Competition Analysis
    • 17.1. BYD Auto Co., Ltd.
    • 17.2. Ford Motor Company
    • 17.3. PIAGGIO VEHICLES PRIVATE LIMITED
    • 17.4. Daimler AG
    • 17.5. The Hyundai Motor Company
    • 17.6. Groupe Renault
    • 17.7. Groupe PSA
    • 17.8. Volkswagen AG
    • 17.9. Mahindra Electric Mobility Limited
    • 17.10. Tata Motors Limited
  • 18. Assumptions & Acronyms Used
  • 19. Research Methodology

List of Tables

Table 1: Global Market Value (US$ Million) Forecast by Region, 2019 to 2034

Table 2: Global Market Volume (Units) Forecast by Region, 2019 to 2034

Table 3: Global Market Value (US$ Million) Forecast by Vehicle Type, 2019 to 2034

Table 4: Global Market Volume (Units) Forecast by Vehicle Type, 2019 to 2034

Table 5: Global Market Value (US$ Million) Forecast by Fuel Type, 2019 to 2034

Table 6: Global Market Volume (Units) Forecast by Fuel Type, 2019 to 2034

Table 7: North America Market Value (US$ Million) Forecast by Country, 2019 to 2034

Table 8: North America Market Volume (Units) Forecast by Country, 2019 to 2034

Table 9: North America Market Value (US$ Million) Forecast by Vehicle Type, 2019 to 2034

Table 10: North America Market Volume (Units) Forecast by Vehicle Type, 2019 to 2034

Table 11: North America Market Value (US$ Million) Forecast by Fuel Type, 2019 to 2034

Table 12: North America Market Volume (Units) Forecast by Fuel Type, 2019 to 2034

Table 13: Latin America Market Value (US$ Million) Forecast by Country, 2019 to 2034

Table 14: Latin America Market Volume (Units) Forecast by Country, 2019 to 2034

Table 15: Latin America Market Value (US$ Million) Forecast by Vehicle Type, 2019 to 2034

Table 16: Latin America Market Volume (Units) Forecast by Vehicle Type, 2019 to 2034

Table 17: Latin America Market Value (US$ Million) Forecast by Fuel Type, 2019 to 2034

Table 18: Latin America Market Volume (Units) Forecast by Fuel Type, 2019 to 2034

Table 19: Western Europe Market Value (US$ Million) Forecast by Country, 2019 to 2034

Table 20: Western Europe Market Volume (Units) Forecast by Country, 2019 to 2034

Table 21: Western Europe Market Value (US$ Million) Forecast by Vehicle Type, 2019 to 2034

Table 22: Western Europe Market Volume (Units) Forecast by Vehicle Type, 2019 to 2034

Table 23: Western Europe Market Value (US$ Million) Forecast by Fuel Type, 2019 to 2034

Table 24: Western Europe Market Volume (Units) Forecast by Fuel Type, 2019 to 2034

Table 25: Eastern Europe Market Value (US$ Million) Forecast by Country, 2019 to 2034

Table 26: Eastern Europe Market Volume (Units) Forecast by Country, 2019 to 2034

Table 27: Eastern Europe Market Value (US$ Million) Forecast by Vehicle Type, 2019 to 2034

Table 28: Eastern Europe Market Volume (Units) Forecast by Vehicle Type, 2019 to 2034

Table 29: Eastern Europe Market Value (US$ Million) Forecast by Fuel Type, 2019 to 2034

Table 30: Eastern Europe Market Volume (Units) Forecast by Fuel Type, 2019 to 2034

Table 31: South Asia and Pacific Market Value (US$ Million) Forecast by Country, 2019 to 2034

Table 32: South Asia and Pacific Market Volume (Units) Forecast by Country, 2019 to 2034

Table 33: South Asia and Pacific Market Value (US$ Million) Forecast by Vehicle Type, 2019 to 2034

Table 34: South Asia and Pacific Market Volume (Units) Forecast by Vehicle Type, 2019 to 2034

Table 35: South Asia and Pacific Market Value (US$ Million) Forecast by Fuel Type, 2019 to 2034

Table 36: South Asia and Pacific Market Volume (Units) Forecast by Fuel Type, 2019 to 2034

Table 37: East Asia Market Value (US$ Million) Forecast by Country, 2019 to 2034

Table 38: East Asia Market Volume (Units) Forecast by Country, 2019 to 2034

Table 39: East Asia Market Value (US$ Million) Forecast by Vehicle Type, 2019 to 2034

Table 40: East Asia Market Volume (Units) Forecast by Vehicle Type, 2019 to 2034

Table 41: East Asia Market Value (US$ Million) Forecast by Fuel Type, 2019 to 2034

Table 42: East Asia Market Volume (Units) Forecast by Fuel Type, 2019 to 2034

Table 43: Middle East and Africa Market Value (US$ Million) Forecast by Country, 2019 to 2034

Table 44: Middle East and Africa Market Volume (Units) Forecast by Country, 2019 to 2034

Table 45: Middle East and Africa Market Value (US$ Million) Forecast by Vehicle Type, 2019 to 2034

Table 46: Middle East and Africa Market Volume (Units) Forecast by Vehicle Type, 2019 to 2034

Table 47: Middle East and Africa Market Value (US$ Million) Forecast by Fuel Type, 2019 to 2034

Table 48: Middle East and Africa Market Volume (Units) Forecast by Fuel Type, 2019 to 2034

List of Figures

Figure 1: Global Market Value (US$ Million) by Vehicle Type, 2024 to 2034

Figure 2: Global Market Value (US$ Million) by Fuel Type, 2024 to 2034

Figure 3: Global Market Value (US$ Million) by Region, 2024 to 2034

Figure 4: Global Market Value (US$ Million) Analysis by Region, 2019 to 2034

Figure 5: Global Market Volume (Units) Analysis by Region, 2019 to 2034

Figure 6: Global Market Value Share (%) and BPS Analysis by Region, 2024 to 2034

Figure 7: Global Market Y-o-Y Growth (%) Projections by Region, 2024 to 2034

Figure 8: Global Market Value (US$ Million) Analysis by Vehicle Type, 2019 to 2034

Figure 9: Global Market Volume (Units) Analysis by Vehicle Type, 2019 to 2034

Figure 10: Global Market Value Share (%) and BPS Analysis by Vehicle Type, 2024 to 2034

Figure 11: Global Market Y-o-Y Growth (%) Projections by Vehicle Type, 2024 to 2034

Figure 12: Global Market Value (US$ Million) Analysis by Fuel Type, 2019 to 2034

Figure 13: Global Market Volume (Units) Analysis by Fuel Type, 2019 to 2034

Figure 14: Global Market Value Share (%) and BPS Analysis by Fuel Type, 2024 to 2034

Figure 15: Global Market Y-o-Y Growth (%) Projections by Fuel Type, 2024 to 2034

Figure 16: Global Market Attractiveness by Vehicle Type, 2024 to 2034

Figure 17: Global Market Attractiveness by Fuel Type, 2024 to 2034

Figure 18: Global Market Attractiveness by Region, 2024 to 2034

Figure 19: North America Market Value (US$ Million) by Vehicle Type, 2024 to 2034

Figure 20: North America Market Value (US$ Million) by Fuel Type, 2024 to 2034

Figure 21: North America Market Value (US$ Million) by Country, 2024 to 2034

Figure 22: North America Market Value (US$ Million) Analysis by Country, 2019 to 2034

Figure 23: North America Market Volume (Units) Analysis by Country, 2019 to 2034

Figure 24: North America Market Value Share (%) and BPS Analysis by Country, 2024 to 2034

Figure 25: North America Market Y-o-Y Growth (%) Projections by Country, 2024 to 2034

Figure 26: North America Market Value (US$ Million) Analysis by Vehicle Type, 2019 to 2034

Figure 27: North America Market Volume (Units) Analysis by Vehicle Type, 2019 to 2034

Figure 28: North America Market Value Share (%) and BPS Analysis by Vehicle Type, 2024 to 2034

Figure 29: North America Market Y-o-Y Growth (%) Projections by Vehicle Type, 2024 to 2034

Figure 30: North America Market Value (US$ Million) Analysis by Fuel Type, 2019 to 2034

Figure 31: North America Market Volume (Units) Analysis by Fuel Type, 2019 to 2034

Figure 32: North America Market Value Share (%) and BPS Analysis by Fuel Type, 2024 to 2034

Figure 33: North America Market Y-o-Y Growth (%) Projections by Fuel Type, 2024 to 2034

Figure 34: North America Market Attractiveness by Vehicle Type, 2024 to 2034

Figure 35: North America Market Attractiveness by Fuel Type, 2024 to 2034

Figure 36: North America Market Attractiveness by Country, 2024 to 2034

Figure 37: Latin America Market Value (US$ Million) by Vehicle Type, 2024 to 2034

Figure 38: Latin America Market Value (US$ Million) by Fuel Type, 2024 to 2034

Figure 39: Latin America Market Value (US$ Million) by Country, 2024 to 2034

Figure 40: Latin America Market Value (US$ Million) Analysis by Country, 2019 to 2034

Figure 41: Latin America Market Volume (Units) Analysis by Country, 2019 to 2034

Figure 42: Latin America Market Value Share (%) and BPS Analysis by Country, 2024 to 2034

Figure 43: Latin America Market Y-o-Y Growth (%) Projections by Country, 2024 to 2034

Figure 44: Latin America Market Value (US$ Million) Analysis by Vehicle Type, 2019 to 2034

Figure 45: Latin America Market Volume (Units) Analysis by Vehicle Type, 2019 to 2034

Figure 46: Latin America Market Value Share (%) and BPS Analysis by Vehicle Type, 2024 to 2034

Figure 47: Latin America Market Y-o-Y Growth (%) Projections by Vehicle Type, 2024 to 2034

Figure 48: Latin America Market Value (US$ Million) Analysis by Fuel Type, 2019 to 2034

Figure 49: Latin America Market Volume (Units) Analysis by Fuel Type, 2019 to 2034

Figure 50: Latin America Market Value Share (%) and BPS Analysis by Fuel Type, 2024 to 2034

Figure 51: Latin America Market Y-o-Y Growth (%) Projections by Fuel Type, 2024 to 2034

Figure 52: Latin America Market Attractiveness by Vehicle Type, 2024 to 2034

Figure 53: Latin America Market Attractiveness by Fuel Type, 2024 to 2034

Figure 54: Latin America Market Attractiveness by Country, 2024 to 2034

Figure 55: Western Europe Market Value (US$ Million) by Vehicle Type, 2024 to 2034

Figure 56: Western Europe Market Value (US$ Million) by Fuel Type, 2024 to 2034

Figure 57: Western Europe Market Value (US$ Million) by Country, 2024 to 2034

Figure 58: Western Europe Market Value (US$ Million) Analysis by Country, 2019 to 2034

Figure 59: Western Europe Market Volume (Units) Analysis by Country, 2019 to 2034

Figure 60: Western Europe Market Value Share (%) and BPS Analysis by Country, 2024 to 2034

Figure 61: Western Europe Market Y-o-Y Growth (%) Projections by Country, 2024 to 2034

Figure 62: Western Europe Market Value (US$ Million) Analysis by Vehicle Type, 2019 to 2034

Figure 63: Western Europe Market Volume (Units) Analysis by Vehicle Type, 2019 to 2034

Figure 64: Western Europe Market Value Share (%) and BPS Analysis by Vehicle Type, 2024 to 2034

Figure 65: Western Europe Market Y-o-Y Growth (%) Projections by Vehicle Type, 2024 to 2034

Figure 66: Western Europe Market Value (US$ Million) Analysis by Fuel Type, 2019 to 2034

Figure 67: Western Europe Market Volume (Units) Analysis by Fuel Type, 2019 to 2034

Figure 68: Western Europe Market Value Share (%) and BPS Analysis by Fuel Type, 2024 to 2034

Figure 69: Western Europe Market Y-o-Y Growth (%) Projections by Fuel Type, 2024 to 2034

Figure 70: Western Europe Market Attractiveness by Vehicle Type, 2024 to 2034

Figure 71: Western Europe Market Attractiveness by Fuel Type, 2024 to 2034

Figure 72: Western Europe Market Attractiveness by Country, 2024 to 2034

Figure 73: Eastern Europe Market Value (US$ Million) by Vehicle Type, 2024 to 2034

Figure 74: Eastern Europe Market Value (US$ Million) by Fuel Type, 2024 to 2034

Figure 75: Eastern Europe Market Value (US$ Million) by Country, 2024 to 2034

Figure 76: Eastern Europe Market Value (US$ Million) Analysis by Country, 2019 to 2034

Figure 77: Eastern Europe Market Volume (Units) Analysis by Country, 2019 to 2034

Figure 78: Eastern Europe Market Value Share (%) and BPS Analysis by Country, 2024 to 2034

Figure 79: Eastern Europe Market Y-o-Y Growth (%) Projections by Country, 2024 to 2034

Figure 80: Eastern Europe Market Value (US$ Million) Analysis by Vehicle Type, 2019 to 2034

Figure 81: Eastern Europe Market Volume (Units) Analysis by Vehicle Type, 2019 to 2034

Figure 82: Eastern Europe Market Value Share (%) and BPS Analysis by Vehicle Type, 2024 to 2034

Figure 83: Eastern Europe Market Y-o-Y Growth (%) Projections by Vehicle Type, 2024 to 2034

Figure 84: Eastern Europe Market Value (US$ Million) Analysis by Fuel Type, 2019 to 2034

Figure 85: Eastern Europe Market Volume (Units) Analysis by Fuel Type, 2019 to 2034

Figure 86: Eastern Europe Market Value Share (%) and BPS Analysis by Fuel Type, 2024 to 2034

Figure 87: Eastern Europe Market Y-o-Y Growth (%) Projections by Fuel Type, 2024 to 2034

Figure 88: Eastern Europe Market Attractiveness by Vehicle Type, 2024 to 2034

Figure 89: Eastern Europe Market Attractiveness by Fuel Type, 2024 to 2034

Figure 90: Eastern Europe Market Attractiveness by Country, 2024 to 2034

Figure 91: South Asia and Pacific Market Value (US$ Million) by Vehicle Type, 2024 to 2034

Figure 92: South Asia and Pacific Market Value (US$ Million) by Fuel Type, 2024 to 2034

Figure 93: South Asia and Pacific Market Value (US$ Million) by Country, 2024 to 2034

Figure 94: South Asia and Pacific Market Value (US$ Million) Analysis by Country, 2019 to 2034

Figure 95: South Asia and Pacific Market Volume (Units) Analysis by Country, 2019 to 2034

Figure 96: South Asia and Pacific Market Value Share (%) and BPS Analysis by Country, 2024 to 2034

Figure 97: South Asia and Pacific Market Y-o-Y Growth (%) Projections by Country, 2024 to 2034

Figure 98: South Asia and Pacific Market Value (US$ Million) Analysis by Vehicle Type, 2019 to 2034

Figure 99: South Asia and Pacific Market Volume (Units) Analysis by Vehicle Type, 2019 to 2034

Figure 100: South Asia and Pacific Market Value Share (%) and BPS Analysis by Vehicle Type, 2024 to 2034

Figure 101: South Asia and Pacific Market Y-o-Y Growth (%) Projections by Vehicle Type, 2024 to 2034

Figure 102: South Asia and Pacific Market Value (US$ Million) Analysis by Fuel Type, 2019 to 2034

Figure 103: South Asia and Pacific Market Volume (Units) Analysis by Fuel Type, 2019 to 2034

Figure 104: South Asia and Pacific Market Value Share (%) and BPS Analysis by Fuel Type, 2024 to 2034

Figure 105: South Asia and Pacific Market Y-o-Y Growth (%) Projections by Fuel Type, 2024 to 2034

Figure 106: South Asia and Pacific Market Attractiveness by Vehicle Type, 2024 to 2034

Figure 107: South Asia and Pacific Market Attractiveness by Fuel Type, 2024 to 2034

Figure 108: South Asia and Pacific Market Attractiveness by Country, 2024 to 2034

Figure 109: East Asia Market Value (US$ Million) by Vehicle Type, 2024 to 2034

Figure 110: East Asia Market Value (US$ Million) by Fuel Type, 2024 to 2034

Figure 111: East Asia Market Value (US$ Million) by Country, 2024 to 2034

Figure 112: East Asia Market Value (US$ Million) Analysis by Country, 2019 to 2034

Figure 113: East Asia Market Volume (Units) Analysis by Country, 2019 to 2034

Figure 114: East Asia Market Value Share (%) and BPS Analysis by Country, 2024 to 2034

Figure 115: East Asia Market Y-o-Y Growth (%) Projections by Country, 2024 to 2034

Figure 116: East Asia Market Value (US$ Million) Analysis by Vehicle Type, 2019 to 2034

Figure 117: East Asia Market Volume (Units) Analysis by Vehicle Type, 2019 to 2034

Figure 118: East Asia Market Value Share (%) and BPS Analysis by Vehicle Type, 2024 to 2034

Figure 119: East Asia Market Y-o-Y Growth (%) Projections by Vehicle Type, 2024 to 2034

Figure 120: East Asia Market Value (US$ Million) Analysis by Fuel Type, 2019 to 2034

Figure 121: East Asia Market Volume (Units) Analysis by Fuel Type, 2019 to 2034

Figure 122: East Asia Market Value Share (%) and BPS Analysis by Fuel Type, 2024 to 2034

Figure 123: East Asia Market Y-o-Y Growth (%) Projections by Fuel Type, 2024 to 2034

Figure 124: East Asia Market Attractiveness by Vehicle Type, 2024 to 2034

Figure 125: East Asia Market Attractiveness by Fuel Type, 2024 to 2034

Figure 126: East Asia Market Attractiveness by Country, 2024 to 2034

Figure 127: Middle East and Africa Market Value (US$ Million) by Vehicle Type, 2024 to 2034

Figure 128: Middle East and Africa Market Value (US$ Million) by Fuel Type, 2024 to 2034

Figure 129: Middle East and Africa Market Value (US$ Million) by Country, 2024 to 2034

Figure 130: Middle East and Africa Market Value (US$ Million) Analysis by Country, 2019 to 2034

Figure 131: Middle East and Africa Market Volume (Units) Analysis by Country, 2019 to 2034

Figure 132: Middle East and Africa Market Value Share (%) and BPS Analysis by Country, 2024 to 2034

Figure 133: Middle East and Africa Market Y-o-Y Growth (%) Projections by Country, 2024 to 2034

Figure 134: Middle East and Africa Market Value (US$ Million) Analysis by Vehicle Type, 2019 to 2034

Figure 135: Middle East and Africa Market Volume (Units) Analysis by Vehicle Type, 2019 to 2034

Figure 136: Middle East and Africa Market Value Share (%) and BPS Analysis by Vehicle Type, 2024 to 2034

Figure 137: Middle East and Africa Market Y-o-Y Growth (%) Projections by Vehicle Type, 2024 to 2034

Figure 138: Middle East and Africa Market Value (US$ Million) Analysis by Fuel Type, 2019 to 2034

Figure 139: Middle East and Africa Market Volume (Units) Analysis by Fuel Type, 2019 to 2034

Figure 140: Middle East and Africa Market Value Share (%) and BPS Analysis by Fuel Type, 2024 to 2034

Figure 141: Middle East and Africa Market Y-o-Y Growth (%) Projections by Fuel Type, 2024 to 2034

Figure 142: Middle East and Africa Market Attractiveness by Vehicle Type, 2024 to 2034

Figure 143: Middle East and Africa Market Attractiveness by Fuel Type, 2024 to 2034

Figure 144: Middle East and Africa Market Attractiveness by Country, 2024 to 2034

Frequently Asked Questions

What is the Projected Growth of the Electric Light Commercial Vehicle Market?

The electric light commercial vehicle market is set to expand at a CAGR of 9.5% during the forecast period.

What is the Expected Valuation of the Electric Light Commercial Vehicle Market by 2033?

The electric light commercial vehicle market is predicted to be valued at USD 750 billion by 2034.

What was the Historical Size of the Electric Light Commercial Vehicle Market?

The global electric light commercial vehicle market was valued at USD 271.9 billion in 2023.

Which Country is the Dominant Share Holder of the Market?

The United States is expected to account for nearly 18% of the electric light commercial vehicle market by 2034.

Which Country is Projected to Grow at a Higher CAGR in the Market?

The market in South Korea is predicted to witness an 11.3% CAGR through 2034.

Explore Similar Insights

Future Market Insights

Electric Light Commercial Vehicle Market