Enzyme Protectants Market Size and Share Forecast Outlook 2025 to 2035

The enzyme protectants market is expected to record a valuation of USD 820.5 million in 2025 and reach USD 1,511.5 million by 2035, reflecting an increase of nearly USD 691 million over the decade. This expansion represents a 6.3% CAGR and signals a significant rise in the demand for solutions that safeguard enzyme stability and extend performance in industrial, pharmaceutical, and research-driven environments.
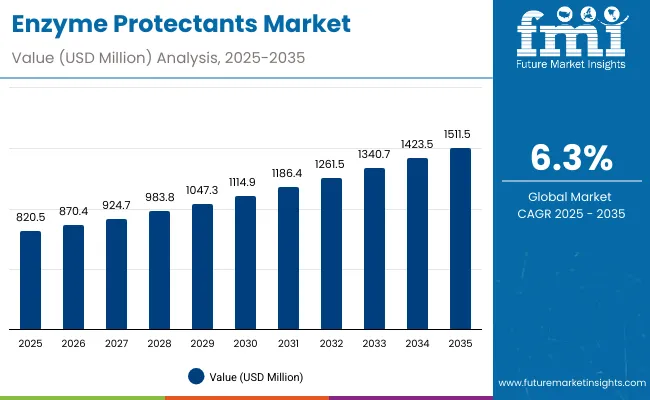
Enzyme Protectants Market 1

Quick Stats for Enzyme Protectants Market

  • Enzyme Protectants Market Value (2025): USD 820.0 million
  • Enzyme Protectants Market Forecast Value (2035): USD 1,511.5 million
  • Enzyme Protectants Forecast CAGR: 6.3%
  • Leading Segment in Enzyme Protectants in 2025, by Product Type: Stabilizers (33.6%)
  • Key Growth Regions in the Enzyme Protectants: North America, Asia-Pacific, Europe
  • Top Key Players in Enzyme Protectants: BASF SE, Evonik Industries AG, Merck KGaA (Millipore Sigma), Croda International Plc, Roquette Frères, Kerry Group plc, DSM-Firmenich AG, Ingredion Incorporated, Nagase & Co., Ltd., Lonza Group AG.

Enzyme Protectants Market Key Takeaways
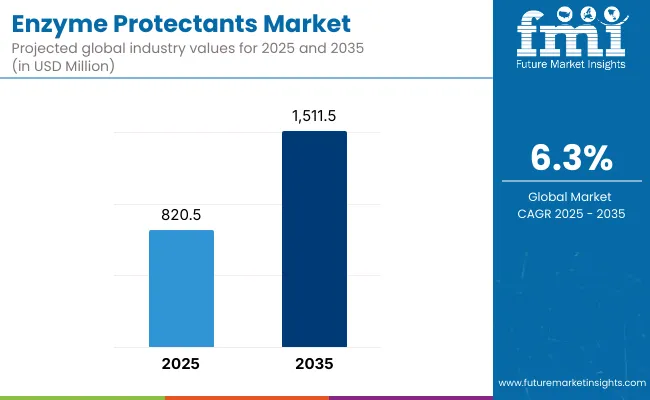
Enzyme Protectants Market

Metric Value
Enzyme Protectants Estimated Value in (2025E) USD 820.0 million
Enzyme Protectants Forecast Value in (2035F) USD 1,511.5 million
Forecast CAGR (2025 to 2035) 6.3%

During the first five-year phase from 2025 to 2030, the market is projected to grow from USD 820.5 million to approximately USD 1,114.9 million, adding close to USD 294 million, which accounts for around 43% of total decade growth. This steady progression will be underpinned by broader adoption of enzymes in biologics, food biotechnology, and diagnostic formulations, where stability requirements remain critical for commercial success. Strategic investments in encapsulation and protective coatings are anticipated to strengthen market positioning in this period.

The second phase from 2030 to 2035 is forecast to contribute an additional USD 397 million, accounting for nearly 57% of total growth, as the market accelerates from USD 1,114.9 million to 1,511.5 million. This momentum is likely to be reinforced by the integration of enzymes into precision fermentation, synthetic biology, and advanced bioprocessing, where optimized protectants will be indispensable for functionality. As adoption deepens across emerging economies, competitive advantage is expected to hinge on application-specific innovation and sustainable sourcing frameworks.

From 2020 to 2024, the Enzyme Protectants Market expanded steadily, driven by demand from pharmaceuticals, food and beverage, and industrial biotechnology. During this period, leading global chemical and life science companies consolidated their positions, with stabilizers and polymers holding dominant shares. Competitive differentiation was based on performance reliability, formulation flexibility, and regulatory compliance. Service-led models had minimal traction, as most revenue was concentrated in product categories.

By 2025, the market is expected to expand to USD 820.5 million, with adoption reinforced by biologics, diagnostics, and functional food innovation. Over the decade, the revenue mix is projected to shift toward bio-based and encapsulated protectants, creating opportunities for innovators offering sustainable, application-specific solutions. Competitive advantage will increasingly be defined by integrated innovation ecosystems, sustainability credentials, and end-use partnerships across pharmaceuticals and biotechnology.

Why the Enzyme Protectants Market is growing?

Growth in the enzyme protectants market is being driven by the rising reliance on enzymes as critical biocatalysts across pharmaceuticals, food systems, diagnostics, and industrial biotechnology. Increasing demand for stability under variable storage and processing conditions has created the need for advanced protectants that can safeguard enzymatic activity and extend functional lifespan. As biologics and precision fermentation technologies gain momentum, higher sensitivity of enzyme formulations has reinforced the necessity for specialized protective agents.

Advances in encapsulation, coating systems, and stabilization techniques are being adopted to enhance enzyme resilience in harsh processing environments. Regulatory emphasis on product consistency and quality in pharmaceuticals and food sectors has further supported adoption. Sustainability goals are also being addressed through natural and bio-based protectants, which are projected to gain wider acceptance as industries reduce reliance on synthetic inputs.

Industrial biotechnology and agricultural formulations are expected to expand demand, as enzymes increasingly replace traditional chemical catalysts in bio-based processes. Research institutions and diagnostic laboratories are also reinforcing uptake, as enzyme protectants enable reproducibility and accuracy in sensitive assays. The market is thus expected to grow on the back of technological innovation, regulatory alignment, and cross-sector integration of enzymes into high-value applications.

Segmental Analysis

The enzyme protectants market has been segmented across product type, source, formulation, end-use application, and region to provide a comprehensive understanding of future growth opportunities. Product type segmentation highlights the diversity of stabilizers, protective polymers, antioxidants, chelating agents, preservatives, and other novel protectants designed to enhance enzyme stability. By source, the market is differentiated between synthetic protectants and natural or bio-based protectants, reflecting a balance between performance-driven innovation and sustainability-focused adoption. In terms of end-use applications, pharmaceuticals and biologics, food and beverage, industrial biotechnology, diagnostics and research, and agricultural formulations represent the primary demand centers, each with unique drivers of adoption. Regional segmentation spans North America, Europe, Asia-Pacific, Latin America, and the Middle East & Africa, where differing innovation ecosystems, regulatory frameworks, and industrial strengths shape distinct growth pathways. The combination of these segmental perspectives highlights the multi-dimensional expansion trajectory of enzyme protectants over the coming decade.
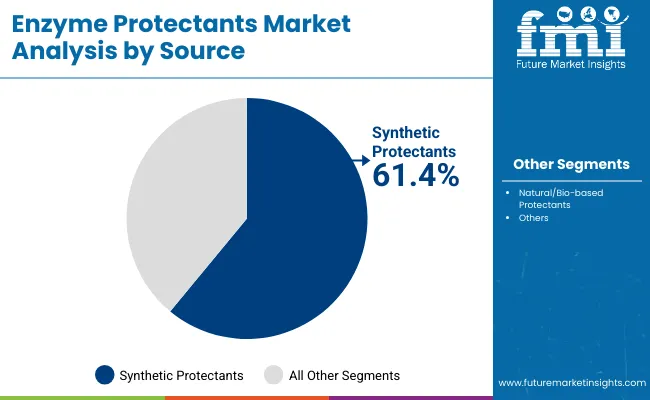
Insights into the Source Segment with Synthetic Protectants leading in Market Share

Enzyme Protectants Market By Source

Source Segment Market Value Share, 2025
Synthetic Protectants 61.4%
Natural/Bio-based Protectants 38.6%

Stabilizers are projected to lead the enzyme protectants market with a 33.6% share in 2025, supported by their critical role in preserving enzyme activity under storage and processing stress. Their adoption is being reinforced by widespread use across pharmaceuticals, food, and diagnostics, where maintaining enzymatic integrity is essential. Growth will be steady, with increasing focus on amino acid and sugar-based systems that offer cost-effectiveness and scalability. While stabilizers dominate, rapid advancements are expected in smaller categories such as other protectants and preservatives, which are recording higher CAGRs and addressing niche applications. Over the decade, a shift toward more specialized protectants is anticipated, but stabilizers are expected to retain their dominant role as a backbone solution across industries.
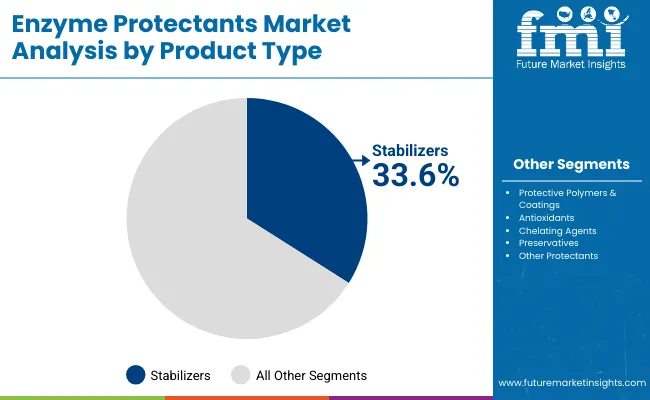
Insights into the Product Type Segment with Stabilizers Dominating the Demand

Enzyme Protectants Market By Product Type

Product Type 2025 Share%
Stabilizers 33.6%
Protective Polymers & Coatings 22.7%
Antioxidants 16.8%

Synthetic protectants are projected to command 61.4% of the enzyme protectants market in 2025, supported by their proven reliability, scalability, and compatibility with diverse industrial and pharmaceutical applications. Their ability to deliver consistent performance under rigorous conditions has positioned them as the preferred choice for large-scale production environments. Over the forecast period, innovation in chemical formulations is expected to extend their utility in biopharma and industrial biotechnology. However, demand for natural and bio-based protectants is rising steadily, driven by sustainability imperatives, consumer preference for clean-label solutions, and regulatory incentives. This segment, while smaller, is poised to expand as plant-derived and fermentation-based protectants gain credibility through improved performance. Although synthetic protectants will remain dominant, the decade ahead is expected to see a gradual rebalancing as bio-based alternatives strengthen their role in environmentally aligned innovation strategies.
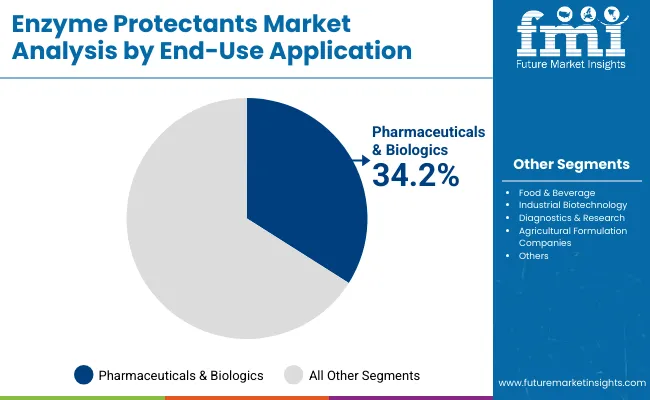
Insights into the End-Use Application Segment with Focus on Pharmaceuticals & Biologics

Enzyme Protectants Market By End Use Application

End-Use Application 2025 Share%
Pharmaceuticals & Biologics 34.2%
Food & Beverage 26.2%
Industrial Biotechnology 18.9%

Pharmaceuticals and biologics are expected to remain the largest end-use application, holding 34.2% of market share in 2025. Growth will be reinforced by rising adoption of biologics, precision fermentation, and advanced drug formulations where enzymes are increasingly embedded. Protectants are being relied upon to ensure structural stability and functional consistency of enzymes in highly sensitive therapeutic and diagnostic contexts. The pharmaceutical sector’s stringent quality and regulatory requirements have positioned protectants as indispensable. Meanwhile, diagnostics and research applications are projected to record faster growth, supported by demand for reproducibility in assays and next-generation molecular tools. Food and beverage applications will also see robust uptake as consumers demand enhanced nutritional value and clean-label processing. Collectively, end-use adoption is being shaped by both clinical imperatives and consumer-driven innovation.

What are the Drivers, Restraints, and Key Trends of the Enzyme Protectants Market?

Adoption of enzyme protectants is being accelerated by the need for stability in biologics, diagnostics, and industrial bioprocesses, even as cost challenges and performance variability persist. The market is being shaped by scientific innovation and sustainability imperatives, with drivers rooted in expanding enzyme applications and trends defined by the integration of advanced protective technologies into biomanufacturing systems.

Rising Dependence on Biologics and Precision Fermentation

Market growth is being driven by the rapid expansion of biologics and precision fermentation, which demand consistent enzyme activity across sensitive production environments. Enzyme protectants are increasingly being relied upon to preserve structural integrity during manufacturing and storage, particularly for therapeutic proteins and specialty ingredients. Pharmaceutical and food sectors are accelerating adoption as stability directly impacts efficacy and shelf life. With the biopharma pipeline expanding and fermentation-derived products gaining scale, protectants are expected to transition from optional additives to critical enablers of product reliability. This shift is projected to solidify protectants as indispensable components in future biomanufacturing strategies.

Shift toward Natural and Bio-Based Protectants

A key trend shaping the market is the transition toward natural and bio-based protectants, driven by sustainability commitments and regulatory encouragement. Plant-derived stabilizers and fermentation-based systems are increasingly being explored to replace synthetic formulations while maintaining comparable performance. Consumer preference for clean-label solutions in food and healthcare products is reinforcing this trend. Companies are investing in R&D partnerships to optimize bio-based protectants that align with both environmental and functional criteria. While synthetic options will continue to dominate due to scalability, the decade ahead is expected to witness a progressive rebalancing, with natural solutions carving a stronger foothold in high-value applications.
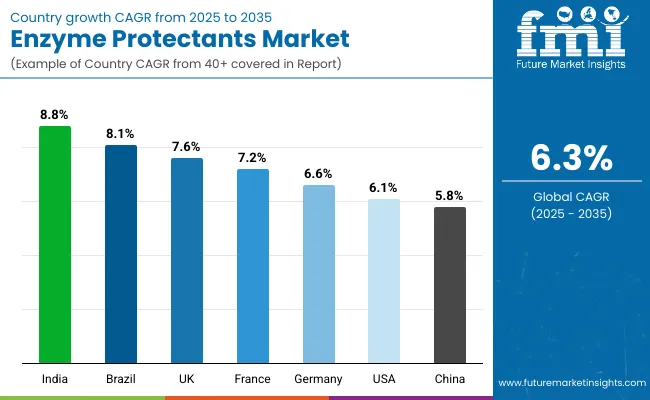
Analysis of Enzyme Protectants Market by Key Countries

Country Wise Enzyme Protectants Market

Countries CAGR (2025 to 2035)
China 5.8%
India 8.8%
Germany 6.6%
France 7.2%
UK 7.6%
USA 6.1%
Brazil 8.1%

The global enzyme protectants market is projected to display varied growth trajectories across leading countries, reflecting differences in biopharmaceutical strength, industrial biotechnology maturity, and regulatory frameworks. In Asia-Pacific, China is anticipated to expand at a CAGR of 5.8%, supported by large-scale biologics manufacturing and government-backed investment in synthetic biology. India, with the fastest growth at 8.8%, is expected to advance rapidly as enzyme applications gain traction in pharmaceuticals, food processing, and agricultural formulations, reinforced by expanding domestic biotech capacity and export-oriented production models.

In Europe, the United Kingdom (7.6%) and France (7.2%) are predicted to outpace Germany (6.6%), benefiting from supportive R&D ecosystems and regulatory clarity around biologics and enzyme-enabled food technologies. Germany will remain a pivotal hub for industrial biotechnology, but growth will be moderated by a more mature adoption base.

North America is expected to record steady expansion, with the United States growing at 6.1%, driven by advanced biologics pipelines, rising adoption of diagnostics, and strong research investment, although market maturity tempers acceleration.

Latin America, led by Brazil at 8.1%, is forecast to deliver robust momentum, as agricultural biotechnology and enzyme-stabilized formulations gain wider acceptance. This distribution highlights a decade in which emerging markets drive acceleration while established hubs consolidate leadership through innovation and compliance alignment.
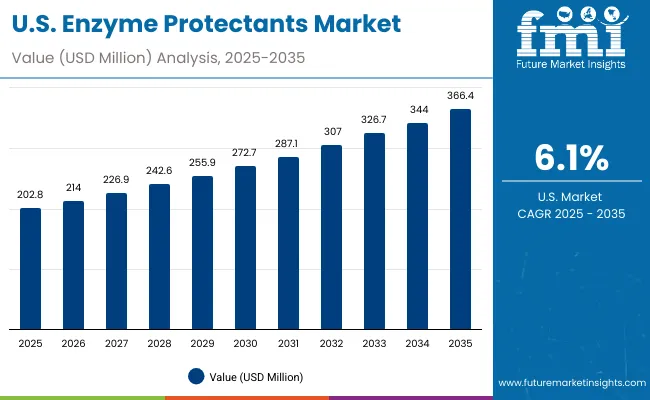
Sales Outlook for Enzyme Protectants in the United States

Usa Enzyme Protectants Market

Year USA Enzyme Protectants Market (USD Million)
2025 202.8
2026 214.0
2027 226.9
2028 242.6
2029 255.9
2030 272.7
2031 287.1
2032 307.0
2033 326.7
2034 344.0
2035 366.4

The enzyme protectants market in the United States is projected to expand from USD 202.8 million in 2025 to USD 366.4 million in 2035, advancing at a CAGR of approximately 6.1%. Growth is expected to be supported by the deepening penetration of biologics, where enzyme stability is critical for therapeutic reliability. Adoption is being reinforced by diagnostics and research institutions, which rely on consistent enzyme performance in high-sensitivity assays.

Food and beverage applications are anticipated to strengthen demand, particularly as clean-label formulations gain traction and stability-enhancing protectants are integrated into functional product development. Industrial biotechnology is also being positioned as a growth engine, where enzyme protectants will play a key role in scaling bio-based production.

Collaborative research partnerships between academic institutes and biopharma players are predicted to accelerate innovation, while sustainability mandates are likely to encourage gradual adoption of bio-based protectants alongside synthetic solutions.

  • Biologics manufacturing and diagnostics adoption are reinforcing market stability needs.
  • Clean-label food and beverage innovation is creating new opportunities for protectant integration.

Growth and Expansion Outlook for Enzyme Protectants Market in the United Kingdom

The enzyme protectants market in the United Kingdom is projected to expand steadily, supported by the country’s strong pharmaceutical and biotechnology ecosystem. With growth expected at a CAGR of 7.6%, demand will be reinforced by biologics development hubs clustered around Cambridge and Oxford, where advanced protein engineering and precision fermentation are being integrated into pipelines. Food and beverage adoption is also predicted to rise, as UK manufacturers align with clean-label standards and functional formulations.

Diagnostic and research institutions are projected to create incremental demand, with increased reliance on enzyme-stabilized assays. As sustainability frameworks intensify, gradual integration of bio-based protectants is anticipated alongside established synthetic solutions.

  • Clean-label food and beverage formulations are opening new opportunities.
  • Diagnostics adoption is strengthening market growth.
  • Sustainability initiatives are supporting bio-based adoption.

Growth and Expansion Outlook for Enzyme Protectants in China

The enzyme protectants market in China is projected to expand at a CAGR of 5.8%, reflecting both its vast biopharma base and rapid industrial biotechnology adoption. Government-backed investments in synthetic biology and large-scale fermentation are expected to reinforce demand for enzyme stability solutions. Food and beverage sectors will continue to integrate protectants into functional and fortified products to serve domestic and export markets. Diagnostics and research institutions are projected to increase uptake, supported by regulatory emphasis on quality and reproducibility in biotechnology. While synthetic protectants will dominate, gradual interest in bio-based alternatives is likely as sustainability mandates strengthen.

  • Government investment in synthetic biology is supporting adoption.
  • Functional food and beverage demand is reinforcing protectant use.
  • Diagnostics and R&D adoption is rising under quality frameworks.
  • Bio-based protectants are gaining attention under sustainability goals.

Sales Outlook for Enzyme Protectants in India

The enzyme protectants market in India is forecast to record the fastest growth among key countries, expanding at a CAGR of 8.8% from 2025 to 2035. This trajectory is being supported by the rapid expansion of pharmaceutical manufacturing, where stability of enzyme formulations is vital for biologics and generic drug development. The food processing sector is also contributing, with adoption being encouraged by the rising consumer demand for fortified and functional products.

Agricultural biotechnology is expected to emerge as a growth frontier, as protectants are increasingly utilized to ensure enzyme performance in bio-based agro formulations. India’s cost-competitive manufacturing base and export orientation are reinforcing its role as a future hub for global enzyme protectant demand.
  • Pharmaceutical and biologics expansion is driving adoption.
  • Food processing growth is creating clean-label opportunities.
  • Agricultural biotechnology is opening niche application areas.
  • Export-oriented production is strengthening India’s market rol.

In-depth Analysis of Enzyme Protectants in Germany

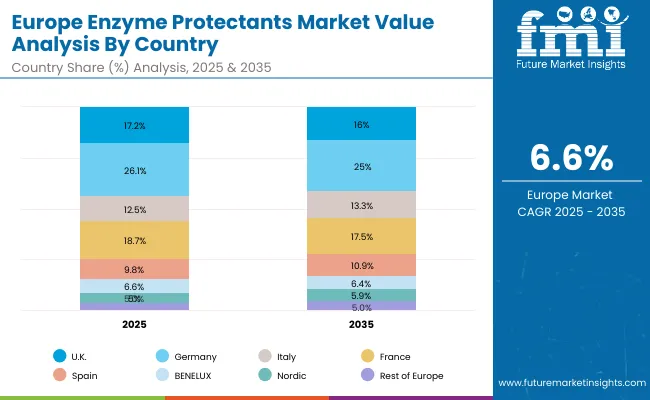
Europe Enzyme Protectants Market

Countries 2025
UK 17.2%
Germany 26.1%
Italy 12.5%
France 18.7%
Spain 9.8%
BENELUX 6.6%
Nordic 5.0%
Rest of Europe 4.1%
Countries 2035
UK 16.0%
Germany 25.0%
Italy 13.3%
France 17.5%
Spain 10.9%
BENELUX 6.4%
Nordic 5.9%
Rest of Europe 5.0%

The enzyme protectants market in Germany is projected to expand at a CAGR of 6.6%, anchored by its leadership in industrial biotechnology and pharmaceutical innovation. Demand is being reinforced by the country’s strong biologics pipeline and precision manufacturing standards, where enzyme stability is critical for compliance and performance. The food and beverage sector is also contributing, with adoption focused on functional foods and high-quality ingredients.

Diagnostic laboratories and research institutions are anticipated to sustain demand growth, as reproducibility in enzymatic assays remains central to Germany’s advanced R&D ecosystem. Sustainability policies are expected to accelerate interest in bio-based protectants, though synthetic solutions will remain dominant.Pharma and biotech sectors are strengthening biologics integration.
  • Industrial biotechnology and biologics pipelines are driving demand.
  • Functional food and beverage adoption is expanding protectant use.
  • Diagnostics R&D is strengthening reliance on protectants.
  • Sustainability mandates are encouraging bio-based exploration.

Growth Outlook for Enzyme Protectants in Japan

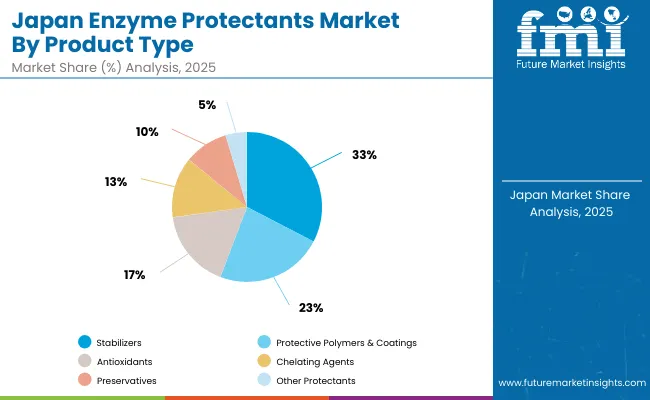
Japan Enzyme Protectants Market

Product Type Market Value Share, 2025
Stabilizers (polyols, sugars, amino acids, trehalose, glycerol) 32.6%
Protective Polymers & Coatings (PEGylation agents, encapsulation materials, biopolymers) 23.2%
Antioxidants (ascorbic acid, tocopherols, glutathione) 17.0%
Chelating Agents (EDTA, citrates, phosphates) 13.1%
Preservatives (sodium benzoate, potassium sorbate, parabens) 9.5%
Other Protectants (protease inhibitors, surfactants, novel excipients) 4.6%

The enzyme protectants market in Japan is projected to record steady expansion, led by strong biopharmaceutical development, advanced food innovation, and cutting-edge diagnostic applications. Stabilizers are anticipated to maintain leadership at 32.6%, though emerging demand for chelating agents, preservatives, and novel protectants is forecast to deliver faster growth due to rising sensitivity in biologics and functional foods. The increasing adoption of protective polymers and coatings is also being reinforced by Japan’s emphasis on precision manufacturing, where enzyme formulations require high resilience during processing.

A gradual transition is expected toward antioxidants and bio-based alternatives, aligned with regulatory emphasis on safety and sustainability. Advanced encapsulation and coating technologies are predicted to shape competitive differentiation, while academic-industry collaboration will continue to drive innovation in performance-specific protectants.
  • Precision manufacturing and biologics pipelines are reinforcing protectant demand.
  • Japan’s enzyme protectants market is projected to grow at balanced rates across segments.
  • Encapsulation innovation and sustainability imperatives are shaping future adoption.

Opportunity Analysis of South Korea Enzyme Protectants Market

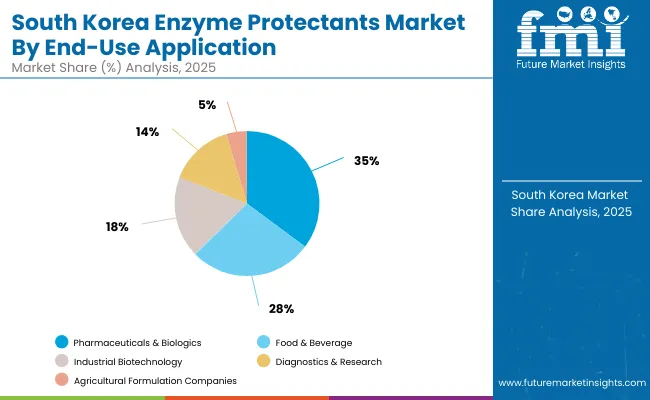
South Korea Enzyme Protectants Market

End-Use Application Market Value Share, 2025
Pharmaceuticals & Biologics 35.2%
Food & Beverage 27.5%
Industrial Biotechnology 18.2%
Diagnostics & Research 14.5%
Agricultural Formulation Companies 4.6%

The enzyme protectants market in South Korea is expected to expand steadily, driven by its strong biopharmaceutical sector, advanced food technology base, and rising diagnostic adoption. Pharmaceuticals and biologics will dominate with a 35.2% share in 2025, underpinned by the country’s robust biologics manufacturing and investment in precision fermentation. Food and beverage applications are also projected to expand, aligned with South Korea’s leadership in functional foods and nutraceutical innovation.

Industrial biotechnology and agricultural formulations are forecast to grow at faster rates, supported by sustainability policies and bio-based manufacturing strategies. Diagnostics and research applications are expected to accelerate, with advanced assays requiring enhanced enzyme stability for reproducibility.
  • Biologics manufacturing leadership is reinforcing adoption at 35.2% share.
  • Functional food innovation is strengthening protectant integration.
  • Diagnostics and research are growing rapidly with advanced assay demand.

Competitive Landscape of Enzyme Protectants Market

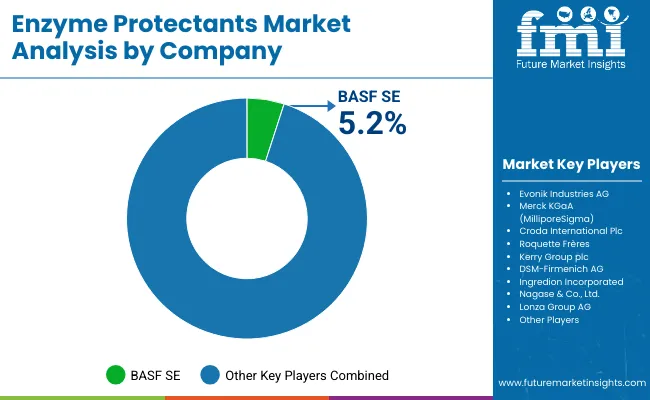
Enzyme Protectants Market By Company

Company Global Value Share 2025
BASF SE 5.2%
Others 94.8%

The enzyme protectants market is moderately fragmented, with global leaders, diversified life sciences companies, and specialized ingredient suppliers competing across pharmaceutical, food, and industrial applications. Multinational giants such as BASF SE, Evonik Industries AG, and Merck KGaA (Millipore Sigma) hold strong positions, supported by advanced formulation capabilities, robust research pipelines, and global distribution networks. Their strategies are increasingly focused on sustainability, regulatory compliance, and high-performance protectant technologies designed for biopharmaceuticals and diagnostics.

Established ingredient suppliers, including Roquette Frères, Kerry Group plc, and Ingredion Incorporated, are driving adoption in the food and beverage segment through clean-label formulations, functional stability solutions, and customer-centric innovation models. These companies are leveraging partnerships and application-specific R&D to strengthen their footprint in nutraceutical and functional food markets.

Specialized players such as Croda International Plc, DSM-Firmenich AG, Nagase & Co., Ltd., and Lonza Group AG are focusing on customized, high-value protectants, particularly in biologics, industrial biotechnology, and agricultural formulations. Their strength lies in innovation-driven pipelines and adaptability to niche applications.

Competitive differentiation is shifting toward integrated offerings that combine sustainability credentials, application-specific performance, and digital R&D platforms. As demand grows across sectors, collaboration with biopharma, food manufacturers, and research institutions is expected to define future positioning.

Key Developments in Enzyme Protectants Market

  • In July 2025, BASF announced that its liquid enzyme portfolio for the laundry and cleaning industry was expanded via addition of lipase, cellulase, and amylase types. Stability enhancement of certain enzymes (e.g. the Lavergy® C Care cellulase) in presence of proteases was highlighted.
  • In November 2024, a peer-reviewed review on stabilization of recombinant enzymes by nanotechnology‐based immobilization methods was published. It was shown that enzyme performance under harsh industrial processing (temperature, pH swings) was improved via nanoparticle carriers offering enhanced surface area and retention.

Scope of the Report

Item Value
Quantitative Units USD 820.0 million
Product Type Stabilizers, Antioxidants, Chelating Agents, Preservatives, Protective Polymers & Coatings, Other Protectants
Source Synthetic Protectants, Natural/Bio-based Protectants
Form ulation Powder (freeze-dried, spray-dried), Liquid Solutions, Encapsulated/Coated Systems
End-Use Application Pharmaceuticals & Biologics, Food & Beverage, Industrial Biotechnology, Diagnostics & Research, Agricultural Formulations
Regions Covered North America, Europe, Asia-Pacific, Latin America, Middle East & Africa
Country Covered United States, Canada, Germany, France, United Kingdom, China, Japan, India, Brazil, South Africa
Key Companies Profiled BASF SE, Evonik Industries AG, Merck KGaA (MilliporeSigma), Croda International Plc, Roquette Frères, Kerry Group plc, DSM-Firmenich AG, Ingredion Incorporated, Nagase & Co., Ltd., Lonza Group AG
Additional Attributes Segment-level dollar sales by type, source, and application; adoption trends in biologics, functional foods, and industrial biotechnology; rising demand for bio-based protectants alongside synthetic solutions; sector-specific growth in pharmaceuticals, diagnostics, and food industries; role of encapsulation, PEGylation, and stabilization technologies; sustainability-driven R&D pipelines; regional trends shaped by regulatory compliance and biomanufacturing hubs.

Key Segments

By Type:

  • Stabilizers
    • Polyols
    • Sugars
    • Amino Acids
    • Trehalose
    • Glycerol
  • Antioxidants
  • Chelating Agents
  • Preservatives
  • Protective Polymers & Coatings
  • Other Protectants (protease inhibitors, surfactants, novel excipients)

By Source:

  • Synthetic Protectants
  • Natural/Bio-based Protectants (plant-derived, fermentation-derived)

By Formulation:

  • Powder (freeze-dried, spray-dried)
  • Liquid Solutions
  • Encapsulated/Coated Systems

By End-Use Application:

  • Food & Beverage
  • Pharmaceuticals & Biologics
  • Industrial Biotechnology
  • Diagnostics & Research
  • Agricultural Formulation Companies

By Region:

  • North America
  • Latin America
  • Europe
  • East Asia
  • South Asia & Pacific
  • MEA

Table of Content

  1. Executive Summary
    • Global Market Outlook
    • Demand-side Trends
    • Supply-side Trends
    • Technology Roadmap Analysis
    • Analysis and Recommendations
  2. Market Overview
    • Market Coverage / Taxonomy
    • Market Definition / Scope / Limitations
  3. Market Background
    • Market Dynamics
      • Drivers
      • Restraints
      • Opportunity
      • Trends
    • Scenario Forecast
      • Demand in Optimistic Scenario
      • Demand in Likely Scenario
      • Demand in Conservative Scenario
    • Opportunity Map Analysis
    • Product Life Cycle Analysis
    • Supply Chain Analysis
    • Investment Feasibility Matrix
    • Value Chain Analysis
    • PESTLE and Porter’s Analysis
    • Regulatory Landscape
    • Regional Parent Market Outlook
    • Production and Consumption Statistics
    • Import and Export Statistics
  4. Global Analysis 2020 to 2024 and Forecast, 2025 to 2035
    • Historical Market Size Value (USD Million) & Volume (MT) Analysis, 2020 to 2024
    • Current and Future Market Size Value (USD Million) & Volume (MT) Projections, 2025 to 2035
      • Y-o-Y Growth Trend Analysis
      • Absolute $ Opportunity Analysis
  5. Global Pricing Analysis 2020 to 2024 and Forecast 2025 to 2035
  6. Global Analysis 2020 to 2024 and Forecast 2025 to 2035, By Type
    • Introduction / Key Findings
    • Historical Market Size Value (USD Million) & Volume (MT) Analysis By Type, 2020 to 2024
    • Current and Future Market Size Value (USD Million) & Volume (MT) Analysis and Forecast By Type, 2025 to 2035
      • Stabilizers
        • Polyols
        • Sugars
        • Amino Acids
        • Trehalose
        • Glycerol
      • Antioxidants
      • Chelating Agents
      • Preservatives
      • Protective Polymers & Coatings
      • Other Protectants (protease inhibitors, surfactants, novel excipients)
    • Y-o-Y Growth Trend Analysis By Type, 2020 to 2024
    • Absolute $ Opportunity Analysis By Type, 2025 to 2035
  7. Global Analysis 2020 to 2024 and Forecast 2025 to 2035, By Source
    • Introduction / Key Findings
    • Historical Market Size Value (USD Million) & Volume (MT) Analysis By Source, 2020 to 2024
    • Current and Future Market Size Value (USD Million) & Volume (MT) Analysis and Forecast By Source, 2025 to 2035
      • Synthetic Protectants
      • Natural/Bio-based Protectants (plant-derived, fermentation-derived)
    • Y-o-Y Growth Trend Analysis By Source, 2020 to 2024
    • Absolute $ Opportunity Analysis By Source, 2025 to 2035
  8. Global Analysis 2020 to 2024 and Forecast 2025 to 2035, By Formulation
    • Introduction / Key Findings
    • Historical Market Size Value (USD Million) & Volume (MT) Analysis By Formulation, 2020 to 2024
    • Current and Future Market Size Value (USD Million) & Volume (MT) Analysis and Forecast By Formulation, 2025 to 2035
      • Powder (freeze-dried, spray-dried)
      • Liquid Solutions
      • Encapsulated/Coated Systems
    • Y-o-Y Growth Trend Analysis By Formulation, 2020 to 2024
    • Absolute $ Opportunity Analysis By Formulation, 2025 to 2035
  9. Global Analysis 2020 to 2024 and Forecast 2025 to 2035, By End-Use Application
    • Introduction / Key Findings
    • Historical Market Size Value (USD Million) & Volume (MT) Analysis By End-Use Application, 2020 to 2024
    • Current and Future Market Size Value (USD Million) & Volume (MT) Analysis and Forecast By End-Use Application, 2025 to 2035
      • Food & Beverage
      • Pharmaceuticals & Biologics
      • Industrial Biotechnology
      • Diagnostics & Research
      • Agricultural Formulation Companies
    • Y-o-Y Growth Trend Analysis By End-Use Application, 2020 to 2024
    • Absolute $ Opportunity Analysis By End-Use Application, 2025 to 2035
  10. Global Analysis 2020 to 2024 and Forecast 2025 to 2035, By Region
    • Introduction
    • Historical Market Size Value (USD Million) & Volume (MT) Analysis By Region, 2020 to 2024
    • Current Market Size Value (USD Million) & Volume (MT) Analysis and Forecast By Region, 2025 to 2035
      • North America
      • Latin America
      • Europe
      • East Asia
      • South Asia & Pacific
      • MEA
    • Market Attractiveness Analysis By Region
  11. North America Analysis 2020 to 2024 and Forecast 2025 to 2035, By Country
    • Historical Market Size Value (USD Million) & Volume (MT) Trend Analysis By Market Taxonomy, 2020 to 2024
    • Market Size Value (USD Million) & Volume (MT) Forecast By Market Taxonomy, 2025 to 2035
      • By Country
        • U.S.
        • Canada
      • By Type
      • By Source
      • By Formulation
      • By End-Use Application
    • Market Attractiveness Analysis
      • By Country
      • By Type
      • By Source
      • By Formulation
      • By End-Use Application
    • Key Takeaways
  12. Latin America Analysis 2020 to 2024 and Forecast 2025 to 2035, By Country
    • Historical Market Size Value (USD Million) & Volume (MT) Trend Analysis By Market Taxonomy, 2020 to 2024
    • Market Size Value (USD Million) & Volume (MT) Forecast By Market Taxonomy, 2025 to 2035
      • By Country
        • Brazil
        • Mexico
        • Colombia
        • Rest of Latin America
      • By Type
      • By Source
      • By Formulation
      • By End-Use Application
    • Market Attractiveness Analysis
      • By Country
      • By Type
      • By Source
      • By Formulation
      • By End-Use Application
    • Key Takeaways
  13. Europe Analysis 2020 to 2024 and Forecast 2025 to 2035, By Country
    • Historical Market Size Value (USD Million) & Volume (MT) Trend Analysis By Market Taxonomy, 2020 to 2024
    • Market Size Value (USD Million) & Volume (MT) Forecast By Market Taxonomy, 2025 to 2035
      • By Country
        • Germany
        • U.K.
        • France
        • Italy
        • Spain
        • Belgium
        • Netherlands
        • Nordic
        • Switzerland
        • Russia
        • Poland
        • Rest of Europe
      • By Type
      • By Source
      • By Formulation
      • By End-Use Application
    • Market Attractiveness Analysis
      • By Country
      • By Type
      • By Source
      • By Formulation
      • By End-Use Application
    • Key Takeaways
  14. East Asia Analysis 2020 to 2024 and Forecast 2025 to 2035, By Country
    • Historical Market Size Value (USD Million) & Volume (MT) Trend Analysis By Market Taxonomy, 2020 to 2024
    • Market Size Value (USD Million) & Volume (MT) Forecast By Market Taxonomy, 2025 to 2035
      • By Country
        • China
        • Japan
        • South Korea
      • By Type
      • By Source
      • By Formulation
      • By End-Use Application
    • Market Attractiveness Analysis
      • By Country
      • By Type
      • By Source
      • By Formulation
      • By End-Use Application
    • Key Takeaways
  15. South Asia & Pacific Analysis 2020 to 2024 and Forecast 2025 to 2035, By Country
    • Historical Market Size Value (USD Million) & Volume (MT) Trend Analysis By Market Taxonomy, 2020 to 2024
    • Market Size Value (USD Million) & Volume (MT) Forecast By Market Taxonomy, 2025 to 2035
      • By Country
        • India
        • Thailand
        • Malaysia
        • Indonesia
        • Singapore
        • Vietnam
        • Australia
        • New Zealand
        • Rest of South Asia & Pacific
      • By Type
      • By Source
      • By Formulation
      • By End-Use Application
    • Market Attractiveness Analysis
      • By Country
      • By Type
      • By Source
      • By Formulation
      • By End-Use Application
    • Key Takeaways
  16. MEA Analysis 2020 to 2024 and Forecast 2025 to 2035, By Country
    • Historical Market Size Value (USD Million) & Volume (MT) Trend Analysis By Market Taxonomy, 2020 to 2024
    • Market Size Value (USD Million) & Volume (MT) Forecast By Market Taxonomy, 2025 to 2035
      • By Country
        • Turkey
        • UAE
        • Saudi Arabia
        • Israel
        • Other GCC Countries
        • North Africa
        • South Africa
        • Central Africa
      • By Type
      • By Source
      • By Formulation
      • By End-Use Application
    • Market Attractiveness Analysis
      • By Country
      • By Type
      • By Source
      • By Formulation
      • By End-Use Application
    • Key Takeaways
  17. Key Countries Analysis
    • U.S.
      • Pricing Analysis
      • Market Share Analysis, 2024
        • By Type
        • By Source
        • By Formulation
        • By End-Use Application
    • Canada
      • Pricing Analysis
      • Market Share Analysis, 2024
        • By Type
        • By Source
        • By Formulation
        • By End-Use Application
    • Brazil
      • Pricing Analysis
      • Market Share Analysis, 2024
        • By Type
        • By Source
        • By Formulation
        • By End-Use Application
    • Mexico
      • Pricing Analysis
      • Market Share Analysis, 2024
        • By Type
        • By Source
        • By Formulation
        • By End-Use Application
    • Colombia
      • Pricing Analysis
      • Market Share Analysis, 2024
        • By Type
        • By Source
        • By Formulation
        • By End-Use Application
    • Germany
      • Pricing Analysis
      • Market Share Analysis, 2024
        • By Type
        • By Source
        • By Formulation
        • By End-Use Application
    • U.K.
      • Pricing Analysis
      • Market Share Analysis, 2024
        • By Type
        • By Source
        • By Formulation
        • By End-Use Application
    • France
      • Pricing Analysis
      • Market Share Analysis, 2024
        • By Type
        • By Source
        • By Formulation
        • By End-Use Application
    • Italy
      • Pricing Analysis
      • Market Share Analysis, 2024
        • By Type
        • By Source
        • By Formulation
        • By End-Use Application
    • Spain
      • Pricing Analysis
      • Market Share Analysis, 2024
        • By Type
        • By Source
        • By Formulation
        • By End-Use Application
    • Belgium
      • Pricing Analysis
      • Market Share Analysis, 2024
        • By Type
        • By Source
        • By Formulation
        • By End-Use Application
    • Netherlands
      • Pricing Analysis
      • Market Share Analysis, 2024
        • By Type
        • By Source
        • By Formulation
        • By End-Use Application
    • Nordic
      • Pricing Analysis
      • Market Share Analysis, 2024
        • By Type
        • By Source
        • By Formulation
        • By End-Use Application
    • Switzerland
      • Pricing Analysis
      • Market Share Analysis, 2024
        • By Type
        • By Source
        • By Formulation
        • By End-Use Application
    • Russia
      • Pricing Analysis
      • Market Share Analysis, 2024
        • By Type
        • By Source
        • By Formulation
        • By End-Use Application
    • Poland
      • Pricing Analysis
      • Market Share Analysis, 2024
        • By Type
        • By Source
        • By Formulation
        • By End-Use Application
    • China
      • Pricing Analysis
      • Market Share Analysis, 2024
        • By Type
        • By Source
        • By Formulation
        • By End-Use Application
    • Japan
      • Pricing Analysis
      • Market Share Analysis, 2024
        • By Type
        • By Source
        • By Formulation
        • By End-Use Application
    • South Korea
      • Pricing Analysis
      • Market Share Analysis, 2024
        • By Type
        • By Source
        • By Formulation
        • By End-Use Application
    • India
      • Pricing Analysis
      • Market Share Analysis, 2024
        • By Type
        • By Source
        • By Formulation
        • By End-Use Application
    • Thailand
      • Pricing Analysis
      • Market Share Analysis, 2024
        • By Type
        • By Source
        • By Formulation
        • By End-Use Application
    • Indonesia
      • Pricing Analysis
      • Market Share Analysis, 2024
        • By Type
        • By Source
        • By Formulation
        • By End-Use Application
    • Australia
      • Pricing Analysis
      • Market Share Analysis, 2024
        • By Type
        • By Source
        • By Formulation
        • By End-Use Application
    • New Zealand
      • Pricing Analysis
      • Market Share Analysis, 2024
        • By Type
        • By Source
        • By Formulation
        • By End-Use Application
    • Turkey
      • Pricing Analysis
      • Market Share Analysis, 2024
        • By Type
        • By Source
        • By Formulation
        • By End-Use Application
    • UAE
      • Pricing Analysis
      • Market Share Analysis, 2024
        • By Type
        • By Source
        • By Formulation
        • By End-Use Application
    • Saudi Arabia
      • Pricing Analysis
      • Market Share Analysis, 2024
        • By Type
        • By Source
        • By Formulation
        • By End-Use Application
    • Israel
      • Pricing Analysis
      • Market Share Analysis, 2024
        • By Type
        • By Source
        • By Formulation
        • By End-Use Application
    • North Africa
      • Pricing Analysis
      • Market Share Analysis, 2024
        • By Type
        • By Source
        • By Formulation
        • By End-Use Application
    • South Africa
      • Pricing Analysis
      • Market Share Analysis, 2024
        • By Type
        • By Source
        • By Formulation
        • By End-Use Application
  18. Market Structure Analysis
    • Competition Dashboard
    • Competition Benchmarking
    • Market Share Analysis of Top Players
      • By Regional
      • By Type
      • By Source
      • By Formulation
      • By End-Use Application
  19. Competition Analysis
    • Competition Deep Dive
      • BASF SE
        • Overview
        • Product Portfolio
        • Profitability by Market Segments (Type/Form /End-Use Application/Region)
        • Sales Footprint
        • Strategy Overview
        • Evonik Industries AG
        • Merck KGaA (MilliporeSigma)
        • Croda International Plc
        • Roquette Frères
        • Kerry Group plc
        • DSM-Firmenich AG
        • Ingredion Incorporated
        • Nagase & Co., Ltd.
        • Lonza Group AG
        • Others
    • Assumptions & Acronyms Used
    • Research Methodology

List of Tables

  • Table 1: Global Value (USD Million) Forecast by Region, 2020-2035
  • Table 2: Global Volume (MT) Forecast by Region, 2020-2035
  • Table 3: Global Value (USD Million) Forecast by Type, 2020-2035
  • Table 4: Global Volume (MT) Forecast by Type, 2020-2035
  • Table 5: Global Value (USD Million) Forecast by Source, 2020-2035
  • Table 6: Global Volume (MT) Forecast by Source, 2020-2035
  • Table 7: Global Value (USD Million) Forecast by Formulation, 2020-2035
  • Table 8: Global Volume (MT) Forecast by Formulation, 2020-2035
  • Table 9: Global Value (USD Million) Forecast by End-Use Application, 2020-2035
  • Table 10: Global Volume (MT) Forecast by End-Use Application, 2020-2035
  • Table 11: North America Value (USD Million) Forecast by Country, 2020-2035
  • Table 12: North America Volume (MT) Forecast by Country, 2020-2035
  • Table 13: North America Value (USD Million) Forecast by Type, 2020-2035
  • Table 14: North America Volume (MT) Forecast by Type, 2020-2035
  • Table 15: North America Value (USD Million) Forecast by Source, 2020-2035
  • Table 16: North America Volume (MT) Forecast by Source, 2020-2035
  • Table 17: North America Value (USD Million) Forecast by Formulation, 2020-2035
  • Table 18: North America Volume (MT) Forecast by Formulation, 2020-2035
  • Table 19: North America Value (USD Million) Forecast by End-Use Application, 2020-2035
  • Table 20: North America Volume (MT) Forecast by End-Use Application, 2020-2035
  • Table 21: Latin America Value (USD Million) Forecast by Country, 2020-2035
  • Table 22: Latin America Volume (MT) Forecast by Country, 2020-2035
  • Table 23: Latin America Value (USD Million) Forecast by Type, 2020-2035
  • Table 24: Latin America Volume (MT) Forecast by Type, 2020-2035
  • Table 25: Latin America Value (USD Million) Forecast by Source, 2020-2035
  • Table 26: Latin America Volume (MT) Forecast by Source, 2020-2035
  • Table 27: Latin America Value (USD Million) Forecast by Formulation, 2020-2035
  • Table 28: Latin America Volume (MT) Forecast by Formulation, 2020-2035
  • Table 29: Latin America Value (USD Million) Forecast by End-Use Application, 2020-2035
  • Table 30: Latin America Volume (MT) Forecast by End-Use Application, 2020-2035
  • Table 31: Europe Value (USD Million) Forecast by Country, 2020-2035
  • Table 32: Europe Volume (MT) Forecast by Country, 2020-2035
  • Table 33: Europe Value (USD Million) Forecast by Type, 2020-2035
  • Table 34: Europe Volume (MT) Forecast by Type, 2020-2035
  • Table 35: Europe Value (USD Million) Forecast by Source, 2020-2035
  • Table 36: Europe Volume (MT) Forecast by Source, 2020-2035
  • Table 37: Europe Value (USD Million) Forecast by Formulation, 2020-2035
  • Table 38: Europe Volume (MT) Forecast by Formulation, 2020-2035
  • Table 39: Europe Value (USD Million) Forecast by End-Use Application, 2020-2035
  • Table 40: Europe Volume (MT) Forecast by End-Use Application, 2020-2035
  • Table 41: East Asia Value (USD Million) Forecast by Country, 2020-2035
  • Table 42: East Asia Volume (MT) Forecast by Country, 2020-2035
  • Table 43: East Asia Value (USD Million) Forecast by Type, 2020-2035
  • Table 44: East Asia Volume (MT) Forecast by Type, 2020-2035
  • Table 45: East Asia Value (USD Million) Forecast by Source, 2020-2035
  • Table 46: East Asia Volume (MT) Forecast by Source, 2020-2035
  • Table 47: East Asia Value (USD Million) Forecast by Formulation, 2020-2035
  • Table 48: East Asia Volume (MT) Forecast by Formulation, 2020-2035
  • Table 49: East Asia Value (USD Million) Forecast by End-Use Application, 2020-2035
  • Table 50: East Asia Volume (MT) Forecast by End-Use Application, 2020-2035
  • Table 51: South Asia & Pacific Value (USD Million) Forecast by Country, 2020-2035
  • Table 52: South Asia & Pacific Volume (MT) Forecast by Country, 2020-2035
  • Table 53: South Asia & Pacific Value (USD Million) Forecast by Type, 2020-2035
  • Table 54: South Asia & Pacific Volume (MT) Forecast by Type, 2020-2035
  • Table 55: South Asia & Pacific Value (USD Million) Forecast by Source, 2020-2035
  • Table 56: South Asia & Pacific Volume (MT) Forecast by Source, 2020-2035
  • Table 57: South Asia & Pacific Value (USD Million) Forecast by Formulation, 2020-2035
  • Table 58: South Asia & Pacific Volume (MT) Forecast by Formulation, 2020-2035
  • Table 59: South Asia & Pacific Value (USD Million) Forecast by End-Use Application, 2020-2035
  • Table 60: South Asia & Pacific Volume (MT) Forecast by End-Use Application, 2020-2035
  • Table 61: MEA Value (USD Million) Forecast by Country, 2020-2035
  • Table 62: MEA Volume (MT) Forecast by Country, 2020-2035
  • Table 63: MEA Value (USD Million) Forecast by Type, 2020-2035
  • Table 64: MEA Volume (MT) Forecast by Type, 2020-2035
  • Table 65: MEA Value (USD Million) Forecast by Source, 2020-2035
  • Table 66: MEA Volume (MT) Forecast by Source, 2020-2035
  • Table 67: MEA Value (USD Million) Forecast by Formulation, 2020-2035
  • Table 68: MEA Volume (MT) Forecast by Formulation, 2020-2035
  • Table 69: MEA Value (USD Million) Forecast by End-Use Application, 2020-2035
  • Table 70: MEA Volume (MT) Forecast by End-Use Application, 2020-2035

List of Figures

  • Figure 1: Global Volume (MT) Forecast 2020-2035
  • Figure 2: Global Pricing Analysis
  • Figure 3: Global Value (USD Million) Forecast 2020-2035
  • Figure 4: Global Value Share and BPS Analysis by Type, 2025 and 2035
  • Figure 5: Global Y-o-Y Growth Comparison by Type, 2025-2035
  • Figure 6: Global Attractiveness Analysis by Type
  • Figure 7: Global Value Share and BPS Analysis by Source, 2025 and 2035
  • Figure 8: Global Y-o-Y Growth Comparison by Source, 2025-2035
  • Figure 9: Global Attractiveness Analysis by Source
  • Figure 10: Global Value Share and BPS Analysis by Formulation, 2025 and 2035
  • Figure 11: Global Y-o-Y Growth Comparison by Formulation, 2025-2035
  • Figure 12: Global Attractiveness Analysis by Formulation
  • Figure 13: Global Value Share and BPS Analysis by End-Use Application, 2025 and 2035
  • Figure 14: Global Y-o-Y Growth Comparison by End-Use Application, 2025-2035
  • Figure 15: Global Attractiveness Analysis by End-Use Application
  • Figure 16: Global Value (USD Million) Share and BPS Analysis by Region, 2025 and 2035
  • Figure 17: Global Y-o-Y Growth Comparison by Region, 2025-2035
  • Figure 18: Global Attractiveness Analysis by Region
  • Figure 19: North America Incremental $ Opportunity, 2025-2035
  • Figure 20: Latin America Incremental $ Opportunity, 2025-2035
  • Figure 21: Europe Incremental $ Opportunity, 2025-2035
  • Figure 22: East Asia Incremental $ Opportunity, 2025-2035
  • Figure 23: South Asia & Pacific Incremental $ Opportunity, 2025-2035
  • Figure 24: MEA Incremental $ Opportunity, 2025-2035
  • Figure 25: North America Value Share and BPS Analysis by Country, 2025 and 2035
  • Figure 26: North America Value Share and BPS Analysis by Type, 2025 and 2035
  • Figure 27: North America Y-o-Y Growth Comparison by Type, 2025-2035
  • Figure 28: North America Attractiveness Analysis by Type
  • Figure 29: North America Value Share and BPS Analysis by Source, 2025 and 2035
  • Figure 30: North America Y-o-Y Growth Comparison by Source, 2025-2035
  • Figure 31: North America Attractiveness Analysis by Source
  • Figure 32: North America Value Share and BPS Analysis by Formulation, 2025 and 2035
  • Figure 33: North America Y-o-Y Growth Comparison by Formulation, 2025-2035
  • Figure 34: North America Attractiveness Analysis by Formulation
  • Figure 35: North America Value Share and BPS Analysis by End-Use Application, 2025 and 2035
  • Figure 36: North America Y-o-Y Growth Comparison by End-Use Application, 2025-2035
  • Figure 37: North America Attractiveness Analysis by End-Use Application
  • Figure 38: Latin America Value Share and BPS Analysis by Country, 2025 and 2035
  • Figure 39: Latin America Value Share and BPS Analysis by Type, 2025 and 2035
  • Figure 40: Latin America Y-o-Y Growth Comparison by Type, 2025-2035
  • Figure 41: Latin America Attractiveness Analysis by Type
  • Figure 42: Latin America Value Share and BPS Analysis by Source, 2025 and 2035
  • Figure 43: Latin America Y-o-Y Growth Comparison by Source, 2025-2035
  • Figure 44: Latin America Attractiveness Analysis by Source
  • Figure 45: Latin America Value Share and BPS Analysis by Formulation, 2025 and 2035
  • Figure 46: Latin America Y-o-Y Growth Comparison by Formulation, 2025-2035
  • Figure 47: Latin America Attractiveness Analysis by Formulation
  • Figure 48: Latin America Value Share and BPS Analysis by End-Use Application, 2025 and 2035
  • Figure 49: Latin America Y-o-Y Growth Comparison by End-Use Application, 2025-2035
  • Figure 50: Latin America Attractiveness Analysis by End-Use Application
  • Figure 51: Europe Value Share and BPS Analysis by Country, 2025 and 2035
  • Figure 52: Europe Value Share and BPS Analysis by Type, 2025 and 2035
  • Figure 53: Europe Y-o-Y Growth Comparison by Type, 2025-2035
  • Figure 54: Europe Attractiveness Analysis by Type
  • Figure 55: Europe Value Share and BPS Analysis by Source, 2025 and 2035
  • Figure 56: Europe Y-o-Y Growth Comparison by Source, 2025-2035
  • Figure 57: Europe Attractiveness Analysis by Source
  • Figure 58: Europe Value Share and BPS Analysis by Formulation, 2025 and 2035
  • Figure 59: Europe Y-o-Y Growth Comparison by Formulation, 2025-2035
  • Figure 60: Europe Attractiveness Analysis by Formulation
  • Figure 61: Europe Value Share and BPS Analysis by End-Use Application, 2025 and 2035
  • Figure 62: Europe Y-o-Y Growth Comparison by End-Use Application, 2025-2035
  • Figure 63: Europe Attractiveness Analysis by End-Use Application
  • Figure 64: East Asia Value Share and BPS Analysis by Country, 2025 and 2035
  • Figure 65: East Asia Value Share and BPS Analysis by Type, 2025 and 2035
  • Figure 66: East Asia Y-o-Y Growth Comparison by Type, 2025-2035
  • Figure 67: East Asia Attractiveness Analysis by Type
  • Figure 68: East Asia Value Share and BPS Analysis by Source, 2025 and 2035
  • Figure 69: East Asia Y-o-Y Growth Comparison by Source, 2025-2035
  • Figure 70: East Asia Attractiveness Analysis by Source
  • Figure 71: East Asia Value Share and BPS Analysis by Formulation, 2025 and 2035
  • Figure 72: East Asia Y-o-Y Growth Comparison by Formulation, 2025-2035
  • Figure 73: East Asia Attractiveness Analysis by Formulation
  • Figure 74: East Asia Value Share and BPS Analysis by End-Use Application, 2025 and 2035
  • Figure 75: East Asia Y-o-Y Growth Comparison by End-Use Application, 2025-2035
  • Figure 76: East Asia Attractiveness Analysis by End-Use Application
  • Figure 77: South Asia & Pacific Value Share and BPS Analysis by Country, 2025 and 2035
  • Figure 78: South Asia & Pacific Value Share and BPS Analysis by Type, 2025 and 2035
  • Figure 79: South Asia & Pacific Y-o-Y Growth Comparison by Type, 2025-2035
  • Figure 80: South Asia & Pacific Attractiveness Analysis by Type
  • Figure 81: South Asia & Pacific Value Share and BPS Analysis by Source, 2025 and 2035
  • Figure 82: South Asia & Pacific Y-o-Y Growth Comparison by Source, 2025-2035
  • Figure 83: South Asia & Pacific Attractiveness Analysis by Source
  • Figure 84: South Asia & Pacific Value Share and BPS Analysis by Formulation, 2025 and 2035
  • Figure 85: South Asia & Pacific Y-o-Y Growth Comparison by Formulation, 2025-2035
  • Figure 86: South Asia & Pacific Attractiveness Analysis by Formulation
  • Figure 87: South Asia & Pacific Value Share and BPS Analysis by End-Use Application, 2025 and 2035
  • Figure 88: South Asia & Pacific Y-o-Y Growth Comparison by End-Use Application, 2025-2035
  • Figure 89: South Asia & Pacific Attractiveness Analysis by End-Use Application
  • Figure 90: MEA Value Share and BPS Analysis by Country, 2025 and 2035
  • Figure 91: MEA Value Share and BPS Analysis by Type, 2025 and 2035
  • Figure 92: MEA Y-o-Y Growth Comparison by Type, 2025-2035
  • Figure 93: MEA Attractiveness Analysis by Type
  • Figure 94: MEA Value Share and BPS Analysis by Source, 2025 and 2035
  • Figure 95: MEA Y-o-Y Growth Comparison by Source, 2025-2035
  • Figure 96: MEA Attractiveness Analysis by Source
  • Figure 97: MEA Value Share and BPS Analysis by Formulation, 2025 and 2035
  • Figure 98: MEA Y-o-Y Growth Comparison by Formulation, 2025-2035
  • Figure 99: MEA Attractiveness Analysis by Formulation
  • Figure 100: MEA Value Share and BPS Analysis by End-Use Application, 2025 and 2035
  • Figure 101: MEA Y-o-Y Growth Comparison by End-Use Application, 2025-2035
  • Figure 102: MEA Attractiveness Analysis by End-Use Application
  • Figure 103: Global - Tier Structure Analysis
  • Figure 104: Global - Company Share Analysis

Frequently Asked Questions

How big is the Enzyme Protectants Market in 2025?

The global Enzyme Protectants is estimated to be valued at USD 820.0 million in 2025.

What will be the size of Enzyme Protectants Market in 2035?

The market size for the Enzyme Protectants is projected to reach USD 1,511.5 million by 2035.

How much will be the Enzyme Protectants Market growth between 2025 and 2035?

The Enzyme Protectants is expected to grow at a 6.3% CAGR between 2025 and 2035.

What are the key product types in the Enzyme Protectants Market?

The key product types in the enzyme protectants market are stabilizers, antioxidants, chelating agents, preservatives, protective polymers & coatings, and other protectants.

Which product type segment to contribute significant share in the Enzyme Protectants Market in 2025?

In terms of product type, the stabilizers segment is projected to command the largest share at 33.6% of the enzyme protectants market in 2025.

Explore Similar Insights

Future Market Insights

Enzyme Protectants Market

Chat With

MaRIA

Hi There, I am MaRIA, Your Market Research Intelligence Assistant. How may I help you?