
- Market Size (2026)
- USD 47.2 Bn
- Forecast (2036)
- USD 86.9 Bn
- CAGR (2026 to 2036)
- 6.3%
How Big Is the Fresh Pears Market in 2026?
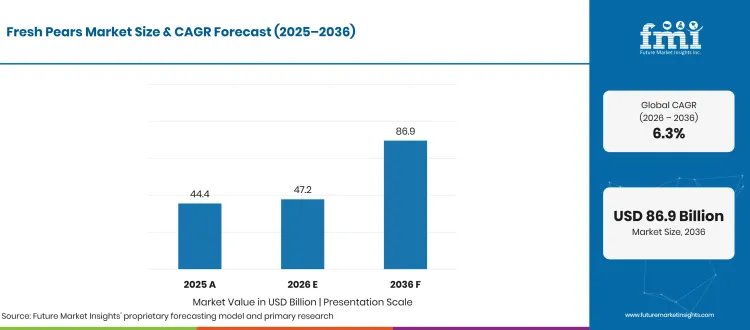
Global fresh pears market demonstrated steady progress from USD 44.4 billion in 2025 to USD 47.2 billion in 2026, building toward a Future Market Insights (FMI) targeted valuation of USD 86.9 billion by 2036 at a CAGR of 6.3% and generating USD 39.7 billion in incremental dollar opportunity over the forecast decade.
| Market Metric | Valuation / Share / Forecast Benchmark |
|---|---|
| 2025 Market Size (Historical) | USD 44.4 billion |
| 2026 Market Size (Estimated) | USD 47.2 billion |
| 2036 Market Size (Projected) | USD 86.9 billion |
| Compound Annual Growth Rate (2026 to 2036) | 6.3% CAGR |
| Incremental Dollar Opportunity (2026 to 2036) | USD 39.7 billion |
| Dominant Type Segment (2026 Share) | Conventional (63.0% in 2026) | Other Segment Combined (37.0%) | Total (100.0%) |
| Dominant Application Segment (2026 Share) | Fresh Consumption (42.0% in 2026) | Other Segment Combined (58.0%) | Total (100.0%) |
| Dominant Product Segment (2026 Share) | Green Anjou (42.0% in 2026) | Other Segment Combined (58.0%) | Total (100.0%) |
| Largest Country Markets (2026 Valuation) | China (USD 21.24 billion), United States (USD 4.72 billion), India (USD 2.83 billion) |
| Fastest-Growing Country Markets (2026 to 2036) | India (6.9% CAGR), Australia and New Zealand (6.7% CAGR), South Korea (6.7% CAGR) |
| Leading Active Market Players | Stemilt Growers LLC, Chelan Fresh, FirstFruits Farms, Washington Fruit Growers, CMI Orchards |
Source: Future Market Insights analysis of the fresh pears market, 2026.
This Report Answers
- How large the fresh pears market is in 2026 and what it reaches by 2036
- Which type, application and product segments lead in 2026
- What is driving demand and what is holding the category back
- Which countries grow fastest between 2026 and 2036
- What Stemilt Growers LLC and other leading players have launched
- How the fresh pears market is defined, segmented and measured
Executive Market Overview
Commercial packhouses and grocery retail chains depend on controlled-atmosphere cold storage and 1-MCP treatment to market dessert pears continuously, minimizing retail fruit shrink and preserving juicy eating texture. FMI finds that supermarket produce buyers are shifting seasonal contracts toward pre-conditioned pears that soften predictably within three to four days of purchase, owing to high retail shrink when unconditioned winter varieties sit unripened on ambient displays next to other fresh fruits and vegetables. Production records from the USDA National Agricultural Statistics Service (May 2026) confirm that United States utilized fresh-market pear production rebounded to 618,480 short tons in 2025 from 414,960 short tons in 2024, while USA Pears (August 2025) reported that Oregon and Washington growers harvested 19.0 million boxes (88.0% of the national crop), up 78.0% year-on-year.
Loose bulk pears face margin compression in mass grocery channels unless packers differentiate through fixed-weight convenience bands or certified organic handling. FMI's analysis indicates that grower-shippers are lifting realized price per kilogram by sorting uniform fruit into packaged fresh fruits formats such as four-count tension bands and mixed-variety grab-and-go pouches. In October 2025, Stemilt Growers LLC (October 2025) expanded retail merchandising options by launching Prism Pears mixed-variety bags and extending its 4-count EZ Band format to conventional Green d'Anjou and red pears. Market sizing covers revenue from fresh pears sold across Conventional and Organic types for Fresh Consumption and Bakery Anjou and Red Anjou, while excluding canned pears, pear juice concentrates,finished bakery products, and non-pear gift basket items.
Analyst Perspective
"Fresh pear shippers will capture higher margin growth through thermal-conditioned Ripe Rite programs and fixed-count banded packs than through unconditioned bulk cartons, because grocery buyers pay to eliminate store-level ripening failures. The primary commercial risk is regional climate volatility across Shandong, Shaanxi, and the Pacific Northwest, where drought or spring frosts abruptly alter exportable grade pack-outs."
- Nandini Roy Choudhury, Principal Consultant, Future Market Insights (FMI)
Key Market Trends & Insights
- Packhouse Thermal Conditioning and Automated Optical Sorting Expansion:Retail produce directors increasingly require packers to pre-condition winter pears prior to dispatch so shoppers experience ready-to-eat juiciness without counter spoilage. In July 2025, Stemilt Growers LLC (July 2025) commissioned a dedicated pear packing line and expanded its thermal Ripe Rite conditioning program in Wenatchee, Washington ahead of the 2025 to 2026 harvest, while CMI Orchards (August 2026) initiated early-August 2026 Pacific Northwest pear harvesting with controlled-atmosphere storage allocation.
- Banded Multi-Count and Mixed-Variety Retail Packaging Adoption:Grocery chains are replacing high-shrink loose pear pyramids with Scannable UPC banded packs and mixed-color pouches that speed checkout and prevent consumer thumb-bruising. In October 2025, Stemilt Growers LLC (October 2025) introduced Prism Pears mixed-variety bags and 4-count EZ Band packs for Green d'Anjou pears, complemented by USA Pears (December 2025) executing national retail sampling activations for World Pear Day in December 2025.
- Regenerative Organic Certification and Water-Recirculating Packlines:Northwest orchardists are pairing USDA Organic compliance with regenerative soil management and closed-loop packhouse water filtration to meet retailer sustainability scorecards. Washington Fruit Growers (January 2026) documented in-line water filtration and recirculation across its Yakima Valley packing lines and Regenerative Organic Certified orchard blocks, while Rainier Fruit Co. (January 2026) scaled year-round Green Anjou and organic pear distribution across North American retail chains.
What Are the Main Drivers, Restraints, and Opportunities?
Cross-border counter-seasonal trade and Northwest harvest recovery drive core retail volume, whereas regional orchard droughts and cold-conditioning complexity restrain pack-out realization, leaving pre-conditioned grab-and-go packs as the primary revenue opportunity through 2036.
Driver: Pacific Northwest Harvest Recovery and Year-Round Cross-Border Replenishment
Supermarket chains maintain 52-week pear planogramsdriven by long-term controlled-atmosphere storage in the Northern Hemisphere paired with Southern Hemisphere counter-seasonal imports treated with post-harvest bioprotectants. FMI observes that rebounding North American orchard yields have restored promotional volume across grocery chains. Global trade tracking from the USDA Foreign Agricultural Service (December 2025) projects international fresh pear exports near 2.0 million metric tons in marketing year 2025/26, while USA Pears (August 2025) confirmed a 78.0% harvest surge across Oregon and Washington to 19.0 million boxes in 2025, led by a 250.0% rebound in Bosc pear yields.
Restraint: Weather-Induced Orchard Contraction in China and Cold-Chain Ripening Losses
Adverse orchard weather in major Asian producing provinces and improper postharvest temperature control during transit frequently degrade fruit firmness unless handlers apply natural ripening modulators. Commodity data from the USDA Foreign Agricultural Service (December 2025) indicates that world fresh pear production declined 2.0% in 2025/26 to 26.1 million metric tons due to severe drought across Shandong and Shaanxi reducing Chinese output to 20.5 million metric tons. Furthermore, extension guidelines from Washington State University Tree Fruit Research and Extension (January 2026) confirm that winter pears dispatched without mandatory chilling intervals fail to ripen uniformly on retail shelves.
Opportunity: Pre-Conditioned Grab-and-Go Packs and Premium Cold-Chain Imports
Packers that combine ethylene and thermal conditioning protocols with fruit firmness additives are unlocking higher retail turn rates and emerging-market import premiums. FMI believes urban quick-commerce and modern grocery banners in South Asia and North America will pay premium prices for ready-to-eat banded pears that eliminate household waiting time. In July 2025, Stemilt Growers LLC (July 2025) commercialized its upgraded Ripe Rite conditioning facility to deliver ready-to-eat pears within 3 to 4 days of retail purchase, while the USDA Foreign Agricultural Service India (December 2025) (IN2025-0064) documented rising imported pear demand across Indian metropolitan retail corridors as domestic consumption reached 350,000 metric tons in 2025/26.
How Is the Fresh Pears Market Segmented?
Fresh Pears Market is segmented by Type and Application. Forecast period from 2026 to 2036.
| Segmentation Axis | Sub-Segments Covered | 2026 Leading Segment & Share | Remainder & Total Alignment (2026 to 2036) |
|---|---|---|---|
| Type | Conventional, Organic | Conventional (63.0% share in 2026) | Other Segment Combined (37.0% share) | Total (100.0%) |
| Application | Fresh Consumption, Bakery, Processed, Others | Fresh Consumption (42.0% share in 2026) | Other Segment Combined (58.0% share) | Total (100.0%) |
| Product | Green Anjou, Red Anjou, Bartlet, Red Bartlet | Green Anjou (42.0% share in 2026) | Other Segment Combined (58.0% share) | Total (100.0%) |
| Region | North America, Latin America, Western Europe, Eastern Europe, East Asia, South Asia and Pacific, Middle East and Africa | East Asia (led by China at 45.0% global share) | India (6.9% CAGR) & ANZ/South Korea (6.7% CAGR) lead growth |
Source: Future Market Insights analysis of the fresh pears market, 2026.
Why Does the Conventional Segment Lead by Type?
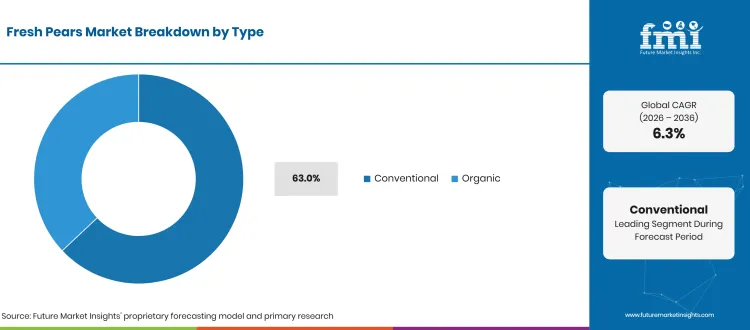
Conventional varieties secure a leading 63.0% share of Type revenue in 2026, driven by broader orchard acreage, higher packing-line throughput, and lower retail price points per pound compared with certified organic food and beverages. organic food and beverages. High-volume grocery chains rely on conventional blocks to fill weekly promotional circulars while reserving organic pears for specialty tiers. Production data from the USDA National Agricultural Statistics Service (May 2026) and variety programs from FirstFruits Farms (January 2026) confirm that conventional orchards supply the bulk of utilized fresh-market tonnage across North America and Europe through 2036.
Why Does the Fresh Consumption Segment Lead by Application?
Fresh Consumption represents the commercial foundation of Application demand with a 42.0% share in 2026, driven by higher retail unit realizations for Grade 1 fresh pears treated with post-harvest sanitizers compared to lower-priced processing or bakery culls. Consumers purchase whole pears for daily household snacking and fresh salads when skin finish and firmness meet visual standards. Market assessments from the USDA Foreign Agricultural Service India (December 2025) and USA Pears (December 2025) confirm that direct table consumption anchors retail produce turnover through 2036.
Why Does the Green Anjou Segment Lead by Product?
Green Anjou varieties secure a leading 42.0% share of Product revenue in 2026, supported by dense cell structure and exceptional multi-month storage stability in controlled-atmosphere packhouses when protected by berry freshness protectants and packhouse conditioning. Because Green Anjou replaces summer Bartlett pears from October through spring without dramatic skin-color shifts during softening, retailers depend on it for winter shelf continuity. Varietal specifications from Stemilt Growers LLC (October 2025) and Rainier Fruit Co. (January 2026) confirm that Green Anjou remains the highest-volume winter cultivar for year-round grocery programs through 2036.
Regional & Country Outlook
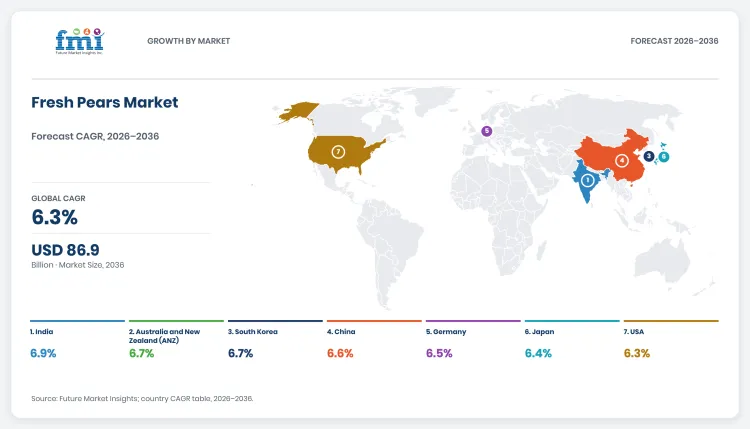
East Asia commands the largest share of global fresh pears revenue through 2036, anchored by China's massive domestic orchard base, while South Asia and Pacific and North America post strong value gains through cold-chain expansion and conditioned retail packs. FMI projects the seven profiled countries and sub-regions below to account for 71.0% of global market value in 2026 (USD 33.51 billion), expanding to USD 62.66 billion by 2036 while processors valorize grading culls into fruit pomace. India leads all profiled markets with a 6.9% CAGR, followed closely by Australia and New Zealand (ANZ) and South Korea at 6.7% CAGR each.
| Country | 2026 Revenue | 2036 Revenue | 10-Year Addition | 2026 to 2036 CAGR | Global Share (2026 -> 2036) |
|---|---|---|---|---|---|
| India | USD 2.83 billion | USD 5.51 billion | +USD 2.68 billion | 6.9% | 6.0% -> 6.3% |
| Australia and New Zealand (ANZ) | USD 0.94 billion | USD 1.80 billion | +USD 0.86 billion | 6.7% | 2.0% -> 2.1% |
| South Korea | USD 1.42 billion | USD 2.71 billion | +USD 1.29 billion | 6.7% | 3.0% -> 3.1% |
| China | USD 21.24 billion | USD 40.25 billion | +USD 19.01 billion | 6.6% | 45.0% -> 46.3% |
| Germany | USD 1.18 billion | USD 2.21 billion | +USD 1.03 billion | 6.5% | 2.5% -> 2.5% |
| Japan | USD 1.18 billion | USD 2.19 billion | +USD 1.01 billion | 6.4% | 2.5% -> 2.5% |
| United States | USD 4.72 billion | USD 8.69 billion | +USD 3.97 billion | 6.3% | 10.0% -> 10.0% |
Source: Future Market Insights analysis of the fresh pears market, 2026.
China
Demand for fresh pears in China is projected to rise from USD 21.24 billion in 2026 to USD 40.25 billion by 2036, advancing at a 6.6% CAGR and adding USD 19.01 billion in new revenue. FMI observes that Chinese revenue growth is increasingly driven by cold-storage grading and modern supermarket packaging rather than raw acreage expansion alone. Commodity data from the USDA Foreign Agricultural Service (December 2025) shows that Chinese fresh pear production totaled 20.5 million metric tons in 2025/26 following dry weather in Shandong and Shaanxi, which tightened Grade 1 supply and lifted domestic wholesale realizations. FMI expects ongoing investment in optical sorting and e-commerce gift boxes across Chinese orchard cooperatives to sustain strong value expansion through 2036.
United States
Buyer adoption of fresh pears across United States is estimated to expand from USD 4.72 billion in 2026 to USD 8.69 billion by 2036, spurred by a 6.3% CAGR and generating USD 3.97 billion in commercial expansion. In FMI's view, domestic value growth is anchored by Pacific Northwest packhouse conditioning and branded multi-count packaging that reduces grocery shrink. Crop statistics from the USDA National Agricultural Statistics Service (May 2026) confirm that United States utilized fresh-market pear output rose 49.0% to 618,480 short tons in 2025, while USA Pears (August 2025) recorded 19.0 million boxes harvested across Washington and Oregon. FMI projects wider retail adoption of pre-conditioned Ripe Rite pears and banded 4-packs to drive steady supermarket sales across the United States through 2036.
India
Fresh pears industry in India is set to scale from USD 2.83 billion in 2026 to USD 5.51 billion by 2036, driven by a 6.9% CAGR and adding USD 2.68 billion in incremental market value. FMI finds that Indian market expansion is fueled by urban quick-commerce platforms and modern grocery chains expanding chilled imported Green Anjou and Packham assortments as well as domestic hill harvests and citrus fiber functional fruit lines. According to the USDA Foreign Agricultural Service India (December 2025) (IN2025-0064), Indian domestic fresh pear consumption reached 350,000 metric tons in marketing year 2025/26 as cold-storage corridors widened beyond tier-1 metros. FMI anticipates expanding reefers and urban grocery distribution to sustain India's category-leading growth rate through 2036.
South Korea
Sales of fresh pears throughout South Korea are projected to increase from USD 1.42 billion in 2026 to USD 2.71 billion by 2036, progressing at a 6.7% CAGR and creating USD 1.29 billion in additional revenue. FMI believes South Korean demand is attributed to recovering domestic orchard yields and high consumer willingness to pay for large-caliber, blemish-free pears in department-store and holiday gift assortments. Official harvest statistics from the Ministry of Data and Statistics South Korea (December 2025) confirm that national pear production rose 10.7% to 197,000 metric tons in 2025 compared with 178,000 metric tons in 2024. FMI expects improved controlled-atmosphere storage and premium retail grading to support South Korean revenue growth through 2036.
Germany
Consumption of fresh pears across Germany is estimated to climb from USD 1.18 billion in 2026 to USD 2.21 billion by 2036, reflecting a 6.5% CAGR and contributing USD 1.03 billion over the forecast decade. FMI's analysis indicates that because domestic German orchards cover only a fraction of national table-fruit demand, supermarket chains rely on coordinated European and overseas import programs with strict maturity and residue specifications. Agricultural data from the Federal Statistical Office of Germany Destatis (December 2025) shows that Germany's commercial pear harvest reached 42,290 metric tons in 2025, up 8.5% from 38,964 metric tons in 2024. In FMI's view, year-round supermarket demand for pre-ripened and organic pears will sustain German import orders through 2036.
Japan
Revenue generated by fresh pears suppliers in Japan is forecast to expand from USD 1.18 billion in 2026 to USD 2.19 billion by 2036, anchored by a 6.4% CAGR and generating USD 1.01 billion in new category sales. FMI notes that while domestic Nashi cultivars anchor autumn sales and specialty retailers expanding winter listings of conditioned western cultivars such as Green Anjou and La France owing to their buttery texture after chilling. International trade data from the USDA Foreign Agricultural Service (December 2025) highlights steady East Asian demand for high-brix, precision-graded table pears during the 2025/26 cycle. FMI projects premium gift-pack merchandising and bakery patisserie demand to sustain Japanese value growth through 2036.
Australia and New Zealand (ANZ)
Buyer procurement of fresh pears throughout Australia and New Zealand (ANZ) is tracking from USD 0.94 billion in 2026 to USD 1.80 billion by 2036, exhibiting a 6.7% CAGR and contributing USD 0.86 billion to national market value. FMI observes that growth across ANZ rests on Australian supermarkets prioritizing fresh-market pack-outs over canning allocations while New Zealand shippers scale high-value export cultivars. Industry statistics from Hort Innovation (February 2026) record 72,223 metric tons of Australian pear production in 2024/25 with 43,003 metric tons (59.5%) directed to fresh retail supply, while the New Zealand Ministry for Primary Industries (June 2025) documented ongoing post-cyclone orchard replanting into high-density trellis blocks in June 2025. FMI expects orchard modernization and pre-packed supermarket formats to drive ANZ revenue expansion through 2036.
Competitive Environment and Notable Companies
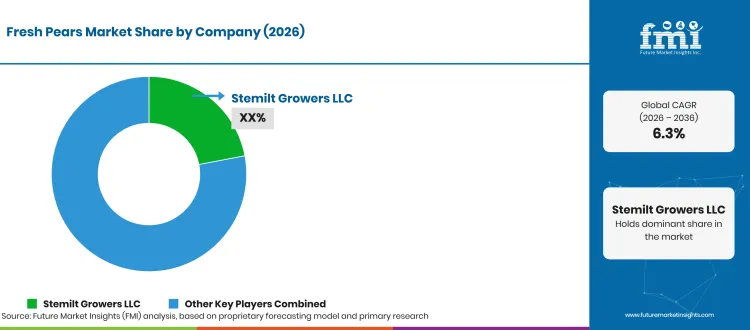
Notable companies operating in the global fresh pears market include Stemilt Growers LLC, Chelan Fresh, FirstFruits Farms, Washington Fruit Growers, CMI Orchards, Rainier Fruit Co., Giumarra Companies, Pacific Coast Fresh Company, Monson Fruit Co., and The Fruit Company. Competition centers on multi-generational Pacific Northwest grower-packers controlling automated optical sorting, controlled-atmosphere storage rooms, and thermal ripening chambers, and regional produce distributors and direct-to-consumer gift marketers.
How Are Companies Positioned in the Fresh Pears Market?
Stemilt Growers LLC (July 2025), Chelan Fresh (January 2026), FirstFruits Farms (January 2026), CMI Orchards (August 2026), and Rainier Fruit Co. (January 2026) operate as vertically integrated Washington and Oregon grower-packer-shippers supplying national retail chains with conventional and certified organic Green Anjou and Bartlett programs. Giumarra Companies (January 2026) and Pacific Coast Fresh Company (January 2026) provide multi-origin sourcing and wholesale distribution, while The Fruit Company (January 2026) specializes in direct-to-consumer Hood River pear gift boxes.
What Matters When a Buyer Selects a Fresh Pear Supplier?
Retail produce buyers qualify suppliers on thermal conditioning consistency, pressure-tested firmness at arrival, organic segregation compliance, and water-conserving packhouse operations. Stemilt Growers LLC (July 2025) backs its retail programs with Ripe Rite thermal conditioning, while Washington Fruit Growers (January 2026) documents Regenerative Organic Certified orchard management and in-line packhouse water filtration in Yakima Valley.
Which Capabilities Distinguish Product Offers?
Leading shippers differentiate through proprietary packaging formats and specialty cultivars that reduce retail shrink. Stemilt Growers LLC (October 2025) offers Prism Pears mixed-color bags, 4-count EZ Band packs, and Happi Pear cultivars; CMI Orchards (January 2026) markets branded Gem and Happy Bee pear packages; and Chelan Fresh (January 2026) supplies pouch bags and retail-ready display cartons.
How Does Geographic Reach Affect Competition?
Because Washington and Oregon produce88.0% of the United States fresh pear crop per USA Pears (August 2025), Pacific Northwest shippers anchor North American supply and export to Mexico and Canada. To maintain 12-month retail shelf presence during late spring and summer, marketers such as CMI Orchards (January 2026) and Giumarra Companies (January 2026) supplement domestic storage lots with counter-seasonal Southern Hemisphere pear imports.
| Verified Company Evidence (2025 to 2026) | Commercial Effect | Buyer Action |
|---|---|---|
| 8 October 2025: Stemilt Growers LLC launched Prism Pears mixed-variety bags and extended 4-count EZ Band packs to Green d'Anjou and red pears (Stemilt Growers LLC, October 2025). | Replaces high-shrink loose displays with fixed-weight UPC-scanned grab-and-go units. | Trial 4-count banded Green Anjou and mixed-color pouches to lift average basket size and cut bruising. |
| 22 July 2025: Stemilt Growers LLC commissioned a new pear packing line and expanded its Ripe Rite thermal conditioning program in Wenatchee, Washington (Stemilt Growers LLC, July 2025). | Delivers pears pre-conditioned to ripen within 3 to 4 days of purchase, improving repeat orders. | Specify thermal-conditioned winter Anjou lots in seasonal grocery procurement contracts. |
| 15 August 2026: CMI Orchards initiated early-August 2026 Pacific Northwest pear harvesting and expanded branded Gem pear retail packaging (CMI Orchards, August 2026). | Secures early-season retail shelf transitions and high-flavor specialty pear positioning. | Align late-summer planogram resets with early-harvest Northwest Bartlett, Starkrimson, and Gem shipments. |
Source: Verified corporate disclosures and Future Market Insights analysis, 2026.
| Company | Core Positioning | Verified Activity & Source Attribution |
|---|---|---|
| Stemilt Growers LLC | Wenatchee grower-packer-shipper; Rushing Rivers pears, Ripe Rite conditioning, EZ Band packs | Commissioned new pear packing line in July 2025 and launched Prism Pears and 4-count EZ Band packs in October 2025 (Stemilt Growers LLC, October 2025). |
| CMI Orchards | Washington tree-fruit marketer; Gem pears, Happy Bee pears, and Southern Hemisphere imports | Initiated early-August 2026 Pacific Northwest pear harvest and expanded 2026 Gem pear retail packaging (CMI Orchards, August 2026). |
| Chelan Fresh | Washington grower-owned marketer of conventional and certified organic Anjou and Bartlett pears | Supplies retail pouch bags and display-ready cartons backed by WSDA organic handler certification (Chelan Fresh, January 2026). |
| Washington Fruit Growers | Yakima Valley grower-aligned sales organization for conventional and organic pears | Operates water-recirculating pear packing lines and Regenerative Organic Certified orchard blocks in 2026 (Washington Fruit Growers, January 2026). |
| Rainier Fruit Co. | Multi-generational Washington grower-shipper of organic and conventional Green Anjou and Bartlett pears | Markets year-round controlled-atmosphere Green Anjou and organic pear programs to national grocery chains in 2026 (Rainier Fruit Co., January 2026). |
| FirstFruits Farms | Washington and Michigan tree-fruit grower-packer offering Bartlett, Anjou, and Bosc varieties | Supplies integrated Northwest and Midwest retail pear programs across United States grocery banners in 2026 (FirstFruits Farms, January 2026). |
| Giumarra Companies | Multi-origin produce marketer operating Giumarra Wenatchee for domestic and imported pears | Coordinates Pacific Northwest and Southern Hemisphere fresh pear programs for North American retailers (Giumarra Companies, January 2026). |
| Pacific Coast Fresh Company | Oregon and Washington wholesale fresh produce distributor with dedicated pear SKU catalog | Distributes graded Green Anjou, Red Anjou, and Bartlett cartons to Pacific Northwest retail and foodservice accounts (Pacific Coast Fresh Company, January 2026). |
| The Fruit Company | Hood River, Oregon direct-to-consumer orchardist and fresh pear gift-box marketer | Packs Oregon Comice, Green Anjou, and Red Anjou pears in seasonal consumer and corporate assortments (The Fruit Company, January 2026). |
Source: Verified corporate disclosures and Future Market Insights analysis, 2026.
Key takeaways
- Valued at USD 47.2 billion in 2026, on course for USD 86.9 billion by 2036.
- The decade adds USD 39.7 billion in new value at a 6.3% CAGR.
- The type segment is led by Conventional at 63.0% of 2026 revenue.
- 42.0% of application revenue goes to Fresh Consumption in 2026.
- India grows fastest at 6.9% CAGR, ahead of Australia and New Zealand at 6.7%.
Fresh Pears Market Report Scope and Research Methodology
FMI sizes the global fresh pears market by reconciling commercial orchard utilized production and cross-border fresh pear trade flows against retail supermarket scanner sales, wholesale produce market realizations, and fresh-fruit procurement by bakery and food-processing buyers. Revenue is recorded at the point of fresh-pear sale in each consuming country, ensuring that fresh pears purchased as raw inputs by bakeries or processors are valued strictly at the fresh-fruit transaction level while excluding downstream finished baked goods or canned pears concentrates. Segment and country figures are validated against national agricultural statistical bureaus, grower marketing orders, and corporate packhouse disclosures so that all sub-segments and countries sum to the global market total from 2026 to 2036.
| Coverage Field | Report Scope |
|---|---|
| Market definition | Revenue from fresh pears sold across retail, wholesale, foodservice, and fresh-input industrial channels. |
| Type segment | Conventional and Organic (Dominant: Conventional at 63.0% share in 2026; Other Segment Combined at 37.0%). |
| Application segment | Fresh Consumption, Bakery, Processed, and Others (Dominant: Fresh Consumption at 42.0% share in 2026; Other Segment Combined at 58.0%). |
| Product segment | Green Anjou, Red Anjou, Bartlet, and Red Bartlet (Dominant: Green Anjou at 42.0% share in 2026; Other Segment Combined at 58.0%). |
| Varieties included | Green d'Anjou, Red d'Anjou, Bartlett (Williams), Red Bartlett, plus regional commercial table pears reconciled within the four core product classes. |
| Packaging formats | Loose bulk display cartons, 4-count tension-banded packs (EZ Band), mixed-variety pouch bags, clamshells, and direct-to-consumer gift boxes. |
| End users | Household grocery shoppers, foodservice operators, commercial bakeries, and fresh-cut fruit processors. |
| Exclusions | Canned or jarred pears, pear puree and juice concentrates, dehydrated pear pieces, finished bakery items, and non-pear gift basket contents. |
| Quantitative units | USD billion for global and national market valuations. |
| Base and historical years | 2025 (Historical: USD 44.4 billion); 2026 (Estimated: USD 47.2 billion). |
| Forecast period | 2026 to 2036 (Projected 2036 valuation: USD 86.9 billion at a 6.3% CAGR). |
| Regions covered | North America, Latin America, Western Europe, Eastern Europe, East Asia, South Asia and Pacific, and Middle East and Africa. |
| Countries profiled | China, United States, India, South Korea, Germany, Japan, and Australia and New Zealand (ANZ). |
| Companies covered | Stemilt Growers LLC, Chelan Fresh, FirstFruits Farms, Washington Fruit Growers, CMI Orchards, Rainier Fruit Co., Giumarra Companies, Pacific Coast Fresh Company, Monson Fruit Co., and The Fruit Company. |
Source: Future Market Insights analysis of the fresh pears market, 2026.
Research Sources and Bibliography
- Chelan Fresh. (2026, January 15).Pear Packaging and Retail Merchandising Specifications. https://chelanfresh.com/for-the-trade/packaging/
- CMI Orchards. (2026, January 10).Gem Pears Retail Packaging and Varietal Profile. https://www.cmiorchards.com/gem
- CMI Orchards. (2026, January 12).Southern Hemisphere Counter-Seasonal Pear Import Program. https://www.cmiorchards.com/imports
- CMI Orchards. (2026, August 15).More Typical Pear Crop Expected From Pacific Northwest for 2026-2027 Season. https://www.cmiorchards.com/news-2026
- Federal Statistical Office of Germany Destatis. (2025, December 19).Areas and Quantities Harvested: Commercial Pear Production for the Market in 2025. https://www.destatis.de/EN/Themes/Economic-Sectors-Enterprises/Agriculture-Forestry-Fisheries/Fruit-Vegetables-Horticulture/Tables/2-4-areas-quantities-harvested.html
- FirstFruits Farms. (2026, January 14).Commercial Pear Varieties and Packing Program. https://firstfruits.com/our-fruit/pears/
- Giumarra Companies. (2026, January 18).Apples and Pears: Giumarra Wenatchee Operations. https://www.giumarra.com/giumarra-wenatchee
- Hort Innovation. (2026, February 10).Australian Horticulture Statistics Handbook 2024/25: All Fruit (Pears Supply Chain). https://www.horticulture.com.au/globalassets/hort-innovation/australian-horticulture-statistics-handbook/australian-horticulture-statistics-handbook-2024-25--fruit.pdf
- Ministry of Data and Statistics South Korea. (2025, December 24).Final Results of the Cultivated Area and Production of Apples and Pears in 2025. https://mods.go.kr/board.es?act=view&bid=11712&list_no=443925&mid=a20102060000&ref_bid=&tag=
- New Zealand Ministry for Primary Industries. (2025, June 15).Situation and Outlook for Primary Industries (SOPI) June 2025: Pome Fruit Recovery. https://www.mpi.govt.nz/dmsdocument/69612/direct
- Pacific Coast Fresh Company. (2026, January 20).Fresh Pear Product Catalog and Wholesale Distribution. https://www.pcfreshco.com/fruit/pear/
- Rainier Fruit Co. (2026, January 16).Conventional and Organic Green Anjou and Bartlett Pear Program. https://rainierfruit.com/pears
- Stemilt Growers LLC. (2025, July 22).Stemilt to Start Pear Season With New Packing Line and Ripening Program. https://www.bluebookservices.com/stemilt-to-start-pear-season-with-new-packing-line-ripening-program-and-category-investment/
- Stemilt Growers LLC. (2025, October 8).Stemilt Launches Two New Pear Packages: Prism Pears and 4-Count EZ Band. https://www.bluebookservices.com/stemilt-launches-two-new-pear-packages/
- The Fruit Company. (2026, January 22).Hood River Fresh Pear Assortment and Gift Box Specifications. https://www.thefruitcompany.com/products/thank-you-simply-fruit-basket
- USA Pears. (2025, August 27).A Bountiful Year for Fresh Pears: 2025 Pacific Northwest Harvest Report. https://www.usapears.org/a-bountiful-year-for-fresh-pears/
- USA Pears. (2025, December 18).USA Pears Take New York City by Storm for World Pear Day. https://www.usapears.org/usa-pears-take-new-york-city-by-storm-for-world-pear-day/
- USDA Foreign Agricultural Service. (2025, December 15).Fresh Apples and Grapes: World Markets and Trade. https://apps.fas.usda.gov/psdonline/circulars/fruit.pdf
- USDA Foreign Agricultural Service India. (2025, December 2).Fresh Deciduous Fruit Annual: India (IN2025-0064). https://apps.fas.usda.gov/newgainapi/api/Report/DownloadReportByFileName?fileName=Fresh+Deciduous+Fruit+Annual_New+Delhi_India_IN2025-0064
- USDA National Agricultural Statistics Service. (2026, May 1).Noncitrus Fruits and Nuts 2025 Summary (Fresh Pear Production). https://release.nass.usda.gov/reports/ncit0526.pdf
- Washington Fruit Growers. (2026, January 11).Sustainability, Regenerative Organic Certification, and Water-Recirculating Pear Packing. https://washfruitgrowers.com/sustainability/
- Washington State University Tree Fruit Research and Extension. (2026, January 8).Pear Harvest Maturity and Cold Conditioning Guidelines. https://treefruit.wsu.edu/web-article/pear-harvest/?print-view=true
Table of Content
- Key Takeaways
- Market Size and CAGR
- Top Growth Driver
- Fastest Growing Segment
- Leading Region
- Key Companies
- Emerging Opportunities
- Executive Summary
- Global Market Outlook
- Demand-side Trends
- Supply-side Trends
- Technology Roadmap Analysis
- Analysis and Recommendations
- Analyst Perspective (What is happening? Why now? What should investors know?)
- Key Questions Answered
- How large is the market?
- What is the CAGR?
- What are key trends?
- Which region dominates?
- Who are the leaders?
Read More...
- Market Overview
- Market Coverage / Taxonomy
- Market Definition / Scope / Limitations
- Research Methodology
- Chapter Orientation
- Analytical Lens and Working Hypotheses
- Market Structure, Signals, and Trend Drivers
- Benchmarking and Cross-market Comparability
- Market Sizing, Forecasting, and Opportunity Mapping
- Research Design and Evidence Framework
- Desk Research Programme (Secondary Evidence)
- Expert Input and Fieldwork (Primary Evidence)
- Tooling, Models, and Reference Databases
- Data Engineering and Model Build
- Quality Assurance and Audit Trail
- Market Background
- Market Dynamics (Drivers, Restraints, Opportunity, Trends)
- Scenario Forecast (Optimistic, Likely, Conservative)
- Impact Analysis
- AI Impact
- Sustainability Impact
- Regulatory Impact
- Technology Impact
- Consumer / Buyer Analysis
- Purchase Drivers
- Adoption Barriers
- Buyer Journey
- Opportunity Map Analysis
- Product Life Cycle Analysis
- Supply Chain Analysis
- Investment Feasibility Matrix
- Value Chain Analysis
- PESTLE and Porter's Analysis
- Regulatory Landscape
- Regional Parent Market Outlook
- Production and Consumption Statistics
- Import and Export Statistics
- Global Market Analysis and Forecast, 2021 to 2036
- Historical Market Size Value (USD Billion) Analysis, 2021 to 2025
- Current and Future Market Size Value (USD Billion) Projections, 2026 to 2036
- Y-o-Y Growth Trend Analysis
- Absolute $ Opportunity Analysis
- Global Market Pricing Analysis, 2021 to 2036
- Global Market Analysis and Forecast, By Type, 2021 to 2036
- Introduction / Key Findings
- Historical Market Size Value (USD Billion) Analysis By Type, 2021 to 2025
- Current and Future Market Size Value (USD Billion) Analysis and Forecast By Type, 2026 to 2036
- Conventional
- Organic
- Y-o-Y Growth Trend Analysis By Type, 2021 to 2025
- Absolute $ Opportunity Analysis By Type, 2026 to 2036
- Global Market Analysis and Forecast, By Application, 2021 to 2036
- Introduction / Key Findings
- Historical Market Size Value (USD Billion) Analysis By Application, 2021 to 2025
- Current and Future Market Size Value (USD Billion) Analysis and Forecast By Application, 2026 to 2036
- Fresh Consumption
- Bakery
- Processed
- Others
- Y-o-Y Growth Trend Analysis By Application, 2021 to 2025
- Absolute $ Opportunity Analysis By Application, 2026 to 2036
- Global Market Analysis and Forecast, By Product, 2021 to 2036
- Introduction / Key Findings
- Historical Market Size Value (USD Billion) Analysis By Product, 2021 to 2025
- Current and Future Market Size Value (USD Billion) Analysis and Forecast By Product, 2026 to 2036
- Green Anjou
- Red Anjou
- Bartlet
- Red Bartlet
- Y-o-Y Growth Trend Analysis By Product, 2021 to 2025
- Absolute $ Opportunity Analysis By Product, 2026 to 2036
- Global Market Analysis and Forecast, By Region, 2021 to 2036
- Introduction
- Historical Market Size Value (USD Billion) Analysis By Region, 2021 to 2025
- Current Market Size Value (USD Billion) Analysis and Forecast By Region, 2026 to 2036
- North America
- Western Europe
- East Asia
- South Asia and Pacific
- Market Attractiveness Analysis By Region
- North America Market Analysis and Forecast, By Country, 2021 to 2036
- Historical Market Size Value (USD Billion) Trend Analysis By Market Taxonomy, 2021 to 2025
- Market Size Value (USD Billion) Forecast By Market Taxonomy, 2026 to 2036
- By Country
- United States
- Canada
- By Type
- By Application
- By Product
- By Country
- Market Attractiveness Analysis
- By Country
- By Type
- By Application
- By Product
- Key Takeaways
- Western Europe Market Analysis and Forecast, By Country
- Historical Market Size Value (USD Billion) Trend Analysis By Market Taxonomy, 2021 to 2025
- Market Size Value (USD Billion) Forecast By Market Taxonomy, 2026 to 2036
- By Country
- United Kingdom
- Germany
- France
- By Type
- By Application
- By Product
- By Country
- Market Attractiveness Analysis
- By Country
- By Type
- By Application
- By Product
- Key Takeaways
- East Asia Market Analysis and Forecast, By Country
- Historical Market Size Value (USD Billion) Trend Analysis By Market Taxonomy, 2021 to 2025
- Market Size Value (USD Billion) Forecast By Market Taxonomy, 2026 to 2036
- By Country
- China
- Japan
- South Korea
- By Type
- By Application
- By Product
- By Country
- Market Attractiveness Analysis
- By Country
- By Type
- By Application
- By Product
- Key Takeaways
- South Asia and Pacific Market Analysis and Forecast, By Country
- Historical Market Size Value (USD Billion) Trend Analysis By Market Taxonomy, 2021 to 2025
- Market Size Value (USD Billion) Forecast By Market Taxonomy, 2026 to 2036
- By Country
- India
- Australia
- Rest of world aggregate
- By Type
- By Application
- By Product
- By Country
- Market Attractiveness Analysis
- By Country
- By Type
- By Application
- By Product
- Key Takeaways
- Key Countries Market Analysis
- United States
- Pricing Analysis
- Market Share Analysis, 2025
- By Type
- By Application
- By Product
- Canada
- Pricing Analysis
- Market Share Analysis, 2025
- By Type
- By Application
- By Product
- Germany
- Pricing Analysis
- Market Share Analysis, 2025
- By Type
- By Application
- By Product
- United Kingdom
- Pricing Analysis
- Market Share Analysis, 2025
- By Type
- By Application
- By Product
- France
- Pricing Analysis
- Market Share Analysis, 2025
- By Type
- By Application
- By Product
- India
- Pricing Analysis
- Market Share Analysis, 2025
- By Type
- By Application
- By Product
- China
- Pricing Analysis
- Market Share Analysis, 2025
- By Type
- By Application
- By Product
- Japan
- Pricing Analysis
- Market Share Analysis, 2025
- By Type
- By Application
- By Product
- South Korea
- Pricing Analysis
- Market Share Analysis, 2025
- By Type
- By Application
- By Product
- Australia
- Pricing Analysis
- Market Share Analysis, 2025
- By Type
- By Application
- By Product
- United States
- Market Structure Analysis
- Competition Dashboard
- Competition Benchmarking
- Market Share Analysis of Top Players
- By Regional
- By Type
- By Application
- By Product
- Emerging Startups
- Innovation Benchmarking
- Competition Analysis
- Competition Deep Dive
- Stemilt Growers LLC
- Overview
- Product Portfolio
- Profitability by Market Segments
- Sales Footprint
- Strategy Overview
- Marketing Strategy
- Product Strategy
- Channel Strategy
- CMI Orchards
- Chelan Fresh
- Washington Fruit Growers
- Rainier Fruit Co.
- FirstFruits Farms
- Giumarra Companies
- Pacific Coast Fresh Company
- The Fruit Company
- Stemilt Growers LLC
- Case Studies
- Success Stories
- Recent Developments
- Competition Deep Dive
- Assumptions & Acronyms Used
List of Tables
- Table 1: Global Market Value (USD Billion) Forecast by Region, 2021 to 2036
- Table 2: Global Market Value (USD Billion) Forecast by Type, 2021 to 2036
- Table 3: Global Market Value (USD Billion) Forecast by Application, 2021 to 2036
- Table 4: Global Market Value (USD Billion) Forecast by Product, 2021 to 2036
- Table 5: North America Market Value (USD Billion) Forecast by Country, 2021 to 2036
- Table 6: North America Market Value (USD Billion) Forecast by Type, 2021 to 2036
- Table 7: North America Market Value (USD Billion) Forecast by Application, 2021 to 2036
- Table 8: North America Market Value (USD Billion) Forecast by Product, 2021 to 2036
- Table 9: Western Europe Market Value (USD Billion) Forecast by Country, 2021 to 2036
- Table 10: Western Europe Market Value (USD Billion) Forecast by Type, 2021 to 2036
- Table 11: Western Europe Market Value (USD Billion) Forecast by Application, 2021 to 2036
- Table 12: Western Europe Market Value (USD Billion) Forecast by Product, 2021 to 2036
- Table 13: East Asia Market Value (USD Billion) Forecast by Country, 2021 to 2036
- Table 14: East Asia Market Value (USD Billion) Forecast by Type, 2021 to 2036
- Table 15: East Asia Market Value (USD Billion) Forecast by Application, 2021 to 2036
- Table 16: East Asia Market Value (USD Billion) Forecast by Product, 2021 to 2036
- Table 17: South Asia and Pacific Market Value (USD Billion) Forecast by Country, 2021 to 2036
- Table 18: South Asia and Pacific Market Value (USD Billion) Forecast by Type, 2021 to 2036
- Table 19: South Asia and Pacific Market Value (USD Billion) Forecast by Application, 2021 to 2036
- Table 20: South Asia and Pacific Market Value (USD Billion) Forecast by Product, 2021 to 2036
List of Figures
- Figure 1: Global Market Pricing Analysis
- Figure 2: Global Market Value (USD Billion) Forecast 2021-2036
- Figure 3: Global Market Value Share and BPS Analysis by Type, 2026 and 2036
- Figure 4: Global Market Y-o-Y Growth Comparison by Type, 2026-2036
- Figure 5: Global Market Attractiveness Analysis by Type
- Figure 6: Global Market Value Share and BPS Analysis by Application, 2026 and 2036
- Figure 7: Global Market Y-o-Y Growth Comparison by Application, 2026-2036
- Figure 8: Global Market Attractiveness Analysis by Application
- Figure 9: Global Market Value Share and BPS Analysis by Product, 2026 and 2036
- Figure 10: Global Market Y-o-Y Growth Comparison by Product, 2026-2036
- Figure 11: Global Market Attractiveness Analysis by Product
- Figure 12: Global Market Value (USD Billion) Share and BPS Analysis by Region, 2026 and 2036
- Figure 13: Global Market Y-o-Y Growth Comparison by Region, 2026-2036
- Figure 14: Global Market Attractiveness Analysis by Region
- Figure 15: North America Market Incremental Dollar Opportunity, 2026-2036
- Figure 16: Western Europe Market Incremental Dollar Opportunity, 2026-2036
- Figure 17: East Asia Market Incremental Dollar Opportunity, 2026-2036
- Figure 18: South Asia and Pacific Market Incremental Dollar Opportunity, 2026-2036
- Figure 19: North America Market Value Share and BPS Analysis by Country, 2026 and 2036
- Figure 20: North America Market Value Share and BPS Analysis by Type, 2026 and 2036
- Figure 21: North America Market Y-o-Y Growth Comparison by Type, 2026-2036
- Figure 22: North America Market Attractiveness Analysis by Type
- Figure 23: North America Market Value Share and BPS Analysis by Application, 2026 and 2036
- Figure 24: North America Market Y-o-Y Growth Comparison by Application, 2026-2036
- Figure 25: North America Market Attractiveness Analysis by Application
- Figure 26: North America Market Value Share and BPS Analysis by Product, 2026 and 2036
- Figure 27: North America Market Y-o-Y Growth Comparison by Product, 2026-2036
- Figure 28: North America Market Attractiveness Analysis by Product
- Figure 29: Western Europe Market Value Share and BPS Analysis by Country, 2026 and 2036
- Figure 30: Western Europe Market Value Share and BPS Analysis by Type, 2026 and 2036
- Figure 31: Western Europe Market Y-o-Y Growth Comparison by Type, 2026-2036
- Figure 32: Western Europe Market Attractiveness Analysis by Type
- Figure 33: Western Europe Market Value Share and BPS Analysis by Application, 2026 and 2036
- Figure 34: Western Europe Market Y-o-Y Growth Comparison by Application, 2026-2036
- Figure 35: Western Europe Market Attractiveness Analysis by Application
- Figure 36: Western Europe Market Value Share and BPS Analysis by Product, 2026 and 2036
- Figure 37: Western Europe Market Y-o-Y Growth Comparison by Product, 2026-2036
- Figure 38: Western Europe Market Attractiveness Analysis by Product
- Figure 39: East Asia Market Value Share and BPS Analysis by Country, 2026 and 2036
- Figure 40: East Asia Market Value Share and BPS Analysis by Type, 2026 and 2036
- Figure 41: East Asia Market Y-o-Y Growth Comparison by Type, 2026-2036
- Figure 42: East Asia Market Attractiveness Analysis by Type
- Figure 43: East Asia Market Value Share and BPS Analysis by Application, 2026 and 2036
- Figure 44: East Asia Market Y-o-Y Growth Comparison by Application, 2026-2036
- Figure 45: East Asia Market Attractiveness Analysis by Application
- Figure 46: East Asia Market Value Share and BPS Analysis by Product, 2026 and 2036
- Figure 47: East Asia Market Y-o-Y Growth Comparison by Product, 2026-2036
- Figure 48: East Asia Market Attractiveness Analysis by Product
- Figure 49: South Asia and Pacific Market Value Share and BPS Analysis by Country, 2026 and 2036
- Figure 50: South Asia and Pacific Market Value Share and BPS Analysis by Type, 2026 and 2036
- Figure 51: South Asia and Pacific Market Y-o-Y Growth Comparison by Type, 2026-2036
- Figure 52: South Asia and Pacific Market Attractiveness Analysis by Type
- Figure 53: South Asia and Pacific Market Value Share and BPS Analysis by Application, 2026 and 2036
- Figure 54: South Asia and Pacific Market Y-o-Y Growth Comparison by Application, 2026-2036
- Figure 55: South Asia and Pacific Market Attractiveness Analysis by Application
- Figure 56: South Asia and Pacific Market Value Share and BPS Analysis by Product, 2026 and 2036
- Figure 57: South Asia and Pacific Market Y-o-Y Growth Comparison by Product, 2026-2036
- Figure 58: South Asia and Pacific Market Attractiveness Analysis by Product
- Figure 59: Global Market - Tier Structure Analysis
- Figure 60: Global Market - Company Share Analysis
Frequently Asked Questions
How big is the fresh pears market in 2026?
Future Market Insights estimates the global fresh pears market valuation at USD 47.2 billion in 2026, advancing from USD 44.4 billion in 2025 across retail and foodservice channels.
How fast is the fresh pears market expected to grow through 2036?
FMI projects the global fresh pears market to expand at a 6.3% CAGR from 2026 to 2036, reaching USD 86.9 billion by 2036 and generating USD 39.7 billion in incremental revenue.
Which Type segment leads the fresh pears market?
Conventional fresh pears represent 63.0% of Type revenue in 2026, anchored by established commercial orchard scale and accessible retail grocery price points.
Which Application segment leads the fresh pears market?
Fresh Consumption accounts for 42.0% of Application revenue in 2026, as whole-fruit grocery displays command premium fresh-market grade pricing.
Which Product segment leads the fresh pears market?
Green Anjou generates 42.0% of Product revenue in 2026, supported by long controlled-atmosphere storage life and consistent winter retail grocery availability.
Which country is the largest fresh pears market?
China is the largest national market globally, capturing 45.0% of global revenue in 2026 (USD 21.24 billion) and projected to reach USD 40.25 billion by 2036.
Which countries are expected to grow fastest in the fresh pears market?
India is projected to grow fastest at a 6.9% CAGR from 2026 to 2036, followed by Australia and New Zealand (ANZ) and South Korea at 6.7% CAGR each.
What drives demand for fresh pears?
Demand rests on year-round retail availability of firm, bruise-free table fruit, reinforced by packhouse thermal conditioning programs, fixed-count banded packaging, and recovering Pacific Northwest and South Korean harvests.
Preview the report firsthand - request a free sample
Get SampleGet the brochure for pricing and purchase details.
Get PDF
