Reports

- Global Locations -

Headquarters

Future Market Insights, Inc.

Christiana Corporate, 200
Continental Drive, Suite 401,
Newark, Delaware - 19713,
United States

T: +1-845-579-5705

Americas

Future Market Insights, Inc.

616 Corporate Way, Suite 2-9018,
Valley Cottage, NY 10989, United States

T: +1-347-918-3531

MEA

Future Market Insights

1602-6 Jumeirah Bay X2 Tower, Plot No: JLT-PH2-X2A,
Jumeirah Lakes Towers, Dubai,
United Arab Emirates

Europe

Future Market Insights

3rd Floor, 207 Regent Street,
W1B 3HH London
United Kingdom

T: + 44 (0) 20 8123 9659
D: +44 (0) 20 3287 4268

Asia Pacific

Future Market Insights

IndiaLand Global Tech Park, Unit UG-1, Behind Grand HighStreet, Phase 1, Hinjawadi, MH, Pune – 411057, India

Insights into Herpes Labialis Treatment Market: Emerging Strategies and Market Outlook (2023 to 2033)

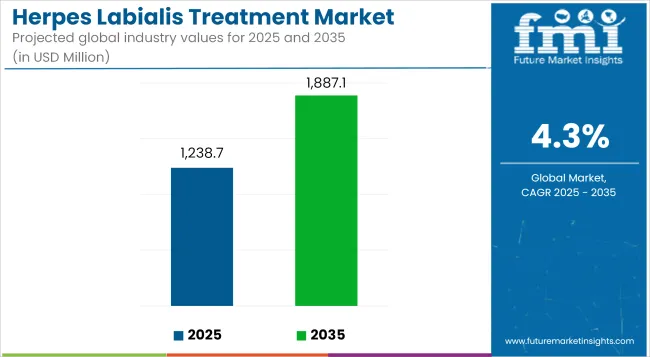
The global demand for herpes labialis treatment t is likely to register a CAGR of 4.7% between 2023 and 2033. FMI estimates that the global herpes labialis treatment market size could reach US$ 1.79 billion by 2033, up from US$ 1.13 billion in 2023. The high prevalence of herpes labialis simplex virus infections, especially oral herpes, is responsible for the expansion.

Herpes labialis, commonly termed oral herpes, is a mouth infection that results in the development of minute and uncomfortable blisters on the lips, gums, or neck. The herpes simplex virus, which is common and highly infectious and infects plenty of people in North America by the age of 20, is the source of these blisters. The infection is frequently brought on by Herpes Simplex Virus type 1 (HSV-1), although it can also be brought on by Herpes Simplex Virus type 2 (HSV-2).

Since herpes labialis infections are becoming more common globally, the herpes labialis treatment market has seen a surge in growth lately. The HSV-1 virus, which is the main cause of herpes labialis, is suspected of impacting 3.7 billion individuals under the age of 50. Based on a report from the World Health Organization in 2020.

Herpes labialis should always be diagnosed and treated as soon as possible to control the symptoms and stop the infection from spreading. More people are seeking immediate medical attention for herpes labialis. As a result of increased awareness of the significance of early diagnosis and treatment, leading to market expansion.

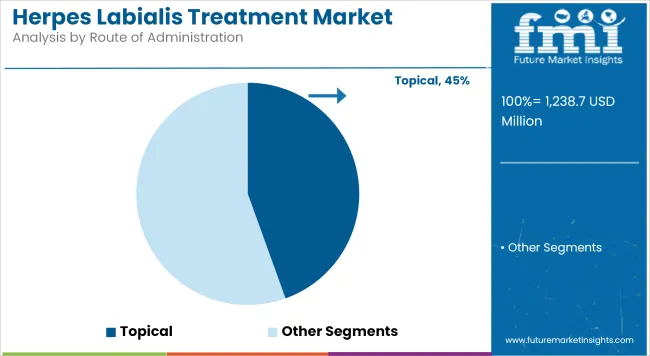
Herpes labialis is commonly treated with topical antiviral creams like acyclovir, penciclovir, and docosanol. Given their ease of use and comfort, these creams offer targeted therapy and are appreciated by patients. Topical antiviral creams are increasingly being used as the first line of therapy for herpes labialis, and this trend is anticipated to continue boosting the sales of these products.

Herpes labialis symptoms are also increasingly managed using over-the-counter (OTC) medicines such as lotions, ointments, and lip balms. These are well-liked by customers since they are easily available and can be purchased without a prescription. The demand for these products is anticipated to be driven by the tendency of self-medication and the increased availability of OTC medications in various retail channels.

Herpes labialis is also being treated with combination therapy, which includes antiviral drugs with topical creams or other treatment modalities, such as corticosteroids. There is potential for the development of groundbreaking combination treatments that could lead to better results in terms of symptom alleviation, a decrease in the frequency of outbreaks, and faster healing.

To provide affordable pharmaceuticals for the treatment of viral infections, several manufacturers are emphasizing the approval and introduction of generic treatments in developing countries. Hence, the increasing advancements in the prevention of herpes labialis infection are likely to present producers of herpes labialis medications with promising opportunities. For instance, Perrigo stated in February 2019 that a generic version of Bausch Health's Zovirax (acyclovir) cream has received FDA clearance and an AB rating.

Attributes Details
Herpes Labialis Treatment Market Value (2023) US$ 1.13 billion
Herpes Labialis Treatment Market Expected Value (2033) US$ 1.79 billion
Herpes Labialis Treatment Market Projected CAGR (2023 to 2033) 4.7%

Don't pay for what you don't need

Customize your report by selecting specific countries or regions and save 30%!

2018 to 2022 Herpes Labialis Treatment Market Outlook Compared to 2023 to 2033 Forecast

The herpes labialis treatment market expanded at a CAGR of 4.2% between 2018 and 2022.

A few of the primary drivers behind the market growth:

  • The growing incidence of HSV infections
  • The seismic shift in governments towards precautionary treatment options for infectious diseases
  • Increased investments in research and development activities by both governmental authorities and key market participants

Depending on the individual, the frequency and intensity of herpes labialis outbreaks could vary. Around 20–40% of people with recurrent herpes labialis could suffer outbreaks at least once each year, based on certain research. Whereas others could experience less frequent recurrences. The United States Food and Drug Administration announced the updated recommendations for the development of antiviral medications, especially for the treatment of recurrent herpes labialis in November 2017. These recommendations were developed to aid in the investigation of safety testing, which is crucial for the approval of any antiviral medication.

  • Short Term (2023 to 2026): During this timeframe, demand for antiviral drugs like acyclovir, valacyclovir, and famciclovir that are used to treat herpes labialis is anticipated to increase. With growing understanding and improved access to healthcare, these drugs are frequently given for controlling infections and minimizing the duration and severity of symptoms. Short-term growth is also projected for topical creams containing antiviral ingredients such as docosanol and penciclovir. Patients frequently choose these creams because they can help lessen discomfort and speed up recovery.
  • Medium Term (2026 to 2029): The discovery of radical treatments for herpes labialis could provide prospects for mid-term growth. This could involve brand-new antiviral medications with enhanced effectiveness and safety profiles. As well as innovative therapeutic approaches like gene therapy or immunotherapies that specifically target the herpes simplex virus (HSV). The market expansion could be further influenced by telemedicine and digital health solutions. Patients in underdeveloped regions could have easier access to treatment alternatives owing to remote medical consultations, telemedicine, and online pharmacy services. This is likely to raise the demand for herpes labialis treatment.
  • Long Term (2029 to 2033): Developing and approving efficient herpes labialis vaccines could bring about sizable long-term business potential. Although there is presently no HSV vaccine on the market, future research on HSV vaccines has the potential to completely change how herpes labialis is treated and prevented. Customized herpes labialis treatment regimens based on a patient's genetic profile, immunological response, and other unique variables. This could be possible owing to developments in personalized medicine, such as genetic testing and precision medicine methods.

FMI expects the herpes labialis treatment market may expand at a CAGR of 4.7% during the forecast period.

Comparative Analysis of the Adjacent Market

Herpes Labialis Treatment Market:

Differentiating Aspects Herpes Labialis Treatment Market
CAGR (2023 to 2033) 4.7%
Market Valuation in 2023 US$ 1.13 billion
Projected Market Value in 2033 US$ 1.79 billion
Growth Factors Growing awareness about the availability of various treatment options
Opportunities Rising focus on the development of new treatment approaches like gene editing
Key Trends Increasing use of systemic antiviral drugs for severe and recurrent cases

Herpes Simplex Virus Treatment Market:

Differentiating Aspects Herpes Simplex Virus Treatment Market
CAGR (2023 to 2033) 9.2%
Market Valuation in 2023 US$ 1.68 billion
Projected Market Value in 2033 US$ 4.05 billion
Growth Factors Growing demand for antiviral medications for HSV infections management
Opportunities Rising focus on personalized and precision healthcare for individualized HSV treatment
Key Trends Increasing adoption of unconventional treatment options like naturopathy

Antiviral Drugs Market:

Differentiating Aspects Antiviral Drugs Market
CAGR (2023 to 2033) 3.2%
Market Valuation in 2023 US$ 42.26 billion
Projected Market Value in 2033 US$ 57.90 billion
Growth Factors Rising cognizance about the prominence of early diagnosis and treatment
Opportunities Growing focus on combination drug therapies for superior antiviral efficacy
Key Trends Increasing usage of antiviral drugs for prophylactic purposes in high-risk populations
Sabyasachi Ghosh
Sabyasachi Ghosh

Principal Consultant

Talk to Analyst

Find your sweet spots for generating winning opportunities in this market.

Exploring the Regional Patterns of the Herpes Labialis Treatment Market: An In-depth Examination at the Country Level

Is the Herpes Labialis Treatment in the United States Progressing with Promising Innovations?

The dominance of North America over other regions of the global market is anticipated to increase with the presence of numerous notable companies in the region. In 2022, the United States accounted for around 92% share of the North America herpes labialis treatment market. This can be ascribed to increased use of premium herpes medications, rising healthcare expenditure, an increase in the introduction of generic medications, and supportive reimbursement policies.

By establishing criteria for the safety and effectiveness of therapies, the United States Food and Drug Administration plays a critical role in regulating the herpes labialis treatment industry. In recent years, the United States FDA has authorized many novel medications and herpes labialis therapy alternatives. For instance, the FDA authorized the topical cream Xerese (acyclovir and hydrocortisone) in 2020 for the treatment of recurrent herpes labialis in immunocompetent individuals. With receiving this clearance, patients with herpes labialis in the United States now have more treatment alternatives.

The United States herpes labialis treatment market is also being driven by variables including rising disease prevalence, an aging and immunocompromised population, and an increase in serological testing for herpes infection. For instance, the CDC estimates that in the United States, 11.9% of individuals between the ages of 11 and 49 are infected. The commencement of an observational clinical study for recurrent HSV-2 infection with 200 patients for the company's product RVx-001-PSS was announced by Rational Vaccines Inc. in August 2022.

Market participants in the United States have joined forces and made acquisitions to diversify their product portfolios and increase their market share. For instance, TESARO Inc., a biopharmaceutical business with a pipeline of experimental cancer therapies, including a possible therapy for herpes labialis, was obtained by GlaxoSmithKline (GSK) in 2020. These partnerships and purchases may help the market generate new and better therapeutic solutions.

What Innovations are Altering the Landscape of Herpes Labialis Treatment in Germany?

Germany held about 22% share of the Western Europe herpes labialis treatment market in the year 2022. The Germany herpes labialis treatment market is experiencing growth since there is a growing patient population with HSV infections and improved facilities for healthcare. According to the Robert Koch Institute, the estimated prevalence of HSV-1 infection, which is a common cause of herpes labialis, in Germany is around 60-90% of the population.

The utilization and approval of drugs for herpes labialis are governed by Germany regulatory agencies. Such as the Federal Institute for Drugs and Medical Devices and the Paul-Ehrlich Institute. These guidelines make sure that the treatment alternatives on the market are both safe and efficient, as well as meeting the required levels of quality, which in turn increases public confidence in the market.

Recent developments in the production of antiviral drugs and topical creams for the treatment of herpes labialis have occurred in Germany. Also, there has been an increase in demand for herbal and natural treatments in Germany for the treatment of herpes labialis. Players in the market are developing products with natural components renowned for their antiviral characteristics, such as tea tree oil and lemon balm.

Are Herpes Labialis Patients in China Finding Hope in New Therapies?

China accounted for 44.3% share 2022 of the Asia Pacific herpes labialis treatment market. Herpes labialis is becoming more common in China, which has increased the demand for effective treatment alternatives and fueled market expansion. Given government investments in enhancing healthcare infrastructure and facilities, China has seen a growth in healthcare expenditure. The market has grown as a consequence of easier access to healthcare services, especially those for herpes labialis diagnosis and treatment.

China herpes labialis treatment market is expected to expand at a CAGR of 6.1% from 2023 to 2033. Herpes labialis is one of several illnesses that are commonly treated in China with Traditional Chinese medicine (TCM). Herbal medications, acupuncture, and other TCM-based treatments have grown increasingly well-liked in China because many believe they work better and have fewer adverse effects than conventional therapies. This has increased demand in China for TCM-based herpes labialis therapies.

The herpes labialis treatment industry in China is actively occupied by numerous both local and international pharmaceutical companies, fostering competition and innovation. For instance, the National Medical Products Administration (NMPA) granted permission to Livzon Pharmaceutical Group Inc. In 2019 for their acyclovir cream, which is used to treat herpes labialis. Livzon is a well-known pharmaceutical business in China.

Exploring the Herpes Labialis Treatment Market: An In-depth Segment Analysis

Why is the Demand for Acyclovir Drugs for Treating Herpes Labialis Increasing?

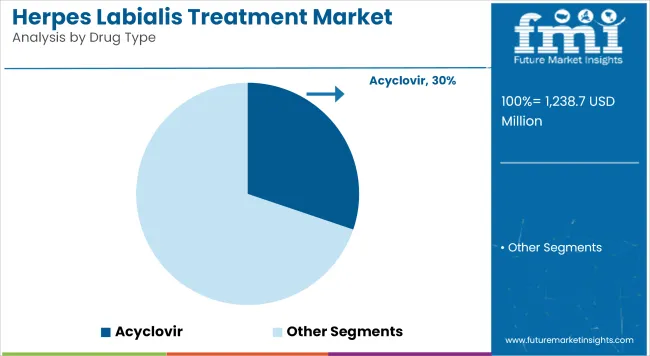
The commonly prescribed medication for treating cold sores is acyclovir. Thus, sales of acyclovir are projected to expand at a CAGR of 5.1% over the forecast period. Acyclovir functions by preventing the HSV from replicating, lessening the severity and length of outbreaks, and easing symptoms like pain and suffering related to cold sores. Patients can easily and conveniently get acyclovir since it comes in a variety of forms, including topical creams, ointments, and oral pills.

Healthcare professionals and individuals are becoming more knowledgeable about herpes labialis. As a result, the advantages of acyclovir in treating the illness are becoming more widely acknowledged. Acyclovir is now being given for herpes labialis more frequently as a result, which has raised the demand for the medication in the market.

Why do Hospitals Contribute to Maximum Market Share by Distribution Channels?

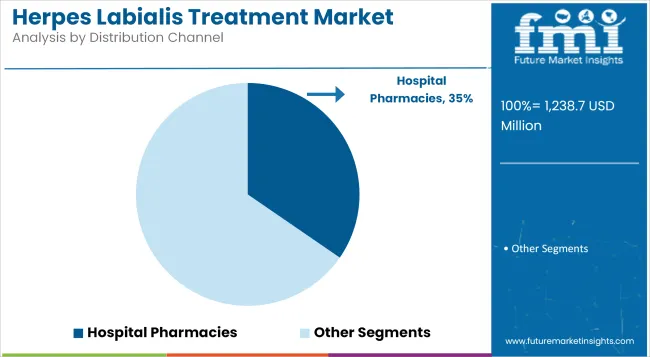
The hospitals segment held a 35.4% market share in terms of distribution in 2022, showing strong sales of herpes labialis treatment medications through hospital pharmacies. The expansion could additionally be attributed to the availability of comprehensive treatment and expert medical personnel in hospitals. With expertise in diagnosis and treatment, hospitals offer a wide range of options including antiviral medications, pain management, and supportive therapies.

Hospitals keep up with the recent developments in the industry because they have cutting-edge diagnostic equipment and facilities. Given their reliability, hospitals are frequently preferred by patients for herpes labialis therapy. The inclusion of hospitals in insurance coverage plans and their referral network from other healthcare providers also help to increase their market share.

Get the data you need at a Fraction of the cost

Personalize your report by choosing insights you need
and save 40%!

Herpes Labialis Treatment Market: Analyzing Key Players, Strategies, and Market Share in the Global Landscape

Company GlaxoSmithKline
Development Shingrix, a recombinant herpes zoster vaccine produced by GlaxoSmithKline, received FDA clearance in the United States in July 2021. When an adult over the age of 18 is in danger of getting herpes zoster owing to any known immunosuppressive factors, this can be utilized as a preventative measure.
Strategy GSK's strategy for Shingrix includes identifying the target market of immunosuppressed adults at risk for shingles and comprehending their requirements and preferences. It also focuses on pricing the vaccine competitively and putting in place marketing initiatives to increase awareness and encourage adoption.
Company Amneal Pharmaceuticals, LLC
Development In November 2020, for the prevention of recurrent herpes labialis (cold sores) in immunocompetent individuals who are 12 years of age and older, Amneal Pharmaceuticals, LLC officially declared that the FDA has accepted its Abbreviated New Drug Application (ANDA) for Acyclovir Cream, 5%, the substitute for Zovirax.
Strategy Amneal Pharmaceuticals, LLC aims to gain ground in the market for preventing recurrent herpes labialis. The approach focuses on offering a cost-effective substitute for the branded medicine while leveraging the existing market need for herpes labialis treatments, with a target audience of immunocompetent adults aged 12 and older.
Company Bayer AG
Development Bayer AG started the investigation for the treatment of herpes labialis in patients with a healthy immune system using the sitavig (acyclovir) buccal tablet. It also reported that it is undertaking Phase 3 clinical investigations in June 2022. By October 2023, the study is anticipated to be finished.
Strategy With a strategic focus on completing its clinical studies and securing regulatory permission for commercialization, Bayer AG appears to be actively encouraging the development of Sitavig as a potential therapy for this disease.
Company GC Biopharma Inc.
Development GC Biopharma Inc. unveiled Pojinen cream, an OTC medication, in January 2022 as a combined treatment for recurrent herpes labialis. The cream includes 10mg/g of hydrocortisone, which has anti-inflammatory qualities, and 50mg/g of acyclovir, which stops the herpes virus from multiplying. The combination of these substances aims to shorten the typical treatment period.
Strategy The goal of GC Biopharma Inc. is to reduce the duration of medication for recurrent herpes labialis by offering a combination treatment approach that tackles both viral replication and inflammation. Moreover, it distinguishes itself by a dual-action strategy, a focus on effectiveness, and comprehensive customer education.

How can Manufacturers Expand in the Herpes Labialis Treatment Market?

Expanding in the herpes labialis treatment market can be challenging given the competitive landscape and regulatory requirements. Nonetheless, there are several strategies that market players can consider to increase their presence in the market:

  • Invest in research and development to develop innovative and effective treatments.
  • Establish market strategies, pricing, and distribution channels that are customized to the demands of potential customer categories.
  • Build resilient relationships with healthcare professionals including dermatologists, dentists, and general physicians to promote brand visibility and referrals.
  • Collaborate with experts in the field of herpes labialis to gain credibility and endorsement for products.
  • Identify and target specific segments of the market based on age groups, demographics, or geographical regions.
  • Keep up with regulatory standards and make sure that herpes labialis therapies are in line with regulations at the national and international levels.
  • Monitor and adapt to market trends, including changes in consumer preferences, competitive landscape, and technological advancements.
  • Offer first-rate customer service, including patient support programs to foster client loyalty and trust.

Key Companies

  • Novartis AG
  • Valeant Pharmaceuticals International Inc. (Bausch Health)
  • Teva Pharmaceuticals Industries Ltd.
  • Bayer AG
  • Sun Pharmaceuticals
  • Abbott Laboratories
  • Amneal Pharmaceuticals, LLC
  • Mylan N.V.
  • Pfizer Inc.
  • GlaxoSmithKline PLC.
  • Dr. Reddy’s Laboratories
  • GC Biopharma Inc.

Herpes Labialis Treatment Industry Segmentation

By Drug Type:

  • Acyclovir
  • Valacyclovir
  • Penciclovir
  • Famciclovir
  • Docosanol

By Route of Administration:

  • Oral
  • Topical
  • Combination

By Distribution Channel:

  • Hospital Pharmacies
  • Retail Pharmacies
  • Drug Stores
  • Online Pharmacies

By Region:

  • North America
  • Latin America
  • Western Europe
  • Eastern Europe
  • Asia Pacific excluding Japan
  • Japan
  • The Middle East & Africa

Frequently Asked Questions

How Big is the Herpes Labialis Treatment Market? 

The market is valued at US$ 1.1 billion in 2023. 

Who are the Key Performers of the Market? 

Novartis AG, and Teva Pharmaceuticals Industries Ltd. are key market players. 

What is the CAGR from 2023 to 2033? 

The market’s CAGR from 2023 to 2033 will be 4.7%. 

What Players will Sustain Success in the Market? 

Rising use of systemic antiviral drugs for severe and recurrent cases.

Which is the Key Segment by Drug Type in the Market? 

Acyclovir segment is likely to remain preferred through 2033. 

Table of Content

1. Executive Summary | Herpes Labialis Treatment Market 

    1.1. Global Market Outlook

    1.2. Demand-side Trends

    1.3. Supply-side Trends

    1.4. Technology Roadmap Analysis

    1.5. Analysis and Recommendations

2. Market Overview

    2.1. Market Coverage / Taxonomy

    2.2. Market Definition / Scope / Limitations

3. Market Background

    3.1. Market Dynamics

        3.1.1. Drivers

        3.1.2. Restraints

        3.1.3. Opportunity

        3.1.4. Trends

    3.2. Scenario Forecast

        3.2.1. Demand in Optimistic Scenario

        3.2.2. Demand in Likely Scenario

        3.2.3. Demand in Conservative Scenario

    3.3. Opportunity Map Analysis

    3.4. Investment Feasibility Matrix

    3.5. PESTLE and Porter’s Analysis

    3.6. Regulatory Landscape

        3.6.1. By Key Regions

        3.6.2. By Key Countries

    3.7. Regional Parent Market Outlook

4. Global Market Analysis 2018 to 2022 and Forecast, 2023 to 2033

    4.1. Historical Market Size Value (US$ Million) Analysis, 2018 to 2022

    4.2. Current and Future Market Size Value (US$ Million) Projections, 2023 to 2033

        4.2.1. Y-o-Y Growth Trend Analysis

        4.2.2. Absolute $ Opportunity Analysis

5. Global Market Analysis 2018 to 2022 and Forecast 2023 to 2033, By Drug Type

    5.1. Introduction / Key Findings

    5.2. Historical Market Size Value (US$ Million) Analysis By Drug Type, 2018 to 2022

    5.3. Current and Future Market Size Value (US$ Million) Analysis and Forecast By Drug Type, 2023 to 2033

        5.3.1. Acyclovir

        5.3.2. Valacyclovir

        5.3.3. Penciclovir

        5.3.4. Famciclovir

        5.3.5. Docosanol

    5.4. Y-o-Y Growth Trend Analysis By Drug Type, 2018 to 2022

    5.5. Absolute $ Opportunity Analysis By Drug Type, 2023 to 2033

6. Global Market Analysis 2018 to 2022 and Forecast 2023 to 2033, By Route of Administration

    6.1. Introduction / Key Findings

    6.2. Historical Market Size Value (US$ Million) Analysis By Route of Administration, 2018 to 2022

    6.3. Current and Future Market Size Value (US$ Million) Analysis and Forecast By Route of Administration, 2023 to 2033

        6.3.1. Oral

        6.3.2. Topical

        6.3.3. Combination

    6.4. Y-o-Y Growth Trend Analysis By Route of Administration, 2018 to 2022

    6.5. Absolute $ Opportunity Analysis By Route of Administration, 2023 to 2033

7. Global Market Analysis 2018 to 2022 and Forecast 2023 to 2033, By Distribution Channel

    7.1. Introduction / Key Findings

    7.2. Historical Market Size Value (US$ Million) Analysis By Distribution Channel, 2018 to 2022

    7.3. Current and Future Market Size Value (US$ Million) Analysis and Forecast By Distribution Channel, 2023 to 2033

        7.3.1. Hospital Pharmacies

        7.3.2. Retail Pharmacies

        7.3.3. Online Pharmacies

    7.4. Y-o-Y Growth Trend Analysis By Distribution Channel, 2018 to 2022

    7.5. Absolute $ Opportunity Analysis By Distribution Channel, 2023 to 2033

8. Global Market Analysis 2018 to 2022 and Forecast 2023 to 2033, By Region

    8.1. Introduction

    8.2. Historical Market Size Value (US$ Million) Analysis By Region, 2018 to 2022

    8.3. Current Market Size Value (US$ Million) Analysis and Forecast By Region, 2023 to 2033

        8.3.1. North America

        8.3.2. Latin America

        8.3.3. Europe

        8.3.4. South Asia

        8.3.5. East Asia

        8.3.6. Oceania

        8.3.7. MEA

    8.4. Market Attractiveness Analysis By Region

9. North America Market Analysis 2018 to 2022 and Forecast 2023 to 2033, By Country

    9.1. Historical Market Size Value (US$ Million) Trend Analysis By Market Taxonomy, 2018 to 2022

    9.2. Market Size Value (US$ Million) Forecast By Market Taxonomy, 2023 to 2033

        9.2.1. By Country

            9.2.1.1. The USA

            9.2.1.2. Canada

        9.2.2. By Drug Type

        9.2.3. By Route of Administration

        9.2.4. By Distribution Channel

    9.3. Market Attractiveness Analysis

        9.3.1. By Country

        9.3.2. By Drug Type

        9.3.3. By Route of Administration

        9.3.4. By Distribution Channel

    9.4. Key Takeaways

10. Latin America Market Analysis 2018 to 2022 and Forecast 2023 to 2033, By Country

    10.1. Historical Market Size Value (US$ Million) Trend Analysis By Market Taxonomy, 2018 to 2022

    10.2. Market Size Value (US$ Million) Forecast By Market Taxonomy, 2023 to 2033

        10.2.1. By Country

            10.2.1.1. Brazil

            10.2.1.2. Mexico

            10.2.1.3. Rest of Latin America

        10.2.2. By Drug Type

        10.2.3. By Route of Administration

        10.2.4. By Distribution Channel

    10.3. Market Attractiveness Analysis

        10.3.1. By Country

        10.3.2. By Drug Type

        10.3.3. By Route of Administration

        10.3.4. By Distribution Channel

    10.4. Key Takeaways

11. Europe Market Analysis 2018 to 2022 and Forecast 2023 to 2033, By Country

    11.1. Historical Market Size Value (US$ Million) Trend Analysis By Market Taxonomy, 2018 to 2022

    11.2. Market Size Value (US$ Million) Forecast By Market Taxonomy, 2023 to 2033

        11.2.1. By Country

            11.2.1.1. Germany

            11.2.1.2. United Kingdom

            11.2.1.3. France

            11.2.1.4. Spain

            11.2.1.5. Italy

            11.2.1.6. Rest of Europe

        11.2.2. By Drug Type

        11.2.3. By Route of Administration

        11.2.4. By Distribution Channel

    11.3. Market Attractiveness Analysis

        11.3.1. By Country

        11.3.2. By Drug Type

        11.3.3. By Route of Administration

        11.3.4. By Distribution Channel

    11.4. Key Takeaways

12. South Asia Market Analysis 2018 to 2022 and Forecast 2023 to 2033, By Country

    12.1. Historical Market Size Value (US$ Million) Trend Analysis By Market Taxonomy, 2018 to 2022

    12.2. Market Size Value (US$ Million) Forecast By Market Taxonomy, 2023 to 2033

        12.2.1. By Country

            12.2.1.1. India

            12.2.1.2. Malaysia

            12.2.1.3. Singapore

            12.2.1.4. Thailand

            12.2.1.5. Rest of South Asia

        12.2.2. By Drug Type

        12.2.3. By Route of Administration

        12.2.4. By Distribution Channel

    12.3. Market Attractiveness Analysis

        12.3.1. By Country

        12.3.2. By Drug Type

        12.3.3. By Route of Administration

        12.3.4. By Distribution Channel

    12.4. Key Takeaways

13. East Asia Market Analysis 2018 to 2022 and Forecast 2023 to 2033, By Country

    13.1. Historical Market Size Value (US$ Million) Trend Analysis By Market Taxonomy, 2018 to 2022

    13.2. Market Size Value (US$ Million) Forecast By Market Taxonomy, 2023 to 2033

        13.2.1. By Country

            13.2.1.1. China

            13.2.1.2. Japan

            13.2.1.3. South Korea

        13.2.2. By Drug Type

        13.2.3. By Route of Administration

        13.2.4. By Distribution Channel

    13.3. Market Attractiveness Analysis

        13.3.1. By Country

        13.3.2. By Drug Type

        13.3.3. By Route of Administration

        13.3.4. By Distribution Channel

    13.4. Key Takeaways

14. Oceania Market Analysis 2018 to 2022 and Forecast 2023 to 2033, By Country

    14.1. Historical Market Size Value (US$ Million) Trend Analysis By Market Taxonomy, 2018 to 2022

    14.2. Market Size Value (US$ Million) Forecast By Market Taxonomy, 2023 to 2033

        14.2.1. By Country

            14.2.1.1. Australia

            14.2.1.2. New Zealand

        14.2.2. By Drug Type

        14.2.3. By Route of Administration

        14.2.4. By Distribution Channel

    14.3. Market Attractiveness Analysis

        14.3.1. By Country

        14.3.2. By Drug Type

        14.3.3. By Route of Administration

        14.3.4. By Distribution Channel

    14.4. Key Takeaways

15. MEA Market Analysis 2018 to 2022 and Forecast 2023 to 2033, By Country

    15.1. Historical Market Size Value (US$ Million) Trend Analysis By Market Taxonomy, 2018 to 2022

    15.2. Market Size Value (US$ Million) Forecast By Market Taxonomy, 2023 to 2033

        15.2.1. By Country

            15.2.1.1. GCC Countries

            15.2.1.2. South Africa

            15.2.1.3. Israel

            15.2.1.4. Rest of MEA

        15.2.2. By Drug Type

        15.2.3. By Route of Administration

        15.2.4. By Distribution Channel

    15.3. Market Attractiveness Analysis

        15.3.1. By Country

        15.3.2. By Drug Type

        15.3.3. By Route of Administration

        15.3.4. By Distribution Channel

    15.4. Key Takeaways

16. Key Countries Market Analysis

    16.1. USA

        16.1.1. Pricing Analysis

        16.1.2. Market Share Analysis, 2022

            16.1.2.1. By Drug Type

            16.1.2.2. By Route of Administration

            16.1.2.3. By Distribution Channel

    16.2. Canada

        16.2.1. Pricing Analysis

        16.2.2. Market Share Analysis, 2022

            16.2.2.1. By Drug Type

            16.2.2.2. By Route of Administration

            16.2.2.3. By Distribution Channel

    16.3. Brazil

        16.3.1. Pricing Analysis

        16.3.2. Market Share Analysis, 2022

            16.3.2.1. By Drug Type

            16.3.2.2. By Route of Administration

            16.3.2.3. By Distribution Channel

    16.4. Mexico

        16.4.1. Pricing Analysis

        16.4.2. Market Share Analysis, 2022

            16.4.2.1. By Drug Type

            16.4.2.2. By Route of Administration

            16.4.2.3. By Distribution Channel

    16.5. Germany

        16.5.1. Pricing Analysis

        16.5.2. Market Share Analysis, 2022

            16.5.2.1. By Drug Type

            16.5.2.2. By Route of Administration

            16.5.2.3. By Distribution Channel

    16.6. United Kingdom

        16.6.1. Pricing Analysis

        16.6.2. Market Share Analysis, 2022

            16.6.2.1. By Drug Type

            16.6.2.2. By Route of Administration

            16.6.2.3. By Distribution Channel

    16.7. France

        16.7.1. Pricing Analysis

        16.7.2. Market Share Analysis, 2022

            16.7.2.1. By Drug Type

            16.7.2.2. By Route of Administration

            16.7.2.3. By Distribution Channel

    16.8. Spain

        16.8.1. Pricing Analysis

        16.8.2. Market Share Analysis, 2022

            16.8.2.1. By Drug Type

            16.8.2.2. By Route of Administration

            16.8.2.3. By Distribution Channel

    16.9. Italy

        16.9.1. Pricing Analysis

        16.9.2. Market Share Analysis, 2022

            16.9.2.1. By Drug Type

            16.9.2.2. By Route of Administration

            16.9.2.3. By Distribution Channel

    16.10. India

        16.10.1. Pricing Analysis

        16.10.2. Market Share Analysis, 2022

            16.10.2.1. By Drug Type

            16.10.2.2. By Route of Administration

            16.10.2.3. By Distribution Channel

    16.11. Malaysia

        16.11.1. Pricing Analysis

        16.11.2. Market Share Analysis, 2022

            16.11.2.1. By Drug Type

            16.11.2.2. By Route of Administration

            16.11.2.3. By Distribution Channel

    16.12. Singapore

        16.12.1. Pricing Analysis

        16.12.2. Market Share Analysis, 2022

            16.12.2.1. By Drug Type

            16.12.2.2. By Route of Administration

            16.12.2.3. By Distribution Channel

    16.13. Thailand

        16.13.1. Pricing Analysis

        16.13.2. Market Share Analysis, 2022

            16.13.2.1. By Drug Type

            16.13.2.2. By Route of Administration

            16.13.2.3. By Distribution Channel

    16.14. China

        16.14.1. Pricing Analysis

        16.14.2. Market Share Analysis, 2022

            16.14.2.1. By Drug Type

            16.14.2.2. By Route of Administration

            16.14.2.3. By Distribution Channel

    16.15. Japan

        16.15.1. Pricing Analysis

        16.15.2. Market Share Analysis, 2022

            16.15.2.1. By Drug Type

            16.15.2.2. By Route of Administration

            16.15.2.3. By Distribution Channel

    16.16. South Korea

        16.16.1. Pricing Analysis

        16.16.2. Market Share Analysis, 2022

            16.16.2.1. By Drug Type

            16.16.2.2. By Route of Administration

            16.16.2.3. By Distribution Channel

    16.17. Australia

        16.17.1. Pricing Analysis

        16.17.2. Market Share Analysis, 2022

            16.17.2.1. By Drug Type

            16.17.2.2. By Route of Administration

            16.17.2.3. By Distribution Channel

    16.18. New Zealand

        16.18.1. Pricing Analysis

        16.18.2. Market Share Analysis, 2022

            16.18.2.1. By Drug Type

            16.18.2.2. By Route of Administration

            16.18.2.3. By Distribution Channel

    16.19. GCC Countries

        16.19.1. Pricing Analysis

        16.19.2. Market Share Analysis, 2022

            16.19.2.1. By Drug Type

            16.19.2.2. By Route of Administration

            16.19.2.3. By Distribution Channel

    16.20. South Africa

        16.20.1. Pricing Analysis

        16.20.2. Market Share Analysis, 2022

            16.20.2.1. By Drug Type

            16.20.2.2. By Route of Administration

            16.20.2.3. By Distribution Channel

    16.21. Israel

        16.21.1. Pricing Analysis

        16.21.2. Market Share Analysis, 2022

            16.21.2.1. By Drug Type

            16.21.2.2. By Route of Administration

            16.21.2.3. By Distribution Channel

17. Market Structure Analysis

    17.1. Competition Dashboard

    17.2. Competition Benchmarking

    17.3. Market Share Analysis of Top Players

        17.3.1. By Regional

        17.3.2. By Drug Type

        17.3.3. By Route of Administration

        17.3.4. By Distribution Channel

18. Competition Analysis

    18.1. Competition Deep Dive

        18.1.1. Novartis AG

            18.1.1.1. Overview

            18.1.1.2. Product Portfolio

            18.1.1.3. Profitability by Market Segments

            18.1.1.4. Sales Footprint

            18.1.1.5. Strategy Overview

                18.1.1.5.1. Marketing Strategy

        18.1.2. Valeant Pharmaceuticals International Inc.

            18.1.2.1. Overview

            18.1.2.2. Product Portfolio

            18.1.2.3. Profitability by Market Segments

            18.1.2.4. Sales Footprint

            18.1.2.5. Strategy Overview

                18.1.2.5.1. Marketing Strategy

        18.1.3. Teva Pharmaceuticals Industries Ltd.

            18.1.3.1. Overview

            18.1.3.2. Product Portfolio

            18.1.3.3. Profitability by Market Segments

            18.1.3.4. Sales Footprint

            18.1.3.5. Strategy Overview

                18.1.3.5.1. Marketing Strategy

        18.1.4. Sun Pharmaceuticals

            18.1.4.1. Overview

            18.1.4.2. Product Portfolio

            18.1.4.3. Profitability by Market Segments

            18.1.4.4. Sales Footprint

            18.1.4.5. Strategy Overview

                18.1.4.5.1. Marketing Strategy

        18.1.5. Abbott laboratories

            18.1.5.1. Overview

            18.1.5.2. Product Portfolio

            18.1.5.3. Profitability by Market Segments

            18.1.5.4. Sales Footprint

            18.1.5.5. Strategy Overview

                18.1.5.5.1. Marketing Strategy

        18.1.6. Mylan N.V.

            18.1.6.1. Overview

            18.1.6.2. Product Portfolio

            18.1.6.3. Profitability by Market Segments

            18.1.6.4. Sales Footprint

            18.1.6.5. Strategy Overview

                18.1.6.5.1. Marketing Strategy

        18.1.7. Pfizer Inc.

            18.1.7.1. Overview

            18.1.7.2. Product Portfolio

            18.1.7.3. Profitability by Market Segments

            18.1.7.4. Sales Footprint

            18.1.7.5. Strategy Overview

                18.1.7.5.1. Marketing Strategy

        18.1.8. GlaxoSmithKline PLC.

            18.1.8.1. Overview

            18.1.8.2. Product Portfolio

            18.1.8.3. Profitability by Market Segments

            18.1.8.4. Sales Footprint

            18.1.8.5. Strategy Overview

                18.1.8.5.1. Marketing Strategy

        18.1.9. Dr. Reddy’s Laboratories

            18.1.9.1. Overview

            18.1.9.2. Product Portfolio

            18.1.9.3. Profitability by Market Segments

            18.1.9.4. Sales Footprint

            18.1.9.5. Strategy Overview

                18.1.9.5.1. Marketing Strategy

        18.1.10. Merck & Co., Inc.

            18.1.10.1. Overview

            18.1.10.2. Product Portfolio

            18.1.10.3. Profitability by Market Segments

            18.1.10.4. Sales Footprint

            18.1.10.5. Strategy Overview

                18.1.10.5.1. Marketing Strategy

19. Assumptions & Acronyms Used

20. Research Methodology

Don't pay for what you don't need

Customize your report by selecting specific countries or regions and save 30%!

List of Tables

Table 1: Global Market Value (US$ Million) Forecast by Region, 2018 to 2033

Table 2: Global Market Value (US$ Million) Forecast by Drug Type, 2018 to 2033

Table 3: Global Market Value (US$ Million) Forecast by Route of Administration, 2018 to 2033

Table 4: Global Market Value (US$ Million) Forecast by Distribution Channel, 2018 to 2033

Table 5: North America Market Value (US$ Million) Forecast by Country, 2018 to 2033

Table 6: North America Market Value (US$ Million) Forecast by Drug Type, 2018 to 2033

Table 7: North America Market Value (US$ Million) Forecast by Route of Administration, 2018 to 2033

Table 8: North America Market Value (US$ Million) Forecast by Distribution Channel, 2018 to 2033

Table 9: Latin America Market Value (US$ Million) Forecast by Country, 2018 to 2033

Table 10: Latin America Market Value (US$ Million) Forecast by Drug Type, 2018 to 2033

Table 11: Latin America Market Value (US$ Million) Forecast by Route of Administration, 2018 to 2033

Table 12: Latin America Market Value (US$ Million) Forecast by Distribution Channel, 2018 to 2033

Table 13: Europe Market Value (US$ Million) Forecast by Country, 2018 to 2033

Table 14: Europe Market Value (US$ Million) Forecast by Drug Type, 2018 to 2033

Table 15: Europe Market Value (US$ Million) Forecast by Route of Administration, 2018 to 2033

Table 16: Europe Market Value (US$ Million) Forecast by Distribution Channel, 2018 to 2033

Table 17: South Asia Market Value (US$ Million) Forecast by Country, 2018 to 2033

Table 18: South Asia Market Value (US$ Million) Forecast by Drug Type, 2018 to 2033

Table 19: South Asia Market Value (US$ Million) Forecast by Route of Administration, 2018 to 2033

Table 20: South Asia Market Value (US$ Million) Forecast by Distribution Channel, 2018 to 2033

Table 21: East Asia Market Value (US$ Million) Forecast by Country, 2018 to 2033

Table 22: East Asia Market Value (US$ Million) Forecast by Drug Type, 2018 to 2033

Table 23: East Asia Market Value (US$ Million) Forecast by Route of Administration, 2018 to 2033

Table 24: East Asia Market Value (US$ Million) Forecast by Distribution Channel, 2018 to 2033

Table 25: Oceania Market Value (US$ Million) Forecast by Country, 2018 to 2033

Table 26: Oceania Market Value (US$ Million) Forecast by Drug Type, 2018 to 2033

Table 27: Oceania Market Value (US$ Million) Forecast by Route of Administration, 2018 to 2033

Table 28: Oceania Market Value (US$ Million) Forecast by Distribution Channel, 2018 to 2033

Table 29: MEA Market Value (US$ Million) Forecast by Country, 2018 to 2033

Table 30: MEA Market Value (US$ Million) Forecast by Drug Type, 2018 to 2033

Table 31: MEA Market Value (US$ Million) Forecast by Route of Administration, 2018 to 2033

Table 32: MEA Market Value (US$ Million) Forecast by Distribution Channel, 2018 to 2033
Sabyasachi Ghosh
Sabyasachi Ghosh

Principal Consultant

Talk to Analyst

Find your sweet spots for generating winning opportunities in this market.

List of Charts

Figure 1: Global Market Value (US$ Million) by Drug Type, 2023 to 2033

Figure 2: Global Market Value (US$ Million) by Route of Administration, 2023 to 2033

Figure 3: Global Market Value (US$ Million) by Distribution Channel, 2023 to 2033

Figure 4: Global Market Value (US$ Million) by Region, 2023 to 2033

Figure 5: Global Market Value (US$ Million) Analysis by Region, 2018 to 2033

Figure 6: Global Market Value Share (%) and BPS Analysis by Region, 2023 to 2033

Figure 7: Global Market Y-o-Y Growth (%) Projections by Region, 2023 to 2033

Figure 8: Global Market Value (US$ Million) Analysis by Drug Type, 2018 to 2033

Figure 9: Global Market Value Share (%) and BPS Analysis by Drug Type, 2023 to 2033

Figure 10: Global Market Y-o-Y Growth (%) Projections by Drug Type, 2023 to 2033

Figure 11: Global Market Value (US$ Million) Analysis by Route of Administration, 2018 to 2033

Figure 12: Global Market Value Share (%) and BPS Analysis by Route of Administration, 2023 to 2033

Figure 13: Global Market Y-o-Y Growth (%) Projections by Route of Administration, 2023 to 2033

Figure 14: Global Market Value (US$ Million) Analysis by Distribution Channel, 2018 to 2033

Figure 15: Global Market Value Share (%) and BPS Analysis by Distribution Channel, 2023 to 2033

Figure 16: Global Market Y-o-Y Growth (%) Projections by Distribution Channel, 2023 to 2033

Figure 17: Global Market Attractiveness by Drug Type, 2023 to 2033

Figure 18: Global Market Attractiveness by Route of Administration, 2023 to 2033

Figure 19: Global Market Attractiveness by Distribution Channel, 2023 to 2033

Figure 20: Global Market Attractiveness by Region, 2023 to 2033

Figure 21: North America Market Value (US$ Million) by Drug Type, 2023 to 2033

Figure 22: North America Market Value (US$ Million) by Route of Administration, 2023 to 2033

Figure 23: North America Market Value (US$ Million) by Distribution Channel, 2023 to 2033

Figure 24: North America Market Value (US$ Million) by Country, 2023 to 2033

Figure 25: North America Market Value (US$ Million) Analysis by Country, 2018 to 2033

Figure 26: North America Market Value Share (%) and BPS Analysis by Country, 2023 to 2033

Figure 27: North America Market Y-o-Y Growth (%) Projections by Country, 2023 to 2033

Figure 28: North America Market Value (US$ Million) Analysis by Drug Type, 2018 to 2033

Figure 29: North America Market Value Share (%) and BPS Analysis by Drug Type, 2023 to 2033

Figure 30: North America Market Y-o-Y Growth (%) Projections by Drug Type, 2023 to 2033

Figure 31: North America Market Value (US$ Million) Analysis by Route of Administration, 2018 to 2033

Figure 32: North America Market Value Share (%) and BPS Analysis by Route of Administration, 2023 to 2033

Figure 33: North America Market Y-o-Y Growth (%) Projections by Route of Administration, 2023 to 2033

Figure 34: North America Market Value (US$ Million) Analysis by Distribution Channel, 2018 to 2033

Figure 35: North America Market Value Share (%) and BPS Analysis by Distribution Channel, 2023 to 2033

Figure 36: North America Market Y-o-Y Growth (%) Projections by Distribution Channel, 2023 to 2033

Figure 37: North America Market Attractiveness by Drug Type, 2023 to 2033

Figure 38: North America Market Attractiveness by Route of Administration, 2023 to 2033

Figure 39: North America Market Attractiveness by Distribution Channel, 2023 to 2033

Figure 40: North America Market Attractiveness by Country, 2023 to 2033

Figure 41: Latin America Market Value (US$ Million) by Drug Type, 2023 to 2033

Figure 42: Latin America Market Value (US$ Million) by Route of Administration, 2023 to 2033

Figure 43: Latin America Market Value (US$ Million) by Distribution Channel, 2023 to 2033

Figure 44: Latin America Market Value (US$ Million) by Country, 2023 to 2033

Figure 45: Latin America Market Value (US$ Million) Analysis by Country, 2018 to 2033

Figure 46: Latin America Market Value Share (%) and BPS Analysis by Country, 2023 to 2033

Figure 47: Latin America Market Y-o-Y Growth (%) Projections by Country, 2023 to 2033

Figure 48: Latin America Market Value (US$ Million) Analysis by Drug Type, 2018 to 2033

Figure 49: Latin America Market Value Share (%) and BPS Analysis by Drug Type, 2023 to 2033

Figure 50: Latin America Market Y-o-Y Growth (%) Projections by Drug Type, 2023 to 2033

Figure 51: Latin America Market Value (US$ Million) Analysis by Route of Administration, 2018 to 2033

Figure 52: Latin America Market Value Share (%) and BPS Analysis by Route of Administration, 2023 to 2033

Figure 53: Latin America Market Y-o-Y Growth (%) Projections by Route of Administration, 2023 to 2033

Figure 54: Latin America Market Value (US$ Million) Analysis by Distribution Channel, 2018 to 2033

Figure 55: Latin America Market Value Share (%) and BPS Analysis by Distribution Channel, 2023 to 2033

Figure 56: Latin America Market Y-o-Y Growth (%) Projections by Distribution Channel, 2023 to 2033

Figure 57: Latin America Market Attractiveness by Drug Type, 2023 to 2033

Figure 58: Latin America Market Attractiveness by Route of Administration, 2023 to 2033

Figure 59: Latin America Market Attractiveness by Distribution Channel, 2023 to 2033

Figure 60: Latin America Market Attractiveness by Country, 2023 to 2033

Figure 61: Europe Market Value (US$ Million) by Drug Type, 2023 to 2033

Figure 62: Europe Market Value (US$ Million) by Route of Administration, 2023 to 2033

Figure 63: Europe Market Value (US$ Million) by Distribution Channel, 2023 to 2033

Figure 64: Europe Market Value (US$ Million) by Country, 2023 to 2033

Figure 65: Europe Market Value (US$ Million) Analysis by Country, 2018 to 2033

Figure 66: Europe Market Value Share (%) and BPS Analysis by Country, 2023 to 2033

Figure 67: Europe Market Y-o-Y Growth (%) Projections by Country, 2023 to 2033

Figure 68: Europe Market Value (US$ Million) Analysis by Drug Type, 2018 to 2033

Figure 69: Europe Market Value Share (%) and BPS Analysis by Drug Type, 2023 to 2033

Figure 70: Europe Market Y-o-Y Growth (%) Projections by Drug Type, 2023 to 2033

Figure 71: Europe Market Value (US$ Million) Analysis by Route of Administration, 2018 to 2033

Figure 72: Europe Market Value Share (%) and BPS Analysis by Route of Administration, 2023 to 2033

Figure 73: Europe Market Y-o-Y Growth (%) Projections by Route of Administration, 2023 to 2033

Figure 74: Europe Market Value (US$ Million) Analysis by Distribution Channel, 2018 to 2033

Figure 75: Europe Market Value Share (%) and BPS Analysis by Distribution Channel, 2023 to 2033

Figure 76: Europe Market Y-o-Y Growth (%) Projections by Distribution Channel, 2023 to 2033

Figure 77: Europe Market Attractiveness by Drug Type, 2023 to 2033

Figure 78: Europe Market Attractiveness by Route of Administration, 2023 to 2033

Figure 79: Europe Market Attractiveness by Distribution Channel, 2023 to 2033

Figure 80: Europe Market Attractiveness by Country, 2023 to 2033

Figure 81: South Asia Market Value (US$ Million) by Drug Type, 2023 to 2033

Figure 82: South Asia Market Value (US$ Million) by Route of Administration, 2023 to 2033

Figure 83: South Asia Market Value (US$ Million) by Distribution Channel, 2023 to 2033

Figure 84: South Asia Market Value (US$ Million) by Country, 2023 to 2033

Figure 85: South Asia Market Value (US$ Million) Analysis by Country, 2018 to 2033

Figure 86: South Asia Market Value Share (%) and BPS Analysis by Country, 2023 to 2033

Figure 87: South Asia Market Y-o-Y Growth (%) Projections by Country, 2023 to 2033

Figure 88: South Asia Market Value (US$ Million) Analysis by Drug Type, 2018 to 2033

Figure 89: South Asia Market Value Share (%) and BPS Analysis by Drug Type, 2023 to 2033

Figure 90: South Asia Market Y-o-Y Growth (%) Projections by Drug Type, 2023 to 2033

Figure 91: South Asia Market Value (US$ Million) Analysis by Route of Administration, 2018 to 2033

Figure 92: South Asia Market Value Share (%) and BPS Analysis by Route of Administration, 2023 to 2033

Figure 93: South Asia Market Y-o-Y Growth (%) Projections by Route of Administration, 2023 to 2033

Figure 94: South Asia Market Value (US$ Million) Analysis by Distribution Channel, 2018 to 2033

Figure 95: South Asia Market Value Share (%) and BPS Analysis by Distribution Channel, 2023 to 2033

Figure 96: South Asia Market Y-o-Y Growth (%) Projections by Distribution Channel, 2023 to 2033

Figure 97: South Asia Market Attractiveness by Drug Type, 2023 to 2033

Figure 98: South Asia Market Attractiveness by Route of Administration, 2023 to 2033

Figure 99: South Asia Market Attractiveness by Distribution Channel, 2023 to 2033

Figure 100: South Asia Market Attractiveness by Country, 2023 to 2033

Figure 101: East Asia Market Value (US$ Million) by Drug Type, 2023 to 2033

Figure 102: East Asia Market Value (US$ Million) by Route of Administration, 2023 to 2033

Figure 103: East Asia Market Value (US$ Million) by Distribution Channel, 2023 to 2033

Figure 104: East Asia Market Value (US$ Million) by Country, 2023 to 2033

Figure 105: East Asia Market Value (US$ Million) Analysis by Country, 2018 to 2033

Figure 106: East Asia Market Value Share (%) and BPS Analysis by Country, 2023 to 2033

Figure 107: East Asia Market Y-o-Y Growth (%) Projections by Country, 2023 to 2033

Figure 108: East Asia Market Value (US$ Million) Analysis by Drug Type, 2018 to 2033

Figure 109: East Asia Market Value Share (%) and BPS Analysis by Drug Type, 2023 to 2033

Figure 110: East Asia Market Y-o-Y Growth (%) Projections by Drug Type, 2023 to 2033

Figure 111: East Asia Market Value (US$ Million) Analysis by Route of Administration, 2018 to 2033

Figure 112: East Asia Market Value Share (%) and BPS Analysis by Route of Administration, 2023 to 2033

Figure 113: East Asia Market Y-o-Y Growth (%) Projections by Route of Administration, 2023 to 2033

Figure 114: East Asia Market Value (US$ Million) Analysis by Distribution Channel, 2018 to 2033

Figure 115: East Asia Market Value Share (%) and BPS Analysis by Distribution Channel, 2023 to 2033

Figure 116: East Asia Market Y-o-Y Growth (%) Projections by Distribution Channel, 2023 to 2033

Figure 117: East Asia Market Attractiveness by Drug Type, 2023 to 2033

Figure 118: East Asia Market Attractiveness by Route of Administration, 2023 to 2033

Figure 119: East Asia Market Attractiveness by Distribution Channel, 2023 to 2033

Figure 120: East Asia Market Attractiveness by Country, 2023 to 2033

Figure 121: Oceania Market Value (US$ Million) by Drug Type, 2023 to 2033

Figure 122: Oceania Market Value (US$ Million) by Route of Administration, 2023 to 2033

Figure 123: Oceania Market Value (US$ Million) by Distribution Channel, 2023 to 2033

Figure 124: Oceania Market Value (US$ Million) by Country, 2023 to 2033

Figure 125: Oceania Market Value (US$ Million) Analysis by Country, 2018 to 2033

Figure 126: Oceania Market Value Share (%) and BPS Analysis by Country, 2023 to 2033

Figure 127: Oceania Market Y-o-Y Growth (%) Projections by Country, 2023 to 2033

Figure 128: Oceania Market Value (US$ Million) Analysis by Drug Type, 2018 to 2033

Figure 129: Oceania Market Value Share (%) and BPS Analysis by Drug Type, 2023 to 2033

Figure 130: Oceania Market Y-o-Y Growth (%) Projections by Drug Type, 2023 to 2033

Figure 131: Oceania Market Value (US$ Million) Analysis by Route of Administration, 2018 to 2033

Figure 132: Oceania Market Value Share (%) and BPS Analysis by Route of Administration, 2023 to 2033

Figure 133: Oceania Market Y-o-Y Growth (%) Projections by Route of Administration, 2023 to 2033

Figure 134: Oceania Market Value (US$ Million) Analysis by Distribution Channel, 2018 to 2033

Figure 135: Oceania Market Value Share (%) and BPS Analysis by Distribution Channel, 2023 to 2033

Figure 136: Oceania Market Y-o-Y Growth (%) Projections by Distribution Channel, 2023 to 2033

Figure 137: Oceania Market Attractiveness by Drug Type, 2023 to 2033

Figure 138: Oceania Market Attractiveness by Route of Administration, 2023 to 2033

Figure 139: Oceania Market Attractiveness by Distribution Channel, 2023 to 2033

Figure 140: Oceania Market Attractiveness by Country, 2023 to 2033

Figure 141: MEA Market Value (US$ Million) by Drug Type, 2023 to 2033

Figure 142: MEA Market Value (US$ Million) by Route of Administration, 2023 to 2033

Figure 143: MEA Market Value (US$ Million) by Distribution Channel, 2023 to 2033

Figure 144: MEA Market Value (US$ Million) by Country, 2023 to 2033

Figure 145: MEA Market Value (US$ Million) Analysis by Country, 2018 to 2033

Figure 146: MEA Market Value Share (%) and BPS Analysis by Country, 2023 to 2033

Figure 147: MEA Market Y-o-Y Growth (%) Projections by Country, 2023 to 2033

Figure 148: MEA Market Value (US$ Million) Analysis by Drug Type, 2018 to 2033

Figure 149: MEA Market Value Share (%) and BPS Analysis by Drug Type, 2023 to 2033

Figure 150: MEA Market Y-o-Y Growth (%) Projections by Drug Type, 2023 to 2033

Figure 151: MEA Market Value (US$ Million) Analysis by Route of Administration, 2018 to 2033

Figure 152: MEA Market Value Share (%) and BPS Analysis by Route of Administration, 2023 to 2033

Figure 153: MEA Market Y-o-Y Growth (%) Projections by Route of Administration, 2023 to 2033

Figure 154: MEA Market Value (US$ Million) Analysis by Distribution Channel, 2018 to 2033

Figure 155: MEA Market Value Share (%) and BPS Analysis by Distribution Channel, 2023 to 2033

Figure 156: MEA Market Y-o-Y Growth (%) Projections by Distribution Channel, 2023 to 2033

Figure 157: MEA Market Attractiveness by Drug Type, 2023 to 2033

Figure 158: MEA Market Attractiveness by Route of Administration, 2023 to 2033

Figure 159: MEA Market Attractiveness by Distribution Channel, 2023 to 2033

Figure 160: MEA Market Attractiveness by Country, 2023 to 2033

Recommendations

Healthcare

Salivary Gland Infection Treatment Market

Published : February 2023

Explore Healthcare Insights

View Reports

Herpes Labialis Treatment Market