

- Market Size (2026)
- USD 3860.7 Mn
- Forecast (2036)
- USD 7737.7 Mn
- CAGR (2026 to 2036)
- 7.2%
How big is the high tolerance plastics market in 2026?
USD 3,860.7 million in 2026 and USD 7,737.7 million by 2036 at a 7.2% CAGR.
Sales of high tolerance plastics is projected to expand at 7.2% CAGR between 2026 and 2036, increasing valuation from USD 3,860.7 million in 2026 to USD 7,737.7 million by 2036. OEM design teams are replacing metal parts in gears and connectors where tight dimensions reduce wear and assembly rejects. OICA reported global vehicle production of 96.4 million units in 2025, which keeps engineering plastic demand tied to automotive programs that need repeatable molding behavior. Precision plastics are expected to gain account attention where light weight and tolerance records move together.
China and India are expected to emphasize local molding capacity because vehicle output and electronics assembly keep design changes moving quickly. United States and Germany programs are anticipated to stress approval files because automotive, medical and aerospace teams face tighter traceability review. Engineering teams examine shrinkage control and lot-to-lot stability before a resin grade enters a drawing file. USA Census Bureau data placed new orders for manufactured goods at USD 662.7 billion in April 2026, which gives automotive plastic components a broad manufacturing base for precision part orders.
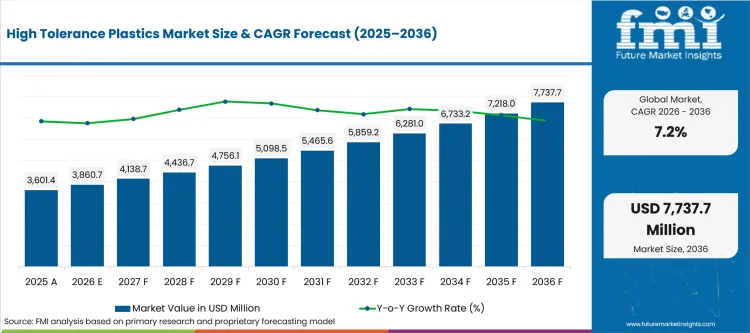
| Metric | Value |
|---|---|
| 2025 Market Size | USD 3,601.4 million |
| 2026 Market Size | USD 3,860.7 million |
| 2036 Market Size | USD 7,737.7 million |
| Forecast CAGR (2026-2036) | 7.2% |
| Leading Sales Channel | Direct OEM |
| Direct OEM Share (2026) | 60.6% |
| Leading Tolerance Class | Standard Precision |
| Standard Precision Share (2026) | 46.0% |
| Leading End Use | Automotive |
| Automotive Share (2026) | 42.8% |
Summary of the High Tolerance Plastics Market
| Market Signal | Commercial Impact |
|---|---|
| Demand and Growth Drivers | Growth is expected to be driven by tolerance-sensitive parts in vehicles, electronics, medical tools and industrial equipment. The purchase case is stronger when polymer grades reduce weight while holding dimensions after heat and repeated motion.
|
| Product and Segment View | Direct OEM, standard precision, automotive, PEEK / PEKK and gears and bearings are projected to lead their parent categories in 2026. These segments reflect where tolerance evidence is tied to a named part and a real service risk.
|
| Geography and Growth Outlook | India and China are expected to show higher adoption pressure because local vehicle and electronics supply chains move quickly. The United States, Germany, Japan and the United Kingdom are projected to expand with stricter documentation review.
|
| Competitive Landscape | Competition is expected to center on resin grade breadth, tolerance proof and help during part design. Suppliers gain leverage when their teams support resin selection and molding trials before a purchase order expands.
|
| Analyst Perspective | The real commercial test is tolerance memory after the part leaves the mold. A resin grade wins repeat use only if a processor keeps dimensions stable under heat, friction and load.
|
Source: FMI's proprietary forecasting model and primary research
How is the high tolerance plastics market segmented?
The high tolerance plastics industry is segmented by polymer type, tolerance class, application, end use, sales channel and region.
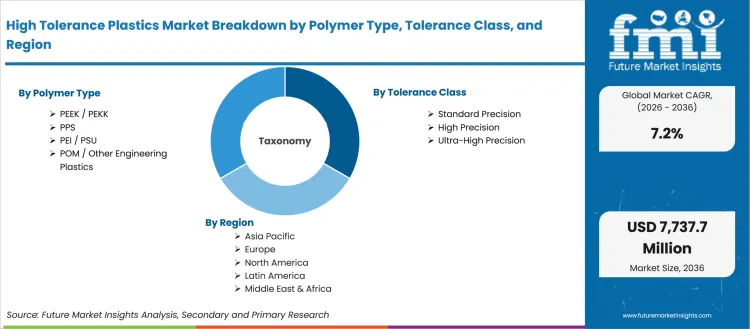
The high tolerance plastics market is segmented by polymer type, tolerance class, application, end use, sales channel and region. By polymer type, the scope covers PEEK / PEKK, PPS, PEI / PSU and POM / other engineering plastics. By tolerance class, it covers standard precision, high precision and ultra-high precision. By application, it covers gears and bearings, connector components, medical components and aerospace or industrial parts. By end use, it covers automotive, electronics, medical devices, aerospace and industrial accounts. By sales channel, it covers direct OEM, precision molders and distributors. Regional coverage follows North America, Europe, East Asia, South Asia and Pacific and other areas connected to aromatic ketone polymers.
How does direct OEM shape demand within the sales channel category?
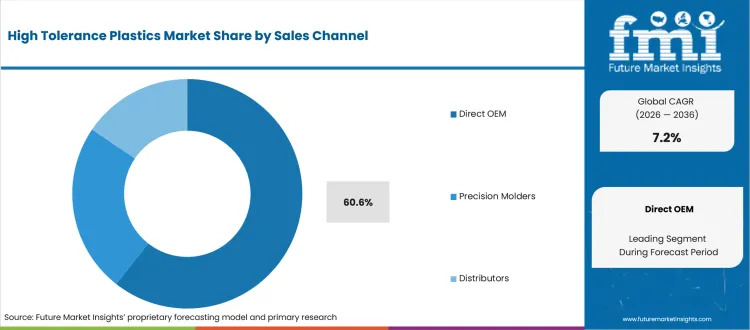
OEM-directed sourcing is tied to drawing ownership and post-approval support for precision molded parts. NIST launched centers for AI in manufacturing and critical infrastructure in December 2025. The program reflects a wider manufacturing focus on process evidence and control. Direct ordering helps polymer specialists answer drawing questions before a resin grade moves into mold trials.
- Based on sales channel, direct OEM is projected to account for 60.6% in 2026 due to platform ownership and direct service control. Engineering teams use direct routes when grade approval needs drawing support and faster issue closure.
- Direct OEM demand is expected to grow among automotive and electronics accounts attributable to approval control and faster issue escalation. Engineering teams using plastic additive selection compare channel route, lot records and response ownership before changing a named grade.
What supports demand for standard precision within the tolerance class category?
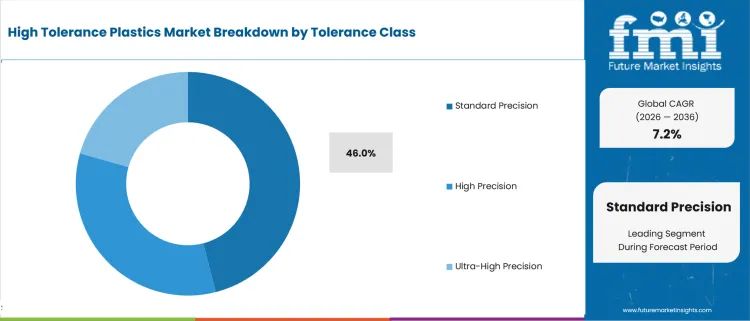
Standard precision fits the middle of the market where a part needs repeatability without the cost of ultra-tight machining. Plastics Industry Association reported in September 2025 that USA plastics industry shipments reached USD 550.7 billion in 2024. The shipment base supports routine orders for housings and clips. It also supports gears and connectors that still need stable dimensions. Processors look for resins that flow consistently before adding tighter inspection steps.
- By tolerance class, standard precision is estimated to hold 46.0% in 2026 owing to routine tolerance bands used by molders and OEM accounts. The category fits parts that need repeatable shrinkage behavior without ultra-high precision cost.
- Precision molders are increasingly purchasing standard precision grades driven by lower approval burden and familiar tool settings. The segment suits parts where repeated fit and predictable shrinkage are more useful than premium tolerance claims.
How do OEM platform teams evaluate automotive within the end use category?
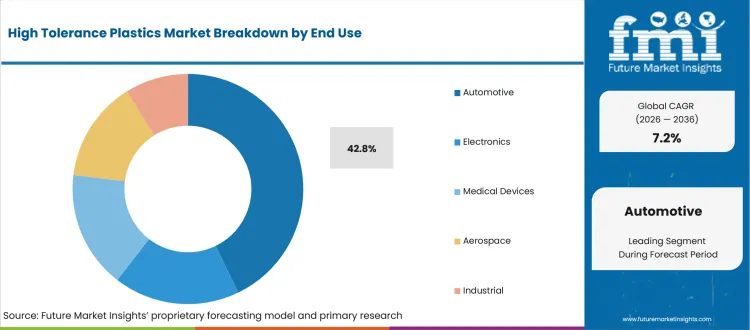
Automotive programs place tolerance plastics inside systems that face heat, vibration and repeated assembly loads. OICA reported in April 2026 that global vehicle sales reached 99.8 million units in 2025. That sales base keeps engineers focused on molded parts that reduce weight without creating warranty noise. Platform teams review resin history and drawing fit before parts move into serial supply.
- In 2026, automotive is expected to lead end use with 42.8% share because vehicle platforms use precision plastics in connectors and gears. Brackets and thermal parts are expected to add further demand in compact vehicle assemblies. OICA reported Asia vehicle production of 59.2 million units in 2025, which keeps polymer validation close to assembly scale.
- Automotive accounts are expected to favor high tolerance plastics over metal alternatives due to weight reduction and stable part fit. Teams comparing precision plastic use still require proof of creep resistance and heat ageing before platform release.
How is PEEK / PEKK positioned within the polymer type category?
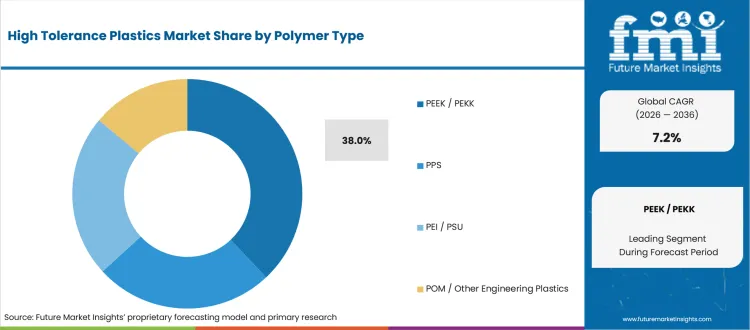
PEEK and PEKK grades sit in demanding applications where heat, chemicals and repeated stress narrow the polymer list. Victrex said in September 2025 that its K 2025 portfolio covered films and powders. Granules, composites and precision components extended the same polymer discussion. That breadth is relevant for OEMs that test polymer behavior in more than one part format. Technical teams compare grade history before committing to higher resin cost.
- By polymer type, PEEK / PEKK is forecast to represent 38.0% in 2026 driven by heat resistance and dimensional stability in demanding parts. Engineers use the family when temperature and chemical exposure narrow the approval path.
- PEEK / PEKK is drawing attention from engineers shaped by thin-wall design and higher service temperatures. Programs using CF PEEK composites often ask for stronger evidence on creep, wear and processing repeatability before grade approval.
What drives gears and bearings within the application category?
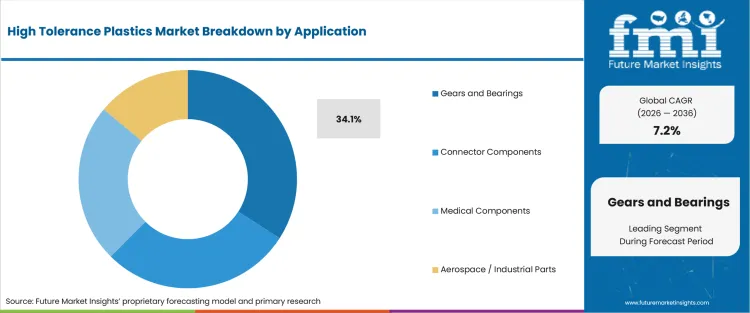
Gears and bearings turn tolerance into daily operating proof because friction, wear and noise appear quickly during use. Ensinger said in November 2025 that its engineering particle foams use thermoplastic polymers such as PC, PESU and PEEK. The same material logic supports moving parts that need controlled weight and wear behavior. Processors test lubricity and dimensional drift before repeat orders expand.
- The application category is forecast to be led by gears and bearings at 34.1% share in 2026 due to low-friction needs and fit control. Molders test lubricity and wear behavior before expanding repeat orders.
- Sales of gears and bearings are forecast to gain traction in industrial equipment reinforced by wear reduction and quieter motion. Medical plastic applications also use precision polymer parts where tolerance drift affects fit, cleaning and service records.
What are the drivers, restraints and opportunities in the high tolerance plastics market?
Near-term purchases are projected to be shaped by metal replacement in precision parts, lengthy qualification work and OEM demand for documented polymer grades.
- Driver: OEM accounts are expected to replace selected metal parts where precision polymers reduce weight and keep molded dimensions stable.
- Restraint: Qualification work is anticipated to delay adoption if creep, wear and lot records remain incomplete.
- Opportunity: Documented resin grades are projected to open account access in EVs, medical tools and compact electronics.
Automotive and electronics teams are expected to raise interest in polymers that simplify compact design without adding fit risk. SABIC said in June 2026 that it would show a full EV battery material ecosystem at Battery Show Europe. The program links pack, power and component materials in one account conversation. OEM teams are expected to use such portfolios when tolerance plastics move into electrified platforms.
Qualification delays usually begin when a resin grade lacks enough test history for heat, creep and chemical exposure. ECHA updated its assessment of regulatory needs list in February 2026 for thousands of substance entries under REACH and CLP review. Chemical review keeps polymer files under pressure when additives or fluorinated materials enter a drawing. Medical, aerospace and automotive accounts are expected to ask for part-level records before broader adoption moves past trial quantities.
Compact device design is projected to convert the qualification burden into a sales opening for vendors that support tests early. Saint-Gobain published guidance in June 2026 on thermoplastic injection molding for medical components. The note stressed tooling, process design and regulatory implications for precision parts. That review points toward micro molded parts where material files and design help carry commercial weight.
Which country CAGRs are profiled in the high tolerance plastics market?
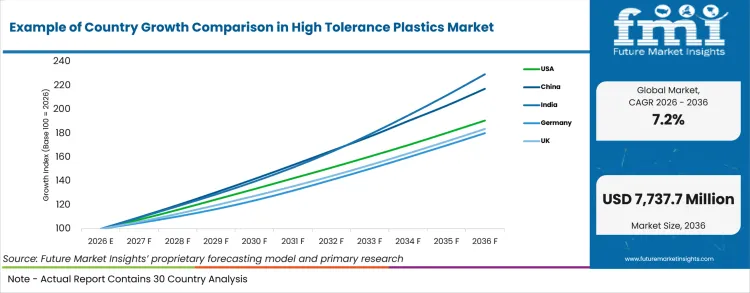
| Country | CAGR |
|---|---|
| United States | 6.66% |
| China | 8.06% |
| India | 8.66% |
| Germany | 6.06% |
| United Kingdom | 6.26% |
| Japan | 6.06% |
| South Korea | 7.06% |
| Rest of World | 7.46% |
Source: FMI's proprietary forecasting model and primary research
How do country-level CAGRs compare in the high tolerance plastics market?
Country growth is expected to diverge around how quickly local engineering teams approve new resin grades. India and China are projected to show sharper adoption pressure because vehicle and electronics programs need local molding support. The United States and Germany are anticipated to expand more steadily because documentation carries more weight. Japan and the United Kingdom are projected to follow a similar approval pattern. South Korea is estimated to sit between these groups due to fast EV supply chains and close OEM feedback loops. Rest of World demand is forecast to follow regional assembly growth and distributor access.
- United States molders start from a deep plastics base that already serves automotive, electronics and medical accounts. The United States is projected to grow at 6.66% CAGR by 2036 due to steady replacement of metal parts in qualified programs. USA Census Bureau data placed plastics and rubber product shipments at USD 25,974 million in April 2026. Celanese and DuPont give local engineers access to resin files and application teams. Medical device molders around Minnesota and electronics accounts in Texas add a further precision screen. The next hurdle is expected to be part-level evidence before approved grades move into larger programs.
- China combines EV scale with local electronics demand, which gives precision plastics a wider set of part trials. High tolerance plastics demand in China is forecast to rise at 8.06% CAGR over the forecast period due to rapid platform changes. The State Council reported that auto output reached 34.531 million units in 2025. BYD, SAIC and local molders are expected to keep testing heat-resistant polymers for connectors and e-motor parts. Shenzhen electronics accounts add pressure for thinner parts that still hold fit after heat exposure. Supplier selection is projected to turn on local technical staff and resin availability.
- India’s vehicle supply chain is adding formal approval routines while local molding capacity expands around OEM hubs. SIAM reported passenger vehicle sales of 4.643 million units in FY 2025-26. India’s high tolerance plastics outlook is anticipated to advance at 8.66% CAGR over the assessment period driven by automotive and electronics localization. Tata Motors, Maruti Suzuki and tier suppliers are expected to request practical cost proof before resin upgrades. Pune and Chennai molders are expected to favor grades that match existing tools. Local distributors are anticipated to shape sample access during early resin trials. The near-term question is how much validation local processors manage without extending launch timing.
- German engineering teams usually treat precision plastics as a validation issue before treating them as a cost issue. VDA reported battery-electric vehicle production of 1.22 million units in 2025. Adoption of high tolerance plastics in Germany is estimated to expand at 6.06% CAGR through 2036 because EV parts need heat and dimensional control. Röchling Automotive and German tier suppliers give local accounts experience in polymer component design. Toolmakers in Baden-Württemberg add a local route for testing gear and connector parts. Munich EV programs are expected to add thermal checks during platform validation. Vendor gains are forecast to depend on drawing support and repeatable mold trial evidence.
- United Kingdom demand is tied to specialist polymer skills and a smaller but exacting automotive base. The United Kingdom high tolerance plastics sector is projected to record 6.26% CAGR during the assessment period because processors need precise parts for mobility, medical and industrial accounts. West Midlands automotive programs and medical device shops create separate qualification paths. Channel advantage is expected to favor vendors that support trials near specialist processors.
- Japan’s precision culture makes the approval file as relevant as resin performance in many programs. METI reported the industrial production index at 103.0 in May 2026. In Japan, high tolerance plastics demand is anticipated to advance at 6.06% CAGR through 2036 because electronics and mobility programs require stable molded tolerances. Toyota, Denso and device suppliers are expected to examine dimensional drift before switching grades. Osaka and Nagoya processors are anticipated to ask for stable resin lots before tooling changes. Medical device accounts are expected to add cleanliness checks during grade review. Vendor capability is estimated to depend on local technical support and careful change control.
- South Korea’s EV and electronics chains keep feedback loops short between OEMs, molders and material teams. The Ministry of Trade, Industry and Resources reported automobile exports of USD 6.4 billion in March 2026. Hyundai, Kia and electronics suppliers are expected to value thermal performance and quick application support. South Korea is estimated to post 7.06% CAGR over the forecast period owing to compact parts used in mobility and electronics. Gyeonggi toolmakers add a fast route from sample testing to grade feedback. Battery components are expected to add heat screens during compact pack design. Format advantage is projected to favor resin suppliers close to local toolmakers.
- Rest of World demand is spread across regional assembly hubs, repair channels and industrial parts distributors. UNIDO reported 1.2% quarter-over-quarter growth in global manufacturing activity in the first quarter of 2026. High tolerance plastics sales in Rest of World are forecast to expand at 7.46% CAGR by 2036 due to broader manufacturing recovery. Mexico, ASEAN and Gulf industrial accounts are expected to compare local service depth before resin switches. Aerospace repair shops and industrial maintenance teams add demand for small batches with clear resin records. Distributor reach is estimated to remain uneven across smaller assembly hubs. Thermoplastic prepreg systems also frame part design choices in aerospace-linked programs.
Who are the notable companies in the high tolerance plastics market?
Victrex, Syensqo, SABIC, Celanese, Ensinger, Röchling, Mitsubishi Chemical Group, Saint-Gobain and DuPont are the notable companies shaping this market.
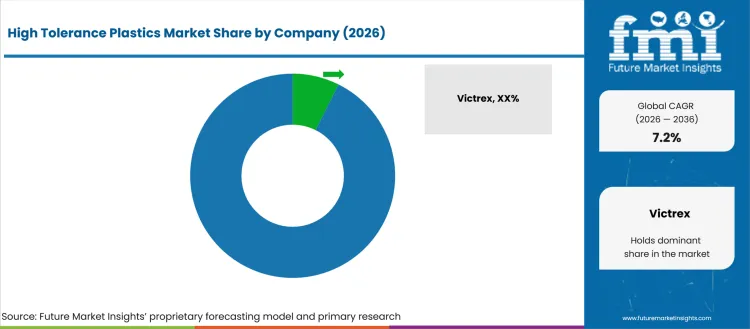
The competitive structure is expected to stay split between resin producers, semi-finished shape suppliers and precision component processors. Accounts compare polymer portfolio fit, processing guidance and tolerance evidence before assigning larger orders. Direct OEM programs usually ask for test data and named engineering contact. Distributor-led accounts place more weight on local availability and machining support. Competition around plastic compounding programs is projected to sharpen where processors need grades that keep shrinkage and wear predictable.
- High-temperature and chemically exposed parts give Victrex and Syensqo a clear comparison point because both support PEEK or PAEK-related programs. Their relevance is expected to be tested in thin-wall parts where heat and creep behavior decide approval.
- Broader resin availability gives SABIC and Celanese access to processors that need more than one polymer family. Their portfolios are expected to fit accounts that compare POM and PC grades. PEI and specialty grades add another selection path.
- Semi-finished shapes and custom parts create a different route for Ensinger, Röchling and Mitsubishi Chemical Group. These companies are expected to remain relevant where processors need stock shapes, machining support and application help.
- Specialty material accounts still look at Saint-Gobain and DuPont where friction control, sealing behavior and chemistry history shape approval. Their positions are expected to be clearer in medical, electronics and fluid-handling parts.
Competitive Benchmarking: High Tolerance Plastics Market
| Company | Polymer Portfolio Fit | Precision Processing Support | Automotive and Electronics Fit | Specification Support | Service Reach |
|---|---|---|---|---|---|
| Victrex | High | Strong | High | Strong | Global |
| Syensqo | High | Strong | High | Strong | Global |
| SABIC | High | Medium | High | Strong | Global |
| Celanese | High | Medium | High | Strong | Global |
| Ensinger | Strong | Strong | Medium | Strong | Global |
| Röchling | Medium | Strong | High | Medium | Global |
| Mitsubishi Chemical Group | High | Medium | High | Strong | Global |
| Saint-Gobain | Medium | Strong | Medium | Strong | Global |
| DuPont | High | Medium | High | Strong | Global |
Source: Future Market Insights competitive analysis, 2026. Ratings reflect relative portfolio relevance and workflow fit. Service capability and geographic reach shape the remaining comparison.
Key Developments in the High Tolerance Plastics Market
- In May 2026, SABIC launched ULTEM reactive oligomer for tough and lightweight aerospace composites. The company said the material was named a gold winner in the 2026 Edison Awards.
- In December 2025, Röchling said Röchling Automotive would supply intrusion protection for a major European OEM platform starting in 2027. The thermoplastic composite panels use continuous glass fiber reinforcement in a sandwich construction.
- In April 2025, DuPont expanded optical silicone technical capabilities at its Taoyuan site in Taiwan. The added lab capability supports evaluation of optical silicone products and process work for device designs.
- In December 2025, Celanese reported ISCC carbon footprint certification for POM ECO-C grades within its engineered materials portfolio. The certification adds documentation around acetal resin choices used in precision components where friction, wear and molding consistency are part of purchase review.
Key Players in the High Tolerance Plastics Market
High-Performance Polymer Producers
- Victrex
- Syensqo
- SABIC
- Celanese
- DuPont
Precision Plastic Processors and Shape Suppliers
- Ensinger
- Röchling
- Mitsubishi Chemical Group
Specialty Materials and Component Suppliers
- Saint-Gobain
High Tolerance Plastics Market - Report Scope
| Coverage field | Report scope |
|---|---|
| Market breakdown | By polymer type, tolerance class, application, end use, sales channel and region |
| Market Definition | High tolerance plastics are engineering polymer materials and precision plastic parts used where dimensional stability, heat resistance, wear control and repeatable molding behavior shape product approval. |
| Regions Covered | North America, Latin America, Europe, East Asia, South Asia and Pacific and Middle East and Africa |
| Countries Covered | United States, China, India, Germany, United Kingdom, Japan, South Korea and 20+ countries |
| Key Companies Profiled | Victrex, Syensqo, SABIC, Celanese, Ensinger, Röchling, Mitsubishi Chemical Group, Saint-Gobain and DuPont |
| Forecast Period | 2026 to 2036 |
| Approach | Hybrid methodology using account-level polymer demand checks, market-level manufacturing indicators, company evidence, segment share modeling and primary research with precision plastics accounts |
Source: Future Market Insights - analysis driven by proprietary forecasting models and primary research
High Tolerance Plastics Market - Research Methodology
| Method | Approach |
|---|---|
| Primary Research | FMI interviewed resin producers, precision molders, distributors and OEM-facing engineering teams that evaluate high tolerance plastics. Discussions tested adoption triggers, tolerance requirements, polymer selection criteria and channel behavior. Inputs were compared with official company disclosures and interview evidence from resin and component suppliers. The review helped separate routine engineering plastics demand from applications that need tighter dimensional control. |
| Desk Research | Desk research used official manufacturing, automotive and industrial production sources to check demand logic by country. OICA, USA Census Bureau, CAAM-linked State Council data, SIAM, VDA, ONS, METI, MOTIR and UNIDO were reviewed. Company sources were used only for product launches, application notes and confirmed portfolio activity. |
| Market Sizing and Forecasting | The model combined a market-level view of precision plastics consumption with account-level checks by polymer family, tolerance class, application, end use and sales channel. Segment shares were tested against customer interviews and supplier portfolio evidence. The 2026 base was reconciled with country indicators before the 2036 forecast was estimated using adoption and qualification assumptions. |
| Data Validation | Forecast results were validated by comparing country growth patterns with manufacturing activity, vehicle production, electronics demand and known qualification behavior. Outliers were reviewed against company evidence and channel feedback. The final estimates reflect triangulation between public data, supplier disclosures and FMI primary research. Validation focused on whether each number matched a credible purchase path. |
Source: Future Market Insights (FMI) analysis, based on proprietary forecasting model and primary research
High Tolerance Plastics Market by Segments
High Tolerance Plastics Market segmented by Polymer Type:
- PEEK / PEKK
- PPS
- PEI / PSU
- POM / Other Engineering Plastics
High Tolerance Plastics Market segmented by Tolerance Class:
- Standard Precision
- High Precision
- Ultra-High Precision
High Tolerance Plastics Market segmented by Application:
- Gears and Bearings
- Connector Components
- Medical Components
- Aerospace / Industrial Parts
High Tolerance Plastics Market segmented by End Use:
- Automotive
- Electronics
- Medical Devices
- Aerospace
- Industrial
High Tolerance Plastics Market segmented by Sales Channel:
- Direct OEM
- Precision Molders
- Distributors
High Tolerance Plastics Market by Region:
- North America
- United States
- Canada
- Latin America
- Brazil
- Mexico
- Argentina
- Europe
- Germany
- United Kingdom
- France
- Italy
- Spain
- Nordic Countries
- East Asia
- China
- Japan
- South Korea
- South Asia and Pacific
- India
- ASEAN
- Australia and New Zealand
- Middle East and Africa
- GCC Countries
- South Africa
- Turkey
Research Sources and Bibliography
- International Organization of Motor Vehicle Manufacturers. (2026, April). Auto industry growth shifted east in 2025 amid global repositioning. OICA.
- USA Census Bureau. (2026, June). Monthly full report on manufacturers’ shipments, inventories and orders: April 2026. USA Census Bureau.
- Plastics Industry Association. (2025, September). 2025 Size and Impact Report: USA Plastics Industry Remains Impactful. Plastics Industry Association.
- National Institute of Standards and Technology. (2025, December). NIST Launches Centers for AI in Manufacturing and Critical Infrastructure. NIST.
- State Council of the People’s Republic of China. (2026, January). China’s auto output, sales reach new highs in 2025. State Council.
- Society of Indian Automobile Manufacturers. (2026, April). Auto Industry Performance of Q4 (Jan- March 2026) & FY 2025-26. SIAM.
- German Association of the Automotive Industry. (2026, February). Production and market in January 2026. VDA.
- Office for National Statistics. (2026, June). 22 - Manufacture of Rubber and Plastic Products TOTAL (£m). ONS.
- Ministry of Economy, Trade and Industry. (2026, June). Indices of Industrial Production. METI.
- Ministry of Trade, Industry and Resources. (2026, April). March 2026 Automobile Exports Reach $6.4 Billion. MOTIR.
- United Nations Industrial Development Organization. (2026, June). UNIDO World Manufacturing Production and Trade Report in Q1 2026. UNIDO Statistics.
- European Chemicals Agency. (2026, February). Assessment of regulatory needs: list. ECHA.
- Victrex. (2025, September). Hello Change Makers: Victrex Accelerates Engineering Polymer Solutions at K 2025. Victrex.
- Ensinger. (2025, November). The next generation of engineering particle foams from Ensinger. Ensinger.
- Saint-Gobain. (2026, June). How Thermoplastic Injection Molding Shapes Modern Medical Components. Saint-Gobain Medical.
- SABIC. (2026, May). SABIC launches ULTEM reactive oligomer for tough aerospace composites, named gold winner 2026 Edison Awards. SABIC.
- Röchling. (2025, December). Röchling Automotive supplies Intrusion Protection for a major European OEM. Röchling.
- DuPont. (2025, April). DuPont Enhances Optical Silicone Technical Capabilities in Taiwan. DuPont.
- Celanese. (2025, December). Celanese Achieves ISCC Carbon Footprint Certification for POM ECO-C Grades. Celanese.
This bibliography is provided for reader reference and uses primary government, standards-body, official trade body and company sources.
This Report Answers
- What value is the high tolerance plastics market estimated to reach in 2026 and by 2036?
- What CAGR is projected for the high tolerance plastics market from 2026 to 2036?
- Which parent segments and subsegments shape demand across the high tolerance plastics market?
- Which molding, design and qualification pressures are expected to support purchase activity?
- How are country CAGRs projected to differ across the profiled markets?
- Which companies compete across polymer portfolio fit, specification support and service reach?
- How does FMI validate forecasts through model triangulation and primary interviews?
- What should OEM platform teams address before broader sourcing commitment?
- How do claims review, tolerance evidence and regulatory files affect vendor selection?
Frequently Asked Questions
Why should executives track the High Tolerance Plastics Market?
Executives should track the market because manufacturers are increasingly replacing metal components with precision plastics to reduce weight while maintaining dimensional accuracy. Growth is being supported by rising demand from automotive, electronics, medical, and industrial applications that require high-performance materials.
What business problem does the High Tolerance Plastics Market address?
The market addresses the need for lightweight components that maintain tight dimensional tolerances under demanding operating conditions. High tolerance plastics help improve product performance while reducing wear, assembly issues, and overall system weight.
What should procurement leaders evaluate before selecting suppliers?
Procurement leaders should evaluate dimensional stability, material consistency, and tolerance-performance data. They should also assess traceability support, testing documentation, and the supplier's ability to support qualification and molding requirements.
What can limit return on investment for buyers?
Return on investment can be limited by lengthy qualification cycles and insufficient performance data for critical applications. Poor control of shrinkage, creep, or lot-to-lot consistency can also increase operational and validation costs.
How can suppliers build executive confidence?
Suppliers can build confidence by providing comprehensive testing records and verified tolerance-performance data. Strong technical support, traceability systems, and application-engineering expertise can further strengthen long-term customer relationships.
What is driving growth in the High Tolerance Plastics Market?
Growth is expected to be driven by increasing metal replacement initiatives and demand for precision-molded components in automotive and electronics applications. OEMs are also seeking materials that combine lightweight performance with high dimensional stability and heat resistance.
Who are the key players in the High Tolerance Plastics Market?
Key players include Victrex, Syensqo, SABIC, Celanese, Ensinger, Röchling, Mitsubishi Chemical Group, Saint-Gobain, and DuPont. These companies compete through high-performance polymer portfolios, precision-processing support, application expertise, and strong technical documentation.
What is a significant restraint in the High Tolerance Plastics Market?
A significant restraint is the extensive qualification and validation process required for precision plastic components and polymer grades. Market adoption can slow when testing requirements and compliance documentation delay supplier approval.
Preview the report firsthand - request a free sample
Get SampleGet the brochure for pricing and purchase details.
Get PDFTable of Content
- Key Takeaways
- Market Size and CAGR
- Top Growth Driver
- Fastest Growing Segment
- Leading Region
- Key Companies
- Emerging Opportunities
- Executive Summary
- Global Market Outlook
- Demand-side Trends
- Supply-side Trends
- Technology Roadmap Analysis
- Analysis and Recommendations
- Analyst Perspective (What is happening? Why now? What should investors know?)
- Key Questions Answered
- How large is the market?
- What is the CAGR?
- What are key trends?
- Which region dominates?
- Who are the leaders?
- Market Overview
- Market Coverage / Taxonomy
- Market Definition / Scope / Limitations
- Research Methodology
- Chapter Orientation
- Analytical Lens and Working Hypotheses
- Market Structure, Signals, and Trend Drivers
- Benchmarking and Cross-market Comparability
- Market Sizing, Forecasting, and Opportunity Mapping
- Research Design and Evidence Framework
- Desk Research Programme (Secondary Evidence)
- Expert Input and Fieldwork (Primary Evidence)
- Tooling, Models, and Reference Databases
- Data Engineering and Model Build
- Quality Assurance and Audit Trail
- Market Background
- Market Dynamics (Drivers, Restraints, Opportunity, Trends)
- Scenario Forecast (Optimistic, Likely, Conservative)
- Impact Analysis
- AI Impact
- Sustainability Impact
- Regulatory Impact
- Technology Impact
- Consumer / Buyer Analysis
- Purchase Drivers
- Adoption Barriers
- Buyer Journey
- Opportunity Map Analysis
- Product Life Cycle Analysis
- Supply Chain Analysis
- Investment Feasibility Matrix
- Value Chain Analysis
- PESTLE and Porter's Analysis
- Regulatory Landscape
- Regional Parent Market Outlook
- Production and Consumption Statistics
- Import and Export Statistics
- Global Market Analysis and Forecast, 2021 to 2036
- Historical Market Size Value (USD Million) Analysis, 2021 to 2025
- Current and Future Market Size Value (USD Million) Projections, 2026 to 2036
- Y-o-Y Growth Trend Analysis
- Absolute $ Opportunity Analysis
- Global Market Pricing Analysis, 2021 to 2036
- Global Market Analysis and Forecast, By Polymer Type, 2021 to 2036
- Introduction / Key Findings
- Historical Market Size Value (USD Million) Analysis By Polymer Type, 2021 to 2025
- Current and Future Market Size Value (USD Million) Analysis and Forecast By Polymer Type, 2026 to 2036
- PEEK / PEKK
- PPS
- PEI / PSU
- POM / Other Engineering Plastics
- PEEK / PEKK
- Y-o-Y Growth Trend Analysis By Polymer Type, 2021 to 2025
- Absolute $ Opportunity Analysis By Polymer Type, 2026 to 2036
- Global Market Analysis and Forecast, By Tolerance Class, 2021 to 2036
- Introduction / Key Findings
- Historical Market Size Value (USD Million) Analysis By Tolerance Class, 2021 to 2025
- Current and Future Market Size Value (USD Million) Analysis and Forecast By Tolerance Class, 2026 to 2036
- Standard Precision
- High Precision
- Ultra-High Precision
- Standard Precision
- Y-o-Y Growth Trend Analysis By Tolerance Class, 2021 to 2025
- Absolute $ Opportunity Analysis By Tolerance Class, 2026 to 2036
- Global Market Analysis and Forecast, By Application, 2021 to 2036
- Introduction / Key Findings
- Historical Market Size Value (USD Million) Analysis By Application, 2021 to 2025
- Current and Future Market Size Value (USD Million) Analysis and Forecast By Application, 2026 to 2036
- Gears and Bearings
- Connector Components
- Medical Components
- Aerospace / Industrial Parts
- Gears and Bearings
- Y-o-Y Growth Trend Analysis By Application, 2021 to 2025
- Absolute $ Opportunity Analysis By Application, 2026 to 2036
- Global Market Analysis and Forecast, By End Use, 2021 to 2036
- Introduction / Key Findings
- Historical Market Size Value (USD Million) Analysis By End Use, 2021 to 2025
- Current and Future Market Size Value (USD Million) Analysis and Forecast By End Use, 2026 to 2036
- Automotive
- Electronics
- Medical Devices
- Aerospace
- Industrial
- Automotive
- Y-o-Y Growth Trend Analysis By End Use, 2021 to 2025
- Absolute $ Opportunity Analysis By End Use, 2026 to 2036
- Global Market Analysis and Forecast, By Sales Channel, 2021 to 2036
- Introduction / Key Findings
- Historical Market Size Value (USD Million) Analysis By Sales Channel, 2021 to 2025
- Current and Future Market Size Value (USD Million) Analysis and Forecast By Sales Channel, 2026 to 2036
- Direct OEM
- Precision Molders
- Distributors
- Direct OEM
- Y-o-Y Growth Trend Analysis By Sales Channel, 2021 to 2025
- Absolute $ Opportunity Analysis By Sales Channel, 2026 to 2036
- Global Market Analysis and Forecast, By Region, 2021 to 2036
- Introduction
- Historical Market Size Value (USD Million) Analysis By Region, 2021 to 2025
- Current Market Size Value (USD Million) Analysis and Forecast By Region, 2026 to 2036
- North America
- Latin America
- Western Europe
- Eastern Europe
- East Asia
- South Asia and Pacific
- Middle East & Africa
- Market Attractiveness Analysis By Region
- North America Market Analysis and Forecast, By Country, 2021 to 2036
- Historical Market Size Value (USD Million) Trend Analysis By Market Taxonomy, 2021 to 2025
- Market Size Value (USD Million) Forecast By Market Taxonomy, 2026 to 2036
- By Country
- USA
- Canada
- By Polymer Type
- By Tolerance Class
- By Application
- By End Use
- By Sales Channel
- By Country
- Market Attractiveness Analysis
- By Country
- By Polymer Type
- By Tolerance Class
- By Application
- By End Use
- By Sales Channel
- Key Takeaways
- Latin America Market Analysis and Forecast, By Country
- Historical Market Size Value (USD Million) Trend Analysis By Market Taxonomy, 2021 to 2025
- Market Size Value (USD Million) Forecast By Market Taxonomy, 2026 to 2036
- By Country
- Brazil
- Mexico
- Chile
- Rest of Latin America
- By Polymer Type
- By Tolerance Class
- By Application
- By End Use
- By Sales Channel
- By Country
- Market Attractiveness Analysis
- By Country
- By Polymer Type
- By Tolerance Class
- By Application
- By End Use
- By Sales Channel
- Key Takeaways
- Western Europe Market Analysis and Forecast, By Country
- Historical Market Size Value (USD Million) Trend Analysis By Market Taxonomy, 2021 to 2025
- Market Size Value (USD Million) Forecast By Market Taxonomy, 2026 to 2036
- By Country
- Germany
- UK
- Italy
- Spain
- France
- Nordic
- BENELUX
- Rest of Western Europe
- By Polymer Type
- By Tolerance Class
- By Application
- By End Use
- By Sales Channel
- By Country
- Market Attractiveness Analysis
- By Country
- By Polymer Type
- By Tolerance Class
- By Application
- By End Use
- By Sales Channel
- Key Takeaways
- Eastern Europe Market Analysis and Forecast, By Country
- Historical Market Size Value (USD Million) Trend Analysis By Market Taxonomy, 2021 to 2025
- Market Size Value (USD Million) Forecast By Market Taxonomy, 2026 to 2036
- By Country
- Russia
- Poland
- Hungary
- Balkan & Baltic
- Rest of Eastern Europe
- By Polymer Type
- By Tolerance Class
- By Application
- By End Use
- By Sales Channel
- By Country
- Market Attractiveness Analysis
- By Country
- By Polymer Type
- By Tolerance Class
- By Application
- By End Use
- By Sales Channel
- Key Takeaways
- East Asia Market Analysis and Forecast, By Country
- Historical Market Size Value (USD Million) Trend Analysis By Market Taxonomy, 2021 to 2025
- Market Size Value (USD Million) Forecast By Market Taxonomy, 2026 to 2036
- By Country
- China
- Japan
- South Korea
- By Polymer Type
- By Tolerance Class
- By Application
- By End Use
- By Sales Channel
- By Country
- Market Attractiveness Analysis
- By Country
- By Polymer Type
- By Tolerance Class
- By Application
- By End Use
- By Sales Channel
- Key Takeaways
- South Asia and Pacific Market Analysis and Forecast, By Country
- Historical Market Size Value (USD Million) Trend Analysis By Market Taxonomy, 2021 to 2025
- Market Size Value (USD Million) Forecast By Market Taxonomy, 2026 to 2036
- By Country
- India
- ASEAN
- Australia & New Zealand
- Rest of South Asia and Pacific
- By Polymer Type
- By Tolerance Class
- By Application
- By End Use
- By Sales Channel
- By Country
- Market Attractiveness Analysis
- By Country
- By Polymer Type
- By Tolerance Class
- By Application
- By End Use
- By Sales Channel
- Key Takeaways
- Middle East & Africa Market Analysis and Forecast, By Country
- Historical Market Size Value (USD Million) Trend Analysis By Market Taxonomy, 2021 to 2025
- Market Size Value (USD Million) Forecast By Market Taxonomy, 2026 to 2036
- By Country
- Kingdom of Saudi Arabia
- Other GCC Countries
- Türkiye
- South Africa
- Other African Union
- Rest of Middle East & Africa
- By Polymer Type
- By Tolerance Class
- By Application
- By End Use
- By Sales Channel
- By Country
- Market Attractiveness Analysis
- By Country
- By Polymer Type
- By Tolerance Class
- By Application
- By End Use
- By Sales Channel
- Key Takeaways
- Key Countries Market Analysis
- USA
- Pricing Analysis
- Market Share Analysis, 2025
- By Polymer Type
- By Tolerance Class
- By Application
- By End Use
- By Sales Channel
- Canada
- Pricing Analysis
- Market Share Analysis, 2025
- By Polymer Type
- By Tolerance Class
- By Application
- By End Use
- By Sales Channel
- Mexico
- Pricing Analysis
- Market Share Analysis, 2025
- By Polymer Type
- By Tolerance Class
- By Application
- By End Use
- By Sales Channel
- Brazil
- Pricing Analysis
- Market Share Analysis, 2025
- By Polymer Type
- By Tolerance Class
- By Application
- By End Use
- By Sales Channel
- Chile
- Pricing Analysis
- Market Share Analysis, 2025
- By Polymer Type
- By Tolerance Class
- By Application
- By End Use
- By Sales Channel
- Germany
- Pricing Analysis
- Market Share Analysis, 2025
- By Polymer Type
- By Tolerance Class
- By Application
- By End Use
- By Sales Channel
- UK
- Pricing Analysis
- Market Share Analysis, 2025
- By Polymer Type
- By Tolerance Class
- By Application
- By End Use
- By Sales Channel
- Italy
- Pricing Analysis
- Market Share Analysis, 2025
- By Polymer Type
- By Tolerance Class
- By Application
- By End Use
- By Sales Channel
- Spain
- Pricing Analysis
- Market Share Analysis, 2025
- By Polymer Type
- By Tolerance Class
- By Application
- By End Use
- By Sales Channel
- France
- Pricing Analysis
- Market Share Analysis, 2025
- By Polymer Type
- By Tolerance Class
- By Application
- By End Use
- By Sales Channel
- India
- Pricing Analysis
- Market Share Analysis, 2025
- By Polymer Type
- By Tolerance Class
- By Application
- By End Use
- By Sales Channel
- ASEAN
- Pricing Analysis
- Market Share Analysis, 2025
- By Polymer Type
- By Tolerance Class
- By Application
- By End Use
- By Sales Channel
- Australia & New Zealand
- Pricing Analysis
- Market Share Analysis, 2025
- By Polymer Type
- By Tolerance Class
- By Application
- By End Use
- By Sales Channel
- China
- Pricing Analysis
- Market Share Analysis, 2025
- By Polymer Type
- By Tolerance Class
- By Application
- By End Use
- By Sales Channel
- Japan
- Pricing Analysis
- Market Share Analysis, 2025
- By Polymer Type
- By Tolerance Class
- By Application
- By End Use
- By Sales Channel
- South Korea
- Pricing Analysis
- Market Share Analysis, 2025
- By Polymer Type
- By Tolerance Class
- By Application
- By End Use
- By Sales Channel
- Russia
- Pricing Analysis
- Market Share Analysis, 2025
- By Polymer Type
- By Tolerance Class
- By Application
- By End Use
- By Sales Channel
- Poland
- Pricing Analysis
- Market Share Analysis, 2025
- By Polymer Type
- By Tolerance Class
- By Application
- By End Use
- By Sales Channel
- Hungary
- Pricing Analysis
- Market Share Analysis, 2025
- By Polymer Type
- By Tolerance Class
- By Application
- By End Use
- By Sales Channel
- Kingdom of Saudi Arabia
- Pricing Analysis
- Market Share Analysis, 2025
- By Polymer Type
- By Tolerance Class
- By Application
- By End Use
- By Sales Channel
- Türkiye
- Pricing Analysis
- Market Share Analysis, 2025
- By Polymer Type
- By Tolerance Class
- By Application
- By End Use
- By Sales Channel
- South Africa
- Pricing Analysis
- Market Share Analysis, 2025
- By Polymer Type
- By Tolerance Class
- By Application
- By End Use
- By Sales Channel
- USA
- Market Structure Analysis
- Competition Dashboard
- Competition Benchmarking
- Market Share Analysis of Top Players
- By Regional
- By Polymer Type
- By Tolerance Class
- By Application
- By End Use
- By Sales Channel
- Emerging Startups
- Innovation Benchmarking
- Competition Analysis
- Competition Deep Dive
- Victrex
- Overview
- Product Portfolio
- Profitability by Market Segments
- Sales Footprint
- Strategy Overview
- Marketing Strategy
- Product Strategy
- Channel Strategy
- Syensqo
- SABIC
- Celanese
- Ensinger
- Röchling
- Mitsubishi Chemical Group
- Saint-Gobain
- DuPont
- Victrex
- Case Studies
- Success Stories
- Recent Developments
- Competition Deep Dive
- Assumptions & Acronyms Used


