Reports

- Global Locations -

Headquarters

Future Market Insights, Inc.

Christiana Corporate, 200
Continental Drive, Suite 401,
Newark, Delaware - 19713,
United States

T: +1-845-579-5705

Americas

Future Market Insights, Inc.

616 Corporate Way, Suite 2-9018,
Valley Cottage, NY 10989, United States

T: +1-347-918-3531

MEA

Future Market Insights

1602-6 Jumeirah Bay X2 Tower, Plot No: JLT-PH2-X2A,
Jumeirah Lakes Towers, Dubai,
United Arab Emirates

Europe

Future Market Insights

3rd Floor, 207 Regent Street,
W1B 3HH London
United Kingdom

T: + 44 (0) 20 8123 9659
D: +44 (0) 20 3287 4268

Asia Pacific

Future Market Insights

IndiaLand Global Tech Park, Unit UG-1, Behind Grand HighStreet, Phase 1, Hinjawadi, MH, Pune – 411057, India

Isovaleric Acidemia Treatment Market Snapshot (2023 to 2033)

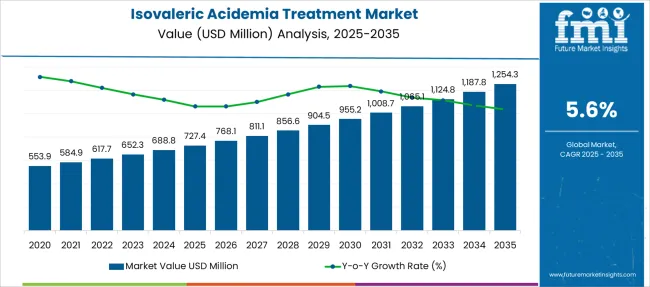
The global isovaleric acidemia treatment market is expected to reach a valuation of US$ 652.28 Million in 2023 and is projected to reach US$ 1,125.15 by 2033, trailing at a CAGR of 5.6%. Presently, genetic screening using mass spectrometry and DNA testing among all newborns is carried out in almost all of the developed nations of the world and also in developing economies of India, Brazil, and China. This helps uncover inherited metabolic disorders (IMD) at an early stage which is driving the market growth.

However, among many adult populations and in some children, rare genetic metabolic disorders are abruptly presented and often not accurately diagnosed. In such individuals, abnormal metabolic changes are considered to be a type of genetic mutation in routine diagnosis. The treatment of IMDs is broadly classified into dietary restrictions, dietary supplementation, drugs that inhibit or regulate metabolism, transplantation of the concerned organ, gene therapy, and dialysis in severe cases. In the case of familial chylomicronemia, gene therapy includes Alipogene tiparvovec recombinant gene therapy drug, manufactured by UniQure Inc.

This therapy utilizes viruses (adenovirus vector) designed in such a way that upon infection, the gene for producing the lipoprotein lipase is induced into the host cell, thereby producing the enzyme in-vivo. This therapy has shown positive results and is expected to be released into the market soon which presents opportunistic prospects for market expansion. For now, the global inherited metabolic disorders Market lies broadly in the dietary supplements market which is supporting market growth.

The use of genetic markers in T-cell receptor excision circles for severe combined immunodeficiency is one promising technique that augments market expansion. Moreover, the use of tandem mass spectrometry for the diagnosis of inborn errors of metabolism has the potential to expand the newborn screening panel which will propel the diagnostic market for isovaleric acidemia treatment.

Report Attribute Details
Expected Market Value (2023) US$ 652.28 Million
Anticipated Forecast Value (2033) US$ 1,125.15 Million
Projected Growth Rate (2023 to 2033) CAGR 5.6%

Don't pay for what you don't need

Customize your report by selecting specific countries or regions and save 30%!

2018 to 2022 Isovaleric Acidemia Treatment Demand Analysis vs. Forecast 2023 to 2033

The isovaleric acidemia treatment market was valued at US$ 520 Million in 2018 while exhibiting a CAGR of 4.64%. Adoption of new technology such as mRNA in metabolic testing procedures is expected to shift the pharmaceutical industry to new heights which are augmenting the demand for the Isovaleric Acidemia treatment market. Considering these factors, the market is estimated to be valued at US$ 1,125.15 Million, growing at a CAGR of 5.6% by end of the forecast period.

Which are Some Prominent Drivers of the Isovaleric Acidemia Treatment Market?

The advent of new technologies in IVA fuelling market growth

The advent of tandem mass spectrometry expanded newborn screening (NBS) and has become a mandatory public health strategy in most developed and developing countries, which will drive market growth. Moreover, this technology allows inexpensive simultaneous detection of more than 30 different metabolic disorders like Isovaleric Acidemia Treatment, in one single blood spot specimen at a cost of about US$ 10 per baby, with commendable analytical accuracy and precision, which will bolster the demand for Isovaleric Acidemia Treatment drug and therapeutics during the forecast period. studies have confirmed that the savings achieved through the use of expanded NBS programs are significantly greater than the costs of implementation.

Autonomy for local screening agencies to develop their screening programs in order to keep pace with international advancements is expected to support market expansion. Integration of existing clinical IEM services with the expanded NBS program to enable close communication between the laboratory, clinicians, and allied health parties.

The adjuvant therapy with sapropterin is also helpful for PKU treatment. In recent years, private medical insurers in the US and a few other countries are also offering reimbursement programs for the consumption of certain medical foods. Thus, the rising adoption of medical food and nutrient supplements is expected to foster market growth during the forecast period.

Sabyasachi Ghosh
Sabyasachi Ghosh

Principal Consultant

Talk to Analyst

Find your sweet spots for generating winning opportunities in this market.

What are the Challenges Projected to be Faced by the Market?

High cost of diagnostic treatment restraining market expansion

Inadequate reimbursement scenario, high cost of treatment and delayed adoption of new emerging diagnostic and therapeutic technologies will restrain the market growth during the forecast period.

Region-Wise Insights

North America dominates the market with the highest market share

North America was the largest market for Isovaleric Acidemia Treatment therapeutics with a market share of 41.8% in 2022. The market revenue in this region is projected to be valued at around US$ 520 Million by 2033. It is likely to show prominent growth while retaining its dominance during the forecast period. This is due to the increase in demand for sapropterin and kuvan for amino acid metabolism disorders treatments in the region. Moreover, the region boasts of a wide availability of treatments and a well-established healthcare infrastructure.

The extensive presence of several end-users focusing on treatment and studies of chronic disease makes use of metabolomics, and this is the primary driver of market growth in the region. The active participation of the government in the form of investment and world-class resources for research activities is driving the growth of the metabolomics market in the region of Canada.

Mounting Investments in APAC to drive the market with the fastest CAGR

The market in Asia Pacific is estimated to be valued at US$ 350 Million, trailing at a CAGR of 4.9% during the forecast period. Growing investments in diagnostic healthcare, increasing adoption of new technologies, rising prevalence of inherited metabolic disorders in other regions, and increasing awareness regarding health are fuelling the demand for isovaleric acidemia disorder therapeutics in the region. China is expected to dominate the Inborn errors of metabolism market with more than 41% market share in this region owing to the rapid adoption of mRNA technology in diagnostics and surging advancements in the medical sector.

Get the data you need at a Fraction of the cost

Personalize your report by choosing insights you need
and save 40%!

Category wise Insights

L-Carnitine Supplements to dominate the market by treatment type

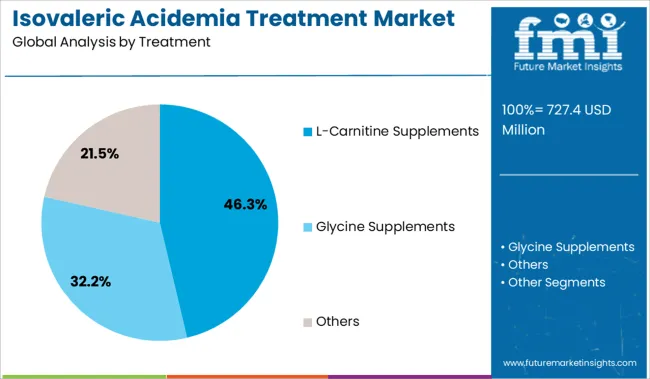
The supplements carnitine and glycine can reduce the toxicity of isovaleric acid and aid in its removal from the body. L-Carnitine supplements are expected to dominate the treatment segment with a share of 79% and are projected to retain the highest weight during the forecast period.

Administration of equimolar amounts of glycine or L-carnitine separately with leucine demonstrated that isovaleryl-coenzyme A is removed by supplemental L-carnitine in the form of isovalerylcarnitine as effectively as it is by glycine, in the form of isovalerylglycine. Treatment with L-carnitine alone has proven effective in preventing further hospitalizations in a patient with this disorder, which will drive the segment growth by end of the forecast period.
Start-ups in Isovaleric Acidemia Treatment Market

  • Founded in 2013, ‘Aeglea Biotherapeutics’ is a US-based startup that is developing novel treatments for inborn errors of metabolism and cancer by using engineered human amino acid degrading enzymes. Aeglea's lead program AEB1102 is in pre-clinical development and is expected to lower elevated arginine in blood as enzyme replacement therapy for Arginase 1 deficiency and treatment of arginine-dependent tumors. It received funding of USD 56 million from Novartis Venture Fund, Lilly Ventures, and 7 more investors.
  • Founded in 2015, Fulcrum Therapeutics is a US-based company, focused on discovering and developing small molecules that modulate the on/off control mechanisms that regulate genes. The Fulcrum product engine integrates insights from four scientific disciplines (Gene Regulation, Human Genetics and Disease, Cell Biology, and Screening and Computation) to identify novel drug targets and develop breakthrough medicines. The early focus of Fulcrum’s product engine is on two severe genetic diseases: Fragile X syndrome (FXS) and a form of muscular dystrophy called facioscapulohumeral muscular dystrophy (FSHD). Each disease arises from a single gene mutation that creates an error in gene regulation. In the case of Fragile X, the silencing of the FMR1 gene eliminates the cell’s ability to make a protein needed for brain function. In FSHD, the precipitating event is the activation of a gene called DUX4 that should be silent in adulthood. This activation leads to muscle wasting as cells die. It received funding of USD 115 million from EcoR1, Highliner Capital, Boxer Capital, and 14 Other Investors.
  • Founded in 2002, Alnalym is a US-based developer of RNA interference-based therapeutics for multiple disorders. The company's pipeline includes drugs that are used to treat hereditary ATTR Amyloidosis, acute hepatic porphyria, and in treating hypercholesterolemia. Further, it develops drugs for cardiometabolic diseases, infectious diseases, central nervous system, and ocular diseases. It received funding of USD 17 million from Blackstone, Genzyme, Polaris Partners, and 11 Other Investors.

Market Competition

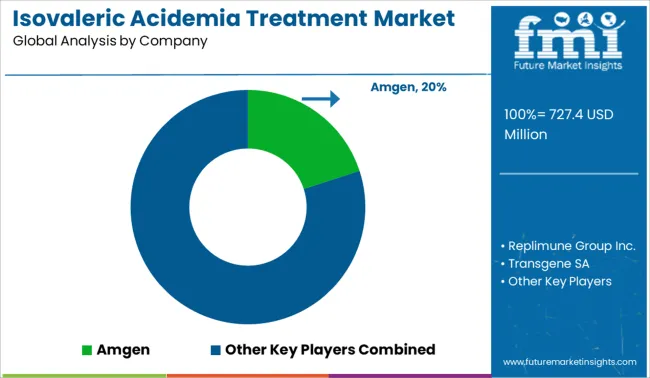
Key players in the Isovaleric Acidemia Treatment Market are Amgen, Replimune Group Inc., Transgene SA, Oncolys BioPharma, Targovax, Lokon Pharma, Vyriad, TILT Biotherapeutics, VCNBiosciences, DNAtrix.

Some Recent Developments in this industry are:

  • In 2020, Nutricia established a sustainable plant in the Netherlands. The Nutricia Cuijk plant was a massive investment that increased the volume of specialized infant formula and the market's revenue generation.
  • In June 2022, Mead Johnson & Company, LLC announced that it had been completely merged with Reckitt Benckiser Group plc (RB). With Reckitt Benckiser plc groups' good innovation and marketing processes, it was expected that the Mead Johnson brand and business would continue to boom.
  • On February 17, 2022, Maze Therapeutics, a company translating genetic insights into new precision medicines, announced the initiation of dosing in the company’s Phase 1 clinical trial of MZE001 in healthy volunteers. MZE001, an oral glycogen synthase (GYS1) inhibitor that aims to address Pompe disease by limiting disease-causing glycogen buildup, is being evaluated for the potential oral treatment of patients with late-onset Pompe disease.
  • On May 15, 2020, Ultragenyx Pharmaceutical Inc., a biopharmaceutical company focused on the development and commercialization of novel products for rare and ultra-rare diseases, announced positive initial data from the confirmatory third cohort and longer-term data from the first two cohorts of the ongoing Phase 1/2 study of DTX401, an adeno-associated virus (AAV) based gene therapy for the treatment of glycogen storage disease type Ia (GSDIa).

Report Scope

Report Attribute Details
Market Value in 2023 US$ 652.28 Million
Market Value in 2033 US$ 1,125.15 Million
Growth Rate CAGR of 5.6% from 2023 to 2033
Base Year for Estimation 2022
Historical Data 2018 to 2022
Forecast Period 2023 to 2033
Quantitative Units Revenue in US Million and CAGR from 2023 to 2033
Report Coverage Revenue Forecast, Volume Forecast, Company Ranking, Competitive Landscape, Growth Factors, Trends, and Pricing Analysis
Segments Covered
  • Treatment
  • Region
Regions Covered
  • North America
  • Latin America
  • Europe
  • Asia Pacific
  • Middle East & Africa (MEA)
Key Countries Profiled
  • The US
  • Canada
  • Brazil
  • Mexico
  • Germany
  • The UK
  • France
  • Spain
  • Russia
  • Italy
  • India
  • China
  • Japan
  • South Korea
  • Saudi Arabia
  • Australia
  • New Zealand
  • UAE
  • South Africa
  • Israel
Key Companies Profiled
  • Amgen
  • Replimune Group Inc.
  • Transgene SA
  • Oncolys BioPharma
  • Targovax
  • Lokon Pharma
  • Vyriad
  • TILT Biotherapeutics
  • VCNBiosciences
  • DNAtrix
Customization Available Upon Request

Key Segments Profiled in the Isovaleric Acidemia Treatment Market Industry Survey

By Treatment:

  • L-Carnitine Supplements
  • Glycine Supplements
  • Others

By Region:

  • North America
  • Latin America
  • Europe
  • Asia Pacific
  • Middle East & Africa (MEA)

Frequently Asked Questions

What is the anticipated growth of the Isovaleric Acidemia Treatment Market until 2033?

FMI projects the global Isovaleric Acidemia Treatment Market to expand at a 5.6% value CAGR by 2033.

What is the estimated market value of the Isovaleric Acidemia Treatment Market expected in 2033?

The global Isovaleric Acidemia Treatment Market is expected to garner a market value of US$ 1,125.15 Million by 2033.

Which region is forecast to be the most lucrative for Isovaleric Acidemia Treatment Market growth?

FMI has projected North America to be one of the most profitable regions for the Isovaleric Acidemia Treatment Market.

Which region is expected to grow fastest during the forecast period?

APAC region is expected to grow fastest during the forecast period.

Table of Content

1. Executive Summary | Isovaleric Acidemia Treatment Market

    1.1. Global Market Outlook

    1.2. Demand-side Trends

    1.3. Supply-side Trends

    1.4. Technology Roadmap Analysis

    1.5. Analysis and Recommendations

2. Market Overview

    2.1. Market Coverage / Taxonomy

    2.2. Market Definition / Scope / Limitations

3. Market Background

    3.1. Market Dynamics

        3.1.1. Drivers

        3.1.2. Restraints

        3.1.3. Opportunity

        3.1.4. Trends

    3.2. Scenario Forecast

        3.2.1. Demand in Optimistic Scenario

        3.2.2. Demand in Likely Scenario

        3.2.3. Demand in Conservative Scenario

    3.3. Opportunity Map Analysis

    3.4. Product Life Cycle Analysis

    3.5. Investment Feasibility Matrix

    3.6. PESTLE and Porter’s Analysis

    3.7. Regulatory Landscape

        3.7.1. By Key Regions

        3.7.2. By Key Countries

    3.8. Regional Parent Market Outlook

4. Global Market Analysis 2018 to 2022 and Forecast, 2023 to 2033

    4.1. Historical Market Size Value (US$ Million) Analysis, 2018 to 2022

    4.2. Current and Future Market Size Value (US$ Million) Projections, 2023 to 2033

        4.2.1. Y-o-Y Growth Trend Analysis

        4.2.2. Absolute $ Opportunity Analysis

5. Global Market Analysis 2018 to 2022 and Forecast 2023 to 2033, By Treatment

    5.1. Introduction / Key Findings

    5.2. Historical Market Size Value (US$ Million) Analysis By Treatment, 2018 to 2022

    5.3. Current and Future Market Size Value (US$ Million) Analysis and Forecast By Treatment, 2023 to 2033

        5.3.1. Glycine supplements

        5.3.2. L-carnitine supplements

        5.3.3. Others

    5.4. Y-o-Y Growth Trend Analysis By Treatment, 2018 to 2022

    5.5. Absolute $ Opportunity Analysis By Treatment, 2023 to 2033

6. Global Market Analysis 2018 to 2022 and Forecast 2023 to 2033, By Region

    6.1. Introduction

    6.2. Historical Market Size Value (US$ Million) Analysis By Region, 2018 to 2022

    6.3. Current Market Size Value (US$ Million) Analysis and Forecast By Region, 2023 to 2033

        6.3.1. North America

        6.3.2. Latin America

        6.3.3. Europe

        6.3.4. Asia Pacific

        6.3.5. Middle East and Africa

    6.4. Market Attractiveness Analysis By Region

7. North America Market Analysis 2018 to 2022 and Forecast 2023 to 2033, By Country

    7.1. Historical Market Size Value (US$ Million) Trend Analysis By Market Taxonomy, 2018 to 2022

    7.2. Market Size Value (US$ Million) Forecast By Market Taxonomy, 2023 to 2033

        7.2.1. By Country

            7.2.1.1. The US

            7.2.1.2. Canada

        7.2.2. By Treatment

    7.3. Market Attractiveness Analysis

        7.3.1. By Country

        7.3.2. By Treatment

    7.4. Key Takeaways

8. Latin America Market Analysis 2018 to 2022 and Forecast 2023 to 2033, By Country

    8.1. Historical Market Size Value (US$ Million) Trend Analysis By Market Taxonomy, 2018 to 2022

    8.2. Market Size Value (US$ Million) Forecast By Market Taxonomy, 2023 to 2033

        8.2.1. By Country

            8.2.1.1. Brazil

            8.2.1.2. Mexico

            8.2.1.3. Rest of Latin America

        8.2.2. By Treatment

    8.3. Market Attractiveness Analysis

        8.3.1. By Country

        8.3.2. By Treatment

    8.4. Key Takeaways

9. Europe Market Analysis 2018 to 2022 and Forecast 2023 to 2033, By Country

    9.1. Historical Market Size Value (US$ Million) Trend Analysis By Market Taxonomy, 2018 to 2022

    9.2. Market Size Value (US$ Million) Forecast By Market Taxonomy, 2023 to 2033

        9.2.1. By Country

            9.2.1.1. Germany

            9.2.1.2. The UK

            9.2.1.3. France

            9.2.1.4. Spain

            9.2.1.5. Italy

            9.2.1.6. Russia

            9.2.1.7. Rest of Europe

        9.2.2. By Treatment

    9.3. Market Attractiveness Analysis

        9.3.1. By Country

        9.3.2. By Treatment

    9.4. Key Takeaways

10. Asia Pacific Market Analysis 2018 to 2022 and Forecast 2023 to 2033, By Country

    10.1. Historical Market Size Value (US$ Million) Trend Analysis By Market Taxonomy, 2018 to 2022

    10.2. Market Size Value (US$ Million) Forecast By Market Taxonomy, 2023 to 2033

        10.2.1. By Country

            10.2.1.1. China

            10.2.1.2. Japan

            10.2.1.3. India

            10.2.1.4. South Korea

            10.2.1.5. Australia

            10.2.1.6. Rest of APAC

        10.2.2. By Treatment

    10.3. Market Attractiveness Analysis

        10.3.1. By Country

        10.3.2. By Treatment

    10.4. Key Takeaways

11. Middle East and Africa Market Analysis 2018 to 2022 and Forecast 2023 to 2033, By Country

    11.1. Historical Market Size Value (US$ Million) Trend Analysis By Market Taxonomy, 2018 to 2022

    11.2. Market Size Value (US$ Million) Forecast By Market Taxonomy, 2023 to 2033

        11.2.1. By Country

            11.2.1.1. South Africa

            11.2.1.2. Saudi Arabia

            11.2.1.3. UAE

            11.2.1.4. Israel

            11.2.1.5. Rest of MEA

        11.2.2. By Treatment

    11.3. Market Attractiveness Analysis

        11.3.1. By Country

        11.3.2. By Treatment

    11.4. Key Takeaways

12. Key Countries Market Analysis

    12.1. The US

        12.1.1. Pricing Analysis

        12.1.2. Market Share Analysis, 2022

            12.1.2.1. By Treatment

    12.2. Canada

        12.2.1. Pricing Analysis

        12.2.2. Market Share Analysis, 2022

            12.2.2.1. By Treatment

    12.3. Brazil

        12.3.1. Pricing Analysis

        12.3.2. Market Share Analysis, 2022

            12.3.2.1. By Treatment

    12.4. Mexico

        12.4.1. Pricing Analysis

        12.4.2. Market Share Analysis, 2022

            12.4.2.1. By Treatment

    12.5. Germany

        12.5.1. Pricing Analysis

        12.5.2. Market Share Analysis, 2022

            12.5.2.1. By Treatment

    12.6. The UK

        12.6.1. Pricing Analysis

        12.6.2. Market Share Analysis, 2022

            12.6.2.1. By Treatment

    12.7. France

        12.7.1. Pricing Analysis

        12.7.2. Market Share Analysis, 2022

            12.7.2.1. By Treatment

    12.8. Spain

        12.8.1. Pricing Analysis

        12.8.2. Market Share Analysis, 2022

            12.8.2.1. By Treatment

    12.9. Italy

        12.9.1. Pricing Analysis

        12.9.2. Market Share Analysis, 2022

            12.9.2.1. By Treatment

    12.10. Russia

        12.10.1. Pricing Analysis

        12.10.2. Market Share Analysis, 2022

            12.10.2.1. By Treatment

    12.11. China

        12.11.1. Pricing Analysis

        12.11.2. Market Share Analysis, 2022

            12.11.2.1. By Treatment

    12.12. Japan

        12.12.1. Pricing Analysis

        12.12.2. Market Share Analysis, 2022

            12.12.2.1. By Treatment

    12.13. India

        12.13.1. Pricing Analysis

        12.13.2. Market Share Analysis, 2022

            12.13.2.1. By Treatment

    12.14. South Korea

        12.14.1. Pricing Analysis

        12.14.2. Market Share Analysis, 2022

            12.14.2.1. By Treatment

    12.15. Australia

        12.15.1. Pricing Analysis

        12.15.2. Market Share Analysis, 2022

            12.15.2.1. By Treatment

    12.16. South Africa

        12.16.1. Pricing Analysis

        12.16.2. Market Share Analysis, 2022

            12.16.2.1. By Treatment

    12.17. Saudi Arabia

        12.17.1. Pricing Analysis

        12.17.2. Market Share Analysis, 2022

            12.17.2.1. By Treatment

    12.18. UAE

        12.18.1. Pricing Analysis

        12.18.2. Market Share Analysis, 2022

            12.18.2.1. By Treatment

    12.19. Israel

        12.19.1. Pricing Analysis

        12.19.2. Market Share Analysis, 2022

            12.19.2.1. By Treatment

13. Market Structure Analysis

    13.1. Competition Dashboard

    13.2. Competition Benchmarking

    13.3. Market Share Analysis of Top Players

        13.3.1. By Regional

        13.3.2. By Treatment

14. Competition Analysis

    14.1. Competition Deep Dive

        14.1.1. Amgen

            14.1.1.1. Overview

            14.1.1.2. Product Portfolio

            14.1.1.3. Profitability by Market Segments

            14.1.1.4. Sales Footprint

            14.1.1.5. Strategy Overview

                14.1.1.5.1. Marketing Strategy

        14.1.2. Replimune Group Inc.

            14.1.2.1. Overview

            14.1.2.2. Product Portfolio

            14.1.2.3. Profitability by Market Segments

            14.1.2.4. Sales Footprint

            14.1.2.5. Strategy Overview

                14.1.2.5.1. Marketing Strategy

        14.1.3. Transgene SA

            14.1.3.1. Overview

            14.1.3.2. Product Portfolio

            14.1.3.3. Profitability by Market Segments

            14.1.3.4. Sales Footprint

            14.1.3.5. Strategy Overview

                14.1.3.5.1. Marketing Strategy

        14.1.4. Oncolys BioPharma

            14.1.4.1. Overview

            14.1.4.2. Product Portfolio

            14.1.4.3. Profitability by Market Segments

            14.1.4.4. Sales Footprint

            14.1.4.5. Strategy Overview

                14.1.4.5.1. Marketing Strategy

        14.1.5. Targovax

            14.1.5.1. Overview

            14.1.5.2. Product Portfolio

            14.1.5.3. Profitability by Market Segments

            14.1.5.4. Sales Footprint

            14.1.5.5. Strategy Overview

                14.1.5.5.1. Marketing Strategy

        14.1.6. Lokon Pharma

            14.1.6.1. Overview

            14.1.6.2. Product Portfolio

            14.1.6.3. Profitability by Market Segments

            14.1.6.4. Sales Footprint

            14.1.6.5. Strategy Overview

                14.1.6.5.1. Marketing Strategy

        14.1.7. Vyriad

            14.1.7.1. Overview

            14.1.7.2. Product Portfolio

            14.1.7.3. Profitability by Market Segments

            14.1.7.4. Sales Footprint

            14.1.7.5. Strategy Overview

                14.1.7.5.1. Marketing Strategy

        14.1.8. TILT Biotherapeutics

            14.1.8.1. Overview

            14.1.8.2. Product Portfolio

            14.1.8.3. Profitability by Market Segments

            14.1.8.4. Sales Footprint

            14.1.8.5. Strategy Overview

                14.1.8.5.1. Marketing Strategy

        14.1.9. VCNBiosciences

            14.1.9.1. Overview

            14.1.9.2. Product Portfolio

            14.1.9.3. Profitability by Market Segments

            14.1.9.4. Sales Footprint

            14.1.9.5. Strategy Overview

                14.1.9.5.1. Marketing Strategy

        14.1.10. DNAtrix

            14.1.10.1. Overview

            14.1.10.2. Product Portfolio

            14.1.10.3. Profitability by Market Segments

            14.1.10.4. Sales Footprint

            14.1.10.5. Strategy Overview

                14.1.10.5.1. Marketing Strategy

15. Assumptions & Acronyms Used

16. Research Methodology

Don't pay for what you don't need

Customize your report by selecting specific countries or regions and save 30%!

List of Tables

Table 1: Global Market Value (US$ Million) Forecast by Region, 2018 to 2033

Table 2: Global Market Value (US$ Million) Forecast by Treatment, 2018 to 2033

Table 3: North America Market Value (US$ Million) Forecast by Country, 2018 to 2033

Table 4: North America Market Value (US$ Million) Forecast by Treatment, 2018 to 2033

Table 5: Latin America Market Value (US$ Million) Forecast by Country, 2018 to 2033

Table 6: Latin America Market Value (US$ Million) Forecast by Treatment, 2018 to 2033

Table 7: Europe Market Value (US$ Million) Forecast by Country, 2018 to 2033

Table 8: Europe Market Value (US$ Million) Forecast by Treatment, 2018 to 2033

Table 9: Asia Pacific Market Value (US$ Million) Forecast by Country, 2018 to 2033

Table 10: Asia Pacific Market Value (US$ Million) Forecast by Treatment, 2018 to 2033

Table 11: Middle East and Africa Market Value (US$ Million) Forecast by Country, 2018 to 2033

Table 12: Middle East and Africa Market Value (US$ Million) Forecast by Treatment, 2018 to 2033
Sabyasachi Ghosh
Sabyasachi Ghosh

Principal Consultant

Talk to Analyst

Find your sweet spots for generating winning opportunities in this market.

List of Charts

Figure 1: Global Market Value (US$ Million) by Treatment, 2023 to 2033

Figure 2: Global Market Value (US$ Million) by Region, 2023 to 2033

Figure 3: Global Market Value (US$ Million) Analysis by Region, 2018 to 2033

Figure 4: Global Market Value Share (%) and BPS Analysis by Region, 2023 to 2033

Figure 5: Global Market Y-o-Y Growth (%) Projections by Region, 2023 to 2033

Figure 6: Global Market Value (US$ Million) Analysis by Treatment, 2018 to 2033

Figure 7: Global Market Value Share (%) and BPS Analysis by Treatment, 2023 to 2033

Figure 8: Global Market Y-o-Y Growth (%) Projections by Treatment, 2023 to 2033

Figure 9: Global Market Attractiveness by Treatment, 2023 to 2033

Figure 10: Global Market Attractiveness by Region, 2023 to 2033

Figure 11: North America Market Value (US$ Million) by Treatment, 2023 to 2033

Figure 12: North America Market Value (US$ Million) by Country, 2023 to 2033

Figure 13: North America Market Value (US$ Million) Analysis by Country, 2018 to 2033

Figure 14: North America Market Value Share (%) and BPS Analysis by Country, 2023 to 2033

Figure 15: North America Market Y-o-Y Growth (%) Projections by Country, 2023 to 2033

Figure 16: North America Market Value (US$ Million) Analysis by Treatment, 2018 to 2033

Figure 17: North America Market Value Share (%) and BPS Analysis by Treatment, 2023 to 2033

Figure 18: North America Market Y-o-Y Growth (%) Projections by Treatment, 2023 to 2033

Figure 19: North America Market Attractiveness by Treatment, 2023 to 2033

Figure 20: North America Market Attractiveness by Country, 2023 to 2033

Figure 21: Latin America Market Value (US$ Million) by Treatment, 2023 to 2033

Figure 22: Latin America Market Value (US$ Million) by Country, 2023 to 2033

Figure 23: Latin America Market Value (US$ Million) Analysis by Country, 2018 to 2033

Figure 24: Latin America Market Value Share (%) and BPS Analysis by Country, 2023 to 2033

Figure 25: Latin America Market Y-o-Y Growth (%) Projections by Country, 2023 to 2033

Figure 26: Latin America Market Value (US$ Million) Analysis by Treatment, 2018 to 2033

Figure 27: Latin America Market Value Share (%) and BPS Analysis by Treatment, 2023 to 2033

Figure 28: Latin America Market Y-o-Y Growth (%) Projections by Treatment, 2023 to 2033

Figure 29: Latin America Market Attractiveness by Treatment, 2023 to 2033

Figure 30: Latin America Market Attractiveness by Country, 2023 to 2033

Figure 31: Europe Market Value (US$ Million) by Treatment, 2023 to 2033

Figure 32: Europe Market Value (US$ Million) by Country, 2023 to 2033

Figure 33: Europe Market Value (US$ Million) Analysis by Country, 2018 to 2033

Figure 34: Europe Market Value Share (%) and BPS Analysis by Country, 2023 to 2033

Figure 35: Europe Market Y-o-Y Growth (%) Projections by Country, 2023 to 2033

Figure 36: Europe Market Value (US$ Million) Analysis by Treatment, 2018 to 2033

Figure 37: Europe Market Value Share (%) and BPS Analysis by Treatment, 2023 to 2033

Figure 38: Europe Market Y-o-Y Growth (%) Projections by Treatment, 2023 to 2033

Figure 39: Europe Market Attractiveness by Treatment, 2023 to 2033

Figure 40: Europe Market Attractiveness by Country, 2023 to 2033

Figure 41: Asia Pacific Market Value (US$ Million) by Treatment, 2023 to 2033

Figure 42: Asia Pacific Market Value (US$ Million) by Country, 2023 to 2033

Figure 43: Asia Pacific Market Value (US$ Million) Analysis by Country, 2018 to 2033

Figure 44: Asia Pacific Market Value Share (%) and BPS Analysis by Country, 2023 to 2033

Figure 45: Asia Pacific Market Y-o-Y Growth (%) Projections by Country, 2023 to 2033

Figure 46: Asia Pacific Market Value (US$ Million) Analysis by Treatment, 2018 to 2033

Figure 47: Asia Pacific Market Value Share (%) and BPS Analysis by Treatment, 2023 to 2033

Figure 48: Asia Pacific Market Y-o-Y Growth (%) Projections by Treatment, 2023 to 2033

Figure 49: Asia Pacific Market Attractiveness by Treatment, 2023 to 2033

Figure 50: Asia Pacific Market Attractiveness by Country, 2023 to 2033

Figure 51: Middle East and Africa Market Value (US$ Million) by Treatment, 2023 to 2033

Figure 52: Middle East and Africa Market Value (US$ Million) by Country, 2023 to 2033

Figure 53: Middle East and Africa Market Value (US$ Million) Analysis by Country, 2018 to 2033

Figure 54: Middle East and Africa Market Value Share (%) and BPS Analysis by Country, 2023 to 2033

Figure 55: Middle East and Africa Market Y-o-Y Growth (%) Projections by Country, 2023 to 2033

Figure 56: Middle East and Africa Market Value (US$ Million) Analysis by Treatment, 2018 to 2033

Figure 57: Middle East and Africa Market Value Share (%) and BPS Analysis by Treatment, 2023 to 2033

Figure 58: Middle East and Africa Market Y-o-Y Growth (%) Projections by Treatment, 2023 to 2033

Figure 59: Middle East and Africa Market Attractiveness by Treatment, 2023 to 2033

Figure 60: Middle East and Africa Market Attractiveness by Country, 2023 to 2033

Recommendations

Healthcare

Amino Acid Metabolism Disorders Treatment Market

Published : February 2018

Explore Healthcare Insights

View Reports

Isovaleric Acidemia Treatment Market